
How to Troubleshoot Common Issues in Circulating Fluidized Bed Boilers?
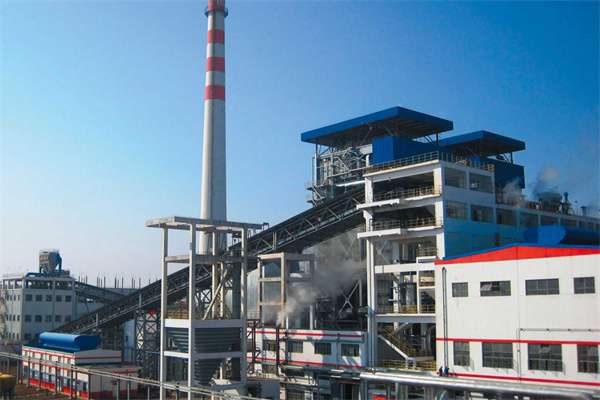
Unplanned shutdowns on a CFB boiler rarely announce themselves politely. More often, you’re chasing a symptom — unstable bed pressure, climbing exit gas temperature, a cyclone that’s clearly not doing its job anymore — while the plant is still trying to run. Left unresolved, those symptoms compound fast: defluidization can slag a bed in hours, persistent erosion quietly thins tube walls past the point of safe operation, and a blocked air distributor can push specific fuel consumption up by a margin that shows up painfully on the monthly gas bill. The fixes exist, but finding the right one depends on reading the boiler correctly from the start.
The most common CFB boiler problems fall into five categories: defluidization and bed pressure deviation, tube erosion, cyclone separator wear or seal failure, air distributor blockage, and combustion instability from fuel quality swings. Diagnosing each requires checking fluidization velocity (target 4–8 m/s), bed pressure drop (normal 6–12 kPa), and bed temperature (850–950°C) as a baseline before chasing individual components.
What makes CFB troubleshooting genuinely tricky — and different from troubleshooting a pulverized coal or gas-fired unit — is that most failure modes are interconnected. A partially blocked air distributor doesn’t just raise pressure drop; it creates localized dead zones that shift the solids circulation pattern, which then loads the cyclone unevenly, which accelerates wear on one side of the return leg. Pull one thread and the whole web moves. The sections below work through each major failure mode with that interconnected reality in mind.
Diagnosing Bed Defluidization and Abnormal Pressure Drop Patterns
Defluidization is the failure mode that keeps CFB operators up at night — and rightly so. When the bed transitions from a turbulent, well-mixed suspension into a slugging or fixed mass, you lose combustion uniformity almost instantly, and what follows can range from localized overheating to a full emergency shutdown. The underlying physics is straightforward: fluidization requires gas velocity through the bed to exceed the minimum fluidization velocity for the particle size distribution present. In practice, that threshold sits around 3 m/s for typical coal-fired CFB inventory, and anything below that invites trouble.
The primary alarm threshold most operations use is a bed differential pressure collapse below 4 kPa. Normal operating range runs 6–12 kPa depending on bed inventory, fuel type, and load — but the exact value depends heavily on your specific particle size distribution and bed height. If you see that number trending toward 4 kPa without a corresponding load reduction, treat it as a serious warning, not a data glitch.
Root Causes Worth Investigating First
Oversized fuel particles are the most common culprit on coal-fired units. Feed particles larger than roughly 10 mm don’t fluidize properly — they settle toward the distributor, create dead zones, and can begin sintering if the local temperature climbs. On biomass co-firing or dedicated biomass CFB units, wet feed is a different but equally nasty problem: moisture-laden material clumps at the feed points, and you get localized agglomerates that grow until they choke bed circulation.
Chemical sintering deserves more attention than it typically gets. At bed temperatures above 950°C — which happens when load control or limestone injection drifts — calcium sulfate (CaSO₄) and alkali silicates can fuse bed particles together. Alkali silicate sintering is particularly aggressive with high-alkali biomass fuels like rice straw or certain agricultural residues. Once you have a sintered mass, restoring fluidization means breaking it up mechanically, which is a much harder recovery than simply boosting air flow.
Reading the Pressure Tap Distribution
Most CFBs have pressure taps at multiple elevations — typically at the air distributor, lower furnace, mid-furnace, and splash zone. Don’t just watch the overall bed differential; look at the profile. Defluidization starting in the lower bed shows up as a collapse in the bottom-to-mid differential while the upper furnace readings hold relatively stable. Defluidization or agglomeration in the splash zone shows the opposite pattern. That distinction tells you whether you have a distributor problem or a fuel feed/agglomeration problem, and the corrective actions are completely different.
Emergency Response Sequence
When bed pressure collapses, the sequence matters. First, reduce load to around 60% MCR — this sounds counterintuitive, but it buys you thermal margin while you recover fluidization. Second, increase primary air flow to push superficial velocity back above 4 m/s. Third, check distributor nozzle performance before assuming the problem is bed inventory.
On nozzle inspection: each nozzle should show a pressure drop in the 1.5–3 kPa range under normal flow. A blocked nozzle reads near zero differential and creates a stagnant dead zone directly above it — exactly where agglomeration initiates. In practice, blocked nozzles are more common than people admit, especially on units burning high-ash fuels or running extended campaigns between outages. A simple cold-air walk-through test during a planned shutdown, probing each nozzle row systematically, takes a few hours and has saved more than a few units from repeat defluidization events.
A bed differential pressure below 4 kPa in a CFB boiler is a reliable indicator of incipient defluidization requiring immediate operator intervention.True
Stable CFB bed operation maintains 6–12 kPa across the bed inventory under normal load. A drop below 4 kPa indicates insufficient gas-solid suspension density, consistent with fluidization velocity falling below minimum fluidization conditions for typical CFB particle size distributions.
Long-Term Corrective Actions
Fuel sizing is where you get the most leverage. Crusher gap settings should be checked and adjusted at least monthly — gaps drift as wear plates erode, and a 2 mm gap increase can push your top-size fraction well past the 10 mm threshold without triggering any obvious alarm. Online particle size monitoring exists and works reasonably well, though the maintenance burden of optical or laser systems in a dusty CFB environment is real. Limestone quality also matters more than procurement teams usually appreciate; CaO content below 85% means you’re injecting inert material that adds to bed inventory without contributing to sulfur capture, which shifts your bed chemistry and can gradually change the sintering risk profile.
Bed Pressure Drop Decision Matrix
| Bed ΔP Reading | Pattern | Most Likely Cause | Immediate Action |
|---|---|---|---|
| 6–12 kPa | Stable | Normal operation | Continue monitoring |
| 4–6 kPa | Gradual decline | Bed inventory loss or partial blockage | Check fuel feed rate, inspect drain valves |
| Below 4 kPa | Rapid drop | Defluidization onset or distributor blockage | Reduce to 60% MCR, increase primary air, inspect nozzles |
| Below 2 kPa | Sudden collapse | Full defluidization or major nozzle array failure | Emergency shutdown procedure, forced cooling |
| Above 15 kPa | Rising trend | Excess bed inventory or coarse ash accumulation | Open bed drain, reduce limestone feed, check ash extraction |
The pressure readings alone don’t tell the whole story — always cross-check against bed temperature distribution and flue gas O₂ readings before committing to a corrective action. A defluidizing bed usually shows rising bed temperature variance alongside the pressure drop, which helps confirm the diagnosis.
Identifying and Correcting Combustion Instability and Temperature Excursions
Combustion control in a CFB boiler is less forgiving than it looks on a P&ID. You’re managing a dense, turbulent suspension of burning fuel, inert bed material, and recirculated ash — all at the same time. The temperature window of 850–950°C isn’t arbitrary; it’s the range where sulfur capture is effective, carbon burnout is complete, and bed material stays fluid rather than sticky. Drift outside it in either direction and you get a different failure chain, usually faster than operators expect.
What Happens Below 850°C and Above 950°C
Drop below 850°C and combustion efficiency falls off noticeably. CO breakthrough increases, unburned carbon in fly ash climbs — often past 5% loss on ignition (LOI) — and limestone calcination becomes incomplete, which means your SO₂ removal drops even if you’re feeding the right Ca/S ratio. In wet or high-moisture biomass co-firing scenarios, you can see bed temperatures slide to 800°C or lower during load swings if secondary air hasn’t been trimmed down. That’s a precursor to defluidization if there’s any low-melting-point ash in the fuel.
Above 950°C, the problems flip. Agglomeration risk rises sharply, especially with fuels that carry alkali metals — rice husks, some agricultural residues, municipal sludge blends. NOx formation accelerates. Limestone sorbent sinters and loses surface area, so your SO₂ capture actually gets worse at higher temperature even with more limestone. Refractory and tube surfaces near the upper furnace take increased radiant load. Cyclone inlet erosion rates, already something you watch carefully, get worse.
CFB boiler bed temperatures above 950°C accelerate bed agglomeration and reduce limestone SO₂ capture effectiveness despite higher thermal intensity.True
At temperatures above 950°C, alkali-containing ash phases can form low-melting eutectics that cause particle sintering. Simultaneously, calcined limestone (CaO) begins to sinter and lose reactive surface area, reducing its ability to capture SO₂ despite adequate Ca/S stoichiometry.
Building a Temperature Profile Map
A single bed thermocouple tells you almost nothing useful. To actually diagnose combustion instability, you need readings from at least three elevations — lower furnace (near the air distributor), mid-furnace, and cyclone inlet — plus, ideally, one or two across-width readings at the same elevation if the furnace cross-section is large. Hot spots in the upper furnace while the bed is cold usually mean secondary air distribution is uneven, or a fuel feed nozzle is partially blocked and concentrating volatile release in one zone.
In practice, a lot of plants underinvest in thermocouple redundancy and then wonder why they can’t diagnose oscillations. Replace burned-out thermocouples on a scheduled basis — not when the DCS shows a fault.
High Unburned Carbon in Fly Ash
If fly ash LOI is running above 5%, start with three suspects: fuel volatile content has changed (common when fuel supply shifts between grades or seasonal moisture varies), primary-to-secondary air split is off, or the cyclone return leg isn’t functioning correctly and coarse unburned particles are bypassing re-injection.
The primary/secondary air split deserves careful attention. Typical design intent is roughly 55–65% primary air through the distributor plate and 35–45% secondary air injected at the upper furnace ports. Primary air drives fluidization and initial char combustion; secondary air completes volatile burnout and gives you staged combustion for NOx control. Biasing too heavily toward primary air can cause excess oxygen in the lower bed and oxygen starvation above — the opposite of what staged combustion needs. Adjusting the split by 5–10 percentage points and monitoring CO at the furnace exit for 20–30 minutes per step is a reasonable field tuning approach, assuming the air flow instrumentation is calibrated.
If the cyclone seal pot or loop seal is leaking or the loop seal aeration air has been cut back, coarse char returns to the furnace at a lower rate. You’ll see LOI rise and bed temperature gradually drop as the heat inventory in the circulating material decreases.
Fuel Feed Calibration and Feeder Wear
Rotary valves and screw feeders both wear, and worn feeders are a surprisingly common source of temperature oscillation. A degraded rotor tip clearance in a rotary valve can cause feed rate to vary ±15–20% around setpoint, which the operators see as bed temperature hunting ±40–60°C on a 5–10 minute cycle. If your DCS trend shows that pattern, weigh the actual feed against the setpoint over a 30-minute period using a portable conveyor scale or a timed bin-weight check. If actual feed deviates more than 5–8% from setpoint consistently, the feeder needs inspection.
Screw feeder flights wear unevenly when fuel contains hard inclusions — stones, metal tramp, densified pellets that break asymmetrically. Seasonal cohesion changes in biomass fuel (higher moisture in wet seasons) can cause bridging above the feeder, which produces intermittent feed starvation that looks exactly like a controls problem until someone physically checks the hopper.
Start-Up, Shutdown, and Thermal Ramp Rates
Refractory damage during start-up is underappreciated until you’re looking at spalled castable in the upper furnace after six months of operation. The general guidance is to keep cold-start temperature ramp rates at or below 100°C/hour through the first 500°C, where free and chemically bound moisture is being driven from the refractory. Above 500°C you have more flexibility, but sudden load increases during the first hour of full combustion — particularly if the bed hasn’t reached thermal equilibrium — can cause localized temperature excursions that crack linings at construction joints.
Shutdown ramp-down matters too, especially for forced outages. Dumping fluidizing air and allowing natural convection cooling is faster than a controlled ramp but stresses the furnace corners disproportionately. If the outage is planned, a controlled cool-down at 50–80°C/hour is worth the extra time.
Combustion Instability Troubleshooting Reference
| Symptom | Probable Cause | Instrument Check | Corrective Action |
|---|---|---|---|
| Bed temp oscillating ±50°C, ~5–10 min cycle | Worn or mis-calibrated fuel feeder | Weigh actual vs. setpoint feed rate | Inspect feeder rotor/flights; recalibrate |
| Bed temp chronically low (5% | Poor air staging or cyclone return fault | Check secondary air split; inspect loop seal | Adjust PA/SA ratio; restore loop seal aeration |
| Upper furnace hot spot, bed normal | Secondary air nozzle blocked or uneven | Check SA port differential pressures | Rod out blocked nozzles; balance SA distribution |
| Bed temp rising above 970°C | Fuel calorific value spike or reduced heat transfer | Check fuel quality; verify water wall flow | Reduce fuel feed rate; increase feedwater flow |
| CO spike at furnace exit | Staged combustion breakdown | Check SA flow and furnace O₂ profile | Redistribute SA; check for air duct leaks |
Combustion instability in a CFB rarely has a single root cause. Usually it’s two or three factors compounding — a feeder that’s slightly worn, a fuel that’s running higher in volatiles than spec, and a secondary air damper that someone adjusted during a previous shift and didn’t log. Systematic logging of fuel quality and feeder performance alongside DCS trends is how you separate the causes rather than chasing the symptom.
Troubleshooting Cyclone Separator Performance and Solid Return Circuit Failures
The cyclone separator and its downstream return circuit are, in my experience, the most underappreciated subsystem in a CFB boiler — until something goes wrong. Most operators focus troubleshooting effort on the furnace itself, but a degraded cyclone or a dead loop seal can destabilize the entire unit faster than almost any combustion-side fault.
Why the Solid Return Circuit Is the Heartbeat of CFB Operation
CFB combustion depends on continuous mass recirculation. A typical unit recirculates roughly 50–100 kg of bed solids per kilogram of fuel burned, depending on fuel type, particle size distribution, and the designed solid suspension density. That recirculating inventory carries heat back into the lower furnace and maintains the reactive surface area needed for sulfur capture and staged combustion. If the cyclone stops returning solids — for any reason — bed inventory in the furnace collapses within 5 to 15 minutes. The bed pressure drops, gas velocity distribution shifts, and you are essentially running a dilute-phase combustor with none of the design margins. Recovery from a full defluidization event caused by return circuit failure is slower and messier than one caused by air distributor blockage, because you have also lost the thermal buffer.
Recognizing Cyclone Performance Degradation Before It Becomes a Crisis
The earliest signal is usually a rise in gas temperature at the cyclone outlet — more than roughly 50°C above design baseline under equivalent load. That temperature rise tells you solids that should have been separated and returned are instead carrying heat out with the gas stream. Simultaneously, fly ash loading at the economizer or baghouse increases, and you will often see a shift toward finer particle size in fly ash samples, which indicates that coarser particles that the cyclone should have caught are now escaping.
Cyclone collection efficiency should exceed 99% for particles larger than 100 µm in a well-maintained CFB boiler.True
This is the design target for modern high-efficiency cyclone separators in CFB applications; a drop below 95% collection efficiency typically indicates refractory or seal failure and results in measurable increases in fly ash loading and unburned carbon loss.
Bed pressure decline follows, usually lagging the temperature signal by 10–20 minutes. If you are watching all three trends — cyclone outlet temperature, fly ash loading, and furnace bed pressure — simultaneously, you can catch a developing separator problem before it forces a load reduction.
Internal Wear: Where to Look and What to Measure
Cyclone internals erode. That is not a design flaw; it is the physics of high-velocity particle-laden gas. The critical measurement locations are the inlet duct (especially the outer wall at the turn), the barrel, and the barrel-cone junction. The barrel-cone junction is consistently where wear concentrates because particle trajectory and velocity vector change sharply there.
During planned outages, measure wall thickness at these three locations using ultrasonic thickness gauges — not just a visual inspection. Refractory lining thickness matters as much as steel shell integrity. Any location showing more than 3 mm of steel wall reduction, or equivalent refractory loss that exposes the anchor system, should be evaluated for patch repair or a replacement wear insert before the next campaign. Ignoring a 3–4 mm thinned section and running another 6,000-hour campaign is the kind of decision that ends with an unplanned emergency outage in the middle of winter.
Loop Seal Troubleshooting: The Non-Mechanical Valve That Operators Forget
The loop seal — sometimes called a J-valve or L-valve depending on geometry — is a non-mechanical seal that prevents furnace gas from blowing back through the return leg while allowing solid flow downward and back into the furnace. It operates on fluidized aeration air injected at the bottom of the seal pot.
The correct aeration rate depends on seal width, but the working range is roughly 15–25 Nm³/h per meter of seal width. Too low, and the solid plug consolidates or bridging occurs, stopping flow completely. Too high, and you inadvertently fluidize the entire seal and allow gas bypass. Both conditions feel similar from the control room — a drop in standpipe pressure and declining solid return — but the remedies are opposite. That is why the inspection port matters. A clear inspection port at the seal pot sidewall, lit with a portable work light during operation, lets a technician visually confirm whether material is moving. Plants that weld their inspection ports shut or let them fill with refractory are making a maintenance mistake they will regret.
Refractory Spalling and Cyclone Bypass: A Failure Mode That Hides in the Data
When refractory inside the cyclone barrel or cone spalls in significant chunks, the exposed steel erodes rapidly and — more critically — the spalled material can partially block the dipleg or damage the loop seal internals. But the subtler problem is bypass. A spall event that opens even a small gap between the cyclone inlet duct and the barrel creates a short-circuit path: gas and solids skip the centrifugal separation entirely and go straight to the exit.
Symptoms are a sudden CO spike (partially burned material bypassing recirculation), a coarse particle fraction appearing in fly ash samples that does not belong there, and sometimes a detectable acoustic signature change at the cyclone casing — though acoustic emission monitoring is still not standard on most plants below 200 MW. If you see CO rising with no combustion-side explanation and the cyclone outlet temperature is also climbing, pull a fly ash sample and check the particle size distribution. Coarse particles in the fly ash that match your bed material granulometry are a near-certain sign of cyclone bypass.
External Heat Exchanger and Loop Seal Heat Exchanger Maintenance
Not all CFB designs include an external heat exchanger (EHE), but when present — typically on units above 150–200 t/h steam output where heat balance control demands more flexibility — the tube bundle inside the EHE is exposed to the same abrasive solid flow as the furnace waterwall tubes, often at higher solid concentrations.
Tube bundle wear in an EHE tends to be non-uniform: tubes at the periphery of the bundle and those facing the solid inlet port erode faster. Inspection during outages should include ultrasonic thickness measurements at a minimum of 8–12 points per tube row in the high-velocity zones. Fouling on the external surface of tubes (internal to the EHE shell) is less common than in convective pass heat exchangers, but if solid circulation has been interrupted and the material cools partially in the EHE, re-sintering can partially cement solids around tube rows. Cleaning in that situation requires mechanical lancing; water washing is usually inappropriate until the unit is fully cooled and vented.
Outage Inspection Checklist: Cyclone and Return Circuit
| Item | Method | Accept / Act Threshold |
|---|---|---|
| Cyclone inlet duct wall thickness | UT gauge, outer wall at inlet turn | Act if 3 mm loss |
| Refractory lining integrity | Visual + tap test (hollow sound = debond) | Act if any area >0.1 m² shows debonding |
| Dipleg internal blockage | Visual with inspection camera | Act if any bridging or partial plug observed |
| Loop seal aeration nozzles | Visual, airflow measurement per nozzle | Act if any nozzle deviation >25% from mean |
| Standpipe flanged joints | Visual for solid leakage, thermal discoloration | Act on any active leak or hot spot |
| EHE tube bundle (if present) | UT gauge on high-wear zones | Act if wall loss >20% of nominal in any zone |
Outage frequency for this inspection depends on fuel abrasiveness and operating hours, but a 12,000–18,000 hour interval is a reasonable baseline for most coal-fired CFB units. High-ash fuels with angular particle morphology — some Indian coals and petroleum coke blends, for instance — can push the cyclone wear rate hard enough to justify 8,000-hour checks. Build the habit of comparing thickness readings outage-to-outage. A single measurement tells you current state; the trend tells you when you are actually running out of margin.
Managing Erosion and Tube Wear in the Furnace, Convection Pass, and Backpass
Erosion is the failure mode that quietly kills CFB boilers on a multi-year timescale. It rarely causes the dramatic emergency shutdowns that defluidization does, so it tends to get underweighted in maintenance planning — until a tube ruptures mid-campaign and you’re looking at an unplanned outage that runs two to four weeks and costs more than several scheduled inspections combined would have.
The Four Zones That Actually Fail First
Not all surfaces erode equally. In practice, four locations account for the majority of critical wall-thinning events:
Lower furnace membrane walls near fuel and recycle ash feed ports. The incoming solid stream — whether it’s raw fuel or hot return ash from the loop seal — carries high-momentum particles that hit the membrane wall at close range. The refractory lining in this zone almost always shows accelerated wear within the first 8,000–12,000 hours, depending on fuel particle size distribution and how aggressively the plant runs recirculation.
The furnace nose or arch. Flow acceleration at the nose creates high local particle velocity and turbulence. This geometry forces the flue gas and entrained solids to change direction sharply, and that change in direction is energy deposited into tube metal.
Cyclone inlet duct. Particle concentration here is the highest in the entire gas path — easily an order of magnitude above the upper furnace. Even a small drop in refractory or ceramic tile integrity in this duct translates to rapid metal loss on the duct shell and any structural tubes nearby.
First two or three rows of superheater or economizer tube bundles. These see the particle-laden gas stream before it has meaningfully decelerated. The first-row leading-edge erosion in an economizer bank can be three to five times worse than the trailing rows, which is worth keeping in mind when you’re deciding how often to do thickness surveys.
Why the Physics Matters for Diagnosis
Erosion rate isn’t linear with particle velocity — it scales roughly with velocity to the power of 2.5–3.5 depending on the material pair, which means a 20% increase in local gas velocity can more than double the metal loss rate. Impact angle matters too: 45° impact drives maximum metal removal from ductile steel (the cutting-wear mechanism dominates), while near-normal impact causes more deformation wear. In CFB service, the cyclone inlet and furnace nose tend to produce 30°–50° impact angles, which puts them squarely in the worst zone.
Particle concentration and hardness compound the effect. Switching from bituminous coal to a high-ash sub-bituminous fuel, or co-firing with MSW that contains silica-rich materials, can shift erosion rates significantly — sometimes doubling them — even at the same fluidization velocity.
Running a CFB boiler below minimum fluidization velocity (typically below 3 m/s superficial air velocity) accelerates tube erosion by promoting uneven particle distribution and local high-velocity slugging near the air distributor.True
Below minimum fluidization velocity, bed solids begin to slump unevenly, creating preferential gas channels (slugging). These high-velocity channels carry concentrated particle loads that impact nearby membrane wall tubes at erosive velocities, increasing local wear rates substantially compared to stable, uniformly fluidized conditions.
Off-design operation amplifies everything. High recirculation ratios — sometimes pushed by operators trying to maintain bed temperature on lower-heat-content fuel — increase particle loading in the upper furnace and cyclone circuit. Coarse fuel particles (say, a coal with D90 above 8–10 mm due to a crusher fault) sink toward the lower furnace and abrade the lower membrane wall more aggressively than a properly sized feed would. Seasonal effects show up too: if your plant runs damp biomass in winter, operators sometimes over-air to compensate for moisture, which raises flue gas velocity across the convection banks.
Ultrasonic Thickness Measurement Protocol
During any planned outage longer than about five days, tube wall thickness surveys should cover all four erosion zones at minimum. The standard approach is a grid pattern at roughly 150 mm intervals along suspected wear zones — closer spacing (75–100 mm) on the cyclone inlet duct and furnace nose where wear is localized and the gradient can be steep.
For carbon steel economizer tubes, ASME Section I sets minimum allowable wall thickness based on design pressure and temperature; in practice, most operators use a 75–80% of nominal wall thickness as the intervention threshold before the calculated MAWP starts to shrink meaningfully. Remaining life is estimated from the measured wear rate (mm per 1,000 hours) extrapolated against the retirement thickness, giving you a forward-looking window for the next planned replacement. If you’re seeing thinning rates above roughly 0.5 mm per 1,000 hours, that’s a signal to stop watching and start repairing.
Document every survey with the same grid coordinates so successive outages give you a true rate-of-change rather than an isolated snapshot. It sounds obvious, but a surprising number of plants keep the data in someone’s personal spreadsheet rather than a maintained equipment history, and when that person leaves, so does the trend data.
Protection Strategies That Actually Hold Up
Refractory castable shields on the lower membrane wall are the standard first line of defense. Silicon carbide castable or high-alumina refractory (70%+ Al₂O₃) bonded directly to the membrane performs well in the lower furnace, though anchoring system design matters — poorly anchored refractory tends to spall around 15,000–25,000 hours, sometimes earlier if there are thermal cycling events. Studded tubes in high-erosion zones provide mechanical anchor points and act as sacrificial material, delaying base metal contact.
For the cyclone inlet duct, ceramic tile lining (typically SiC or alumina tiles, 20–30 mm thick, set in high-temperature mortar) is the accepted industry approach. It works well when installed correctly, but tile joints are vulnerable — loose or cracked grout allows gas and particles to undermine the tile, and you end up with large sections detaching. Inspect tile integrity early in each outage rather than assuming it’s intact.
In the convection pass, tube spacing is sometimes adjustable during design or major refurbishment. Wider pitch reduces particle impaction frequency on downstream tubes and allows easier cleaning, but it’s a tradeoff against heat transfer surface area and overall boiler footprint.
Repair and Material Upgrades
When you’re past the point where coatings or refractory are adequate, cold-spray metallic coatings (thermal spray with WC-Co or similar carbide-based materials) can restore near-original wall thickness on accessible tube sections between outages. For weld overlay, Inconel 625 or Stellite 6 overlays on superheater tubes in severe erosion zones extend service life meaningfully — typically adding 20,000–40,000 hours depending on conditions — though the welding procedure qualification and preheat requirements for dissimilar metal joints deserve careful attention.
Full tube section replacement is the right call when wall loss is widespread or when weld overlay would create unacceptable residual stress concentration. For high-temperature superheater zones, specifying TP347H austenitic stainless steel or T91 (9Cr-1Mo-V) over plain carbon steel is worth the cost premium on replacement — the creep and erosion resistance difference is substantial at metal temperatures above 500°C.
Erosion Risk Prioritization by Location and Fuel Type
| Zone | Coal (bituminous) | High-ash sub-bituminous / lignite | Biomass (agricultural residue) | MSW / RDF |
|---|---|---|---|---|
| Lower furnace membrane wall | Medium | High | Medium-High | High |
| Furnace nose/arch | Medium | Medium-High | Medium | High |
| Cyclone inlet duct | High | High | Medium | High |
| First superheater/economizer rows | Medium | High | Low-Medium | Medium-High |
MSW and RDF rank high across nearly every zone because of variable particle hardness and silica content. Biomass from agricultural residues (rice husk, bagasse) tends to produce softer ash particles with lower erosion potential than coal, though alkali chloride chemistry introduces a different corrosion-erosion interaction that deserves its own attention in the superheater zone.
Resolving Slagging, Fouling, and Ash Buildup in Heat Transfer Surfaces
Slagging and fouling get lumped together constantly, even by experienced operators, but they are distinct failure modes with different chemistry, different locations, and different remediation paths. Treating them the same wastes outage time and often makes one problem worse while fixing the other.
Slagging vs. Fouling — Not the Same Problem
Slagging is what happens when ash partially melts or sinters and bonds to radiant surfaces — furnace walls, the lower superheater pendant tubes, areas around the cyclone inlet. It requires ash to reach or approach its initial deformation temperature (IDT). Fouling, by contrast, is the progressive bonding of condensed alkali sulfates and chlorides onto convective surfaces — superheater tube banks, reheater sections, economizer tubes — at temperatures well below any melting point. Fouling deposits can look powdery or chalky at first, then harden into a ceramic-like crust if left alone for weeks. Slagging is acute and sometimes dramatic; fouling is slow and quiet and often ignored until steam temperature starts drifting.
Fuel ash chemistry is the root driver for both. Any fuel with K₂O + Na₂O content above roughly 3% (dry basis) — which includes most agricultural straws, palm residues, and many municipal solid waste streams — carries real fouling risk. High chlorine above about 0.3% dry basis accelerates alkali chloride condensation on tube surfaces, and those chloride deposits are corrosive, not just insulating. Low ash fusion temperature, anything below around 1,150°C IDT, pushes slagging risk up sharply. Before commissioning on a new fuel blend, get a full proximate/ultimate analysis plus ash fusion temperatures. That single step prevents more unplanned outages than almost anything else.
Online Detection Before It Gets Expensive
The clearest early signal for convective fouling is a rising flue gas outlet temperature at constant load. If your economizer exit gas temperature climbs 15–25°C over two to three weeks with no change in fuel or firing rate, fouling is accumulating faster than your soot blowers are clearing it. Steam temperature deviation — particularly a drop in final superheater outlet temperature with increasing attemperator spray demand — confirms thermal resistance is building in the tube banks.
Soot blower effectiveness trending is underused. Log the delta on flue gas temperature immediately before and after each blower cycle. When that delta shrinks below 3–4°C per cycle, your blowers are no longer doing useful work, either because steam pressure at the nozzle has dropped below roughly 15 bar, nozzle tips are worn and the jet has gone soft, or the blowing sequence is wrong and you’re hitting already-clean surfaces while caked zones go untouched. Check nozzle condition during every minor outage — a worn tip costs almost nothing to replace; an unplanned shutdown costs weeks.
Incorrect blowing sequence also causes thermal fatigue cracking at tube attachments. Rapid local cooling from a high-pressure steam jet onto a tube that was already running hot is a real mechanism, not a theoretical one.
Deposit Analysis During Outages
When you do get an outage, scrape deposit samples from multiple locations — front rows of the superheater, side walls, economizer leading edges — and run XRF analysis. Sulfate-dominated deposits respond well to water washing and adjusted Ca/S ratio management. Chloride-rich deposits signal you need to look at fuel blending or bed temperature adjustments, because soot blowing alone won’t stop recurrence. Silicate-bonded deposits are the hardest to remove and often indicate bed material carryover mixing with ash, which points back to cyclone wear.
Hydroblasting at 700–1,400 bar effectively removes hardened silicate and sulfate deposits from convective tube banks during planned outagesTrue
High-pressure hydroblasting in this range is standard industrial practice for heat exchanger and boiler tube cleaning; pressure selection depends on deposit hardness, tube wall thickness, and access geometry. Confirmed by industrial cleaning contractors and boiler OEM maintenance manuals.
For chemical cleaning, hydroblasting between 700 and 1,400 bar is standard — lower end for economizer tubes with thinner walls, higher end for reheater banks with thick-walled headers. For MSW or biomass plants, wash water must be collected and treated; chloride-laden runoff from those plants is a hazardous waste in most jurisdictions. Don’t skip the waste water containment setup to save half a day.
Long-Term Mitigation Through Fuel Management
Co-firing high-ash coal with problematic biomass at ratios of roughly 70/30 to 80/20 (coal/biomass by heat input) dilutes alkali loading enough to meaningfully reduce fouling rates in most cases — though the exact ratio depends on the individual fuel analyses, not a fixed rule. Keeping bed temperature in the 850–920°C range stays comfortably above the acid dew point while providing margin below typical IDTs for mixed-fuel ash. If you’re running biomass with high K and Cl and you’ve let bed temperature creep up toward 950°C to chase combustion efficiency, you’re trading fouling rate for that extra half-percent efficiency. Usually not worth it.
Diagnosing Emission Non-Compliance: SO2, NOx, CO, and Particulate Exceedances
Most operators treat CEMS as a compliance recorder — they glance at the hourly average, note whether it crossed the permit limit, and file the report. That’s the wrong way to use it. The rate of change is what tells you something is going wrong before it becomes a violation. A SO2 reading climbing 15–20 mg/Nm³ per hour under steady load is a more useful signal than an absolute value sitting just below the limit. Build trend alarming into your CEMS historian, not just setpoint alarms.
SO2 Exceedance: Start with the Limestone, Not the Boiler
When SO2 climbs, the instinct is often to increase limestone feed rate immediately. Sometimes that’s right, but if CaO active content has dropped — which happens with certain limestone batches, particularly during wet seasons when storage silos aren’t sealed properly — adding more of the same material just wastes reagent without improving capture. Check purity first.
Target Ca/S molar ratio sits at 2.0–2.5 under steady-state conditions; actual SO2 removal efficiency with in-furnace injection should be 85–95% depending on fuel sulfur content and bed uniformity. If you’re running Ca/S at 2.4 and still seeing exceedances, the next variable is limestone particle size. Material ground coarser than 0.3 mm doesn’t calcine fast enough in the lower furnace; finer than 0.1 mm gets elutriated through the cyclone before it has time to react. A quick sieve check on the day’s feed material costs ten minutes and saves hours of chasing other causes.
Bed temperature matters too. Calcination and sulfur capture both peak in the 850–900°C window. Above 950°C, CaSO₄ starts to decompose. If bed temperature has crept up for other reasons — coarser fuel, reduced recycled ash, a weekend load swing nobody logged — SO2 can jump even with adequate limestone supply.
NOx: Usually an Air Staging or Temperature Problem
CFB boilers typically produce 50–200 mg/Nm³ NOx without SCR, which is already well below pulverized coal. When that rises, check bed temperature first. Thermal NOx generation increases sharply above 950°C, so a bed temperature creep caused by load increase or fuel quality change is a common culprit. If SNCR urea injection is installed, verify actual dosing rate against the setpoint — flow meter calibration drift is common on urea lines, and it’s often discovered only when NOx trends upward for no obvious reason. Also evaluate whether air staging is still effective: secondary air damper positions should be confirmed physically, not assumed from DCS readback, since damper actuators fail more often than people expect.
CO Spikes: Read the O2 Profile First
A CO spike almost always means incomplete combustion somewhere in the furnace cross-section. Before assuming fuel feed interruption, pull the furnace O2 profile data. A localized high-O2 zone alongside elevated CO in another quadrant points to air distributor partial blockage — that’s a different corrective action than a fuel feeder trip, which shows globally low O2 with high CO simultaneously. Load transients can also cause brief CO spikes as the air-fuel ratio adjusts; if the spike resolves within 3–5 minutes after load stabilizes, it’s probably transient rather than a hardware fault.
Particulate Matter: Separate the Filter from the Cyclone
Don’t assume a PM exceedance means the bag filter or ESP has failed. If cyclone collection efficiency has degraded — seal wear, bypass leakage, damaged vortex finder — the downstream filter sees inlet loading several times its design basis and can’t compensate. Check bag filter differential pressure trend: a sudden drop in ΔP during a PM exceedance often means broken bags, not overloading. A gradual rise means the bags are blinding, possibly from moisture ingress or a change in ash particle size distribution. ESP rapping cycle frequency deserves a look too; rapping intervals that are too long allow heavy cake buildup and re-entrainment during rapping.
Dioxin and HCl in MSW and Biomass CFB Applications
For waste-to-energy and biomass CFB units, dioxin compliance adds another layer. The minimum requirement — 850°C for at least 2 seconds of gas residence time in the post-combustion zone — must be verified against actual temperature profiles, not nameplate design. Activated carbon injection rate and mixing effectiveness upstream of the bag filter are critical; if the injection lance is partially blocked or the pneumatic conveying pressure has dropped, activated carbon contact time with flue gas falls off sharply. HCl scrubber or activated coke bed scrubber performance should be logged against lime consumption rates; if HCl absorption efficiency drops below target, it typically precedes dioxin non-compliance events.
| CEMS Alarm | First Check | Second Check | Corrective Action |
|---|---|---|---|
| SO2 rising | Limestone feed rate and CaO purity | Ca/S ratio, particle size, bed temperature | Adjust feed rate, verify grind spec, correct bed temp |
| NOx rising | Bed temperature vs. setpoint | SNCR dosing rate, air staging dampers | Trim bed temperature, verify actuators, recalibrate urea flow |
| CO spike | Furnace O2 profile distribution | Fuel feeder status, load transient timing | Clear distributor blockage or restore feeder; if transient, monitor |
| PM exceedance | Bag filter ΔP trend, broken bag alarm | Cyclone seal and vortex finder condition | Replace bags or repair cyclone seals; adjust rapping cycles |
| Dioxin/HCl (MSW) | Residence time at 850°C, activated carbon injection rate | Scrubber lime consumption, injection lance pressure | Restore carbon injection, verify post-combustion temperature |
CFB boilers using in-furnace limestone injection at Ca/S ratio 2.0–2.5 can achieve SO2 removal efficiency of 85–95% without a downstream wet scrubber under stable operating conditions.True
This is consistent with published CFB combustion data and reflects performance at bed temperatures of 850–950°C with properly sized limestone (0.1–0.3 mm). Actual efficiency varies with fuel sulfur content, limestone reactivity, and bed uniformity.
A 15-minute response window is realistic if the operator knows which instrument to check first. The table above is designed for exactly that — alarm type to root cause to action without wading through a troubleshooting manual at 2 a.m.
Refractory and Pressure Part Failure: Inspection, Life Assessment, and Repair Planning
Refractory in a CFB boiler is doing two jobs simultaneously, and most operators only think about one of them. Yes, it’s thermal insulation — but in the lower furnace, the transition zone above the air distributor, and especially inside the cyclone barrel and cone, it’s the primary erosion shield between the particle-laden gas stream and the carbon steel casing. Strip that protection away and you’re looking at casing burn-through in a matter of weeks, not years.
Why Refractory Fails in CFB Service
Thermal cycling is the dominant killer. Every cold start subjects the lining to a temperature ramp that, if rushed, drives differential expansion between the castable matrix and its anchors. Most refractory manufacturers specify a dry-out and heat-up curve: something like 20–30°C/hour up to 200–250°C to drive off free moisture, then a dwell, then a controlled ramp to operating temperature. In practice, under pressure to return a unit to service, operators skip or compress the intermediate holds. The result is spalling — sometimes visible as surface crazing, sometimes as full depth delamination that doesn’t announce itself until the first full-load run.
Chemical attack is a different mechanism and catches people off guard when the fuel shifts. High-alkali fuels — rice husk, palm kernel shell, certain agricultural residues — introduce K₂O and Na₂O into the bed. At bed temperatures of 850–950°C, alkali compounds react with aluminosilicate refractories to form low-melting-point phases that progressively weaken the binder matrix. Standard high-alumina castable that performs fine with coal will start showing surface erosion acceleration within a single season of biomass firing if the alkali loading is high enough.
Inspection Protocol During Outage
A systematic outage inspection starts with visual mapping — literally walking the furnace with a camera and marking every crack, spall, and exposed anchor on a zone diagram. Cracks wider than roughly 3–4 mm or deeper than half the castable thickness are candidates for full-depth repair rather than surface patching. Tap testing with a hammer along the wall face identifies delamination by the hollow sound; it’s low-tech but reliable, and anyone who’s spent time in a furnace knows exactly what that sound difference feels like.
Infrared thermography of the external casing during operation is underused for refractory condition monitoring. A functioning refractory lining in the lower furnace should hold the casing surface below 80–100°C under normal ambient conditions. Hot spots above 150°C on the outside usually mean a lining void or significant thickness loss. This can be trended between outages, giving you early warning rather than a surprise.
Pressure Part Inspection Priorities
Weld seam integrity on steam drums and headers is inspected by UT or radiography per ASME Section I, EN 12952, or GB/T 16507 — which standard applies depends on the jurisdiction where the boiler is operating, something that matters for export projects where regulatory alignment is explicit in the contract. Superheater headers operating above roughly 480°C need creep measurement; oxide scale thickness in tube bores correlates with cumulative metal temperature and gives a reasonable life estimate without tube removal.
Fatigue cracking at tube-to-header stub welds is a slow failure mode that becomes relevant after 80,000–100,000 operating hours or on units with high start-stop frequency. Magnetic particle testing during outage catches surface-breaking cracks; phased array UT picks up subsurface defects in the heat-affected zone.
Repair Material Selection
For the lower furnace where abrasion is severe, high-alumina castable with Al₂O₃ content above 75% is the standard choice. The cyclone cone and outlet duct — where particle velocities and impingement angles are worst — warrant silicon carbide castable; the hardness advantage over alumina is meaningful at those impact conditions. Anchoring matters as much as the material itself. V-anchors are appropriate for thicker castable sections in the lower furnace; hexmesh is better suited for thinner linings in the upper furnace and ductwork where thermal mass needs to stay low.
Anchor material must match the castable chemistry — using carbon steel anchors with silicon carbide castable causes galvanic-type degradation at elevated temperature and premature anchor failure.True
Silicon carbide castable operates in an environment that can be mildly oxidizing or reducing depending on combustion zone; dissimilar metal anchors create differential thermal expansion and potential corrosion at the interface. Stainless steel or alloy anchors are standard practice for SiC zones.
Life Extension and RBI
Finite element analysis for pressure part remaining life is now accessible enough that it’s worth commissioning for any header or drum showing measurable creep or a repair history of weld buildup. The output — a calculated remaining creep life at current operating conditions — directly informs the next inspection interval. Combine that with a risk-based inspection framework and you can justify stretching planned outages from the typical 18-month cycle to 24–30 months on well-maintained units, with documented engineering basis rather than just optimism.
The real cost argument for proactive refractory and pressure part management isn’t complicated: a forced outage from casing burn-through or a header crack runs four to eight times the cost of a planned repair of the same scope, once you account for emergency mobilization, expedited material costs, and lost generation or process heat revenue.
Instrumentation Failures and Control System Misdiagnosis in CFB Operations
CFB boilers are genuinely harder on instruments than almost any other combustion system. You have high particulate loading that blocks taps, abrasive fly ash that grinds sensor faces, rapid thermal cycling that accelerates thermocouple drift, and vibration from the fluidized bed itself that loosens impulse line fittings over time. The result is a troubleshooting environment where the instrument reading and the actual process condition diverge more often than operators expect — and where applying a “fix” based on a bad reading can make things significantly worse.
Why Pressure Tap Blockage Gets Misread as a Real Process Event
Differential pressure transmitters measuring bed pressure drop are among the most maintenance-intensive items on a CFB. Normal bed DP should sit in the 6–12 kPa range; deviations beyond roughly 20% in either direction are meaningful. But a plugged impulse line produces an identical-looking signal to genuine ash accumulation at the air distributor. Operators who don’t question the instrument first often respond by increasing primary air velocity — the wrong move if the bed is actually fine.
Monthly purge line flushing is a minimum, not a luxury. In high-dust environments or when burning fuels with elevated ash content, bi-weekly flushing is more realistic. Impulse lines should slope continuously back toward the process connection with no low-point pockets where ash slurry or condensate can collect; even a 5° sag in a horizontal run is enough to cause chronic partial blockage. A practical cross-check: compare the DP transmitter reading against the primary air fan current draw and the measured fluidization velocity estimate from fan curve data. If the fan is drawing normal current and calculated velocity is within the 4–8 m/s stable range, a suddenly high DP reading almost certainly points to the instrument, not the bed.
Thermocouple Drift and the Type K vs. Type N Choice
Bed temperature thermocouples in a CFB operate in a brutal environment — temperatures cycling between 850°C and 950°C, abrasive bed material impacting the thermowell, and sulfurous atmosphere accelerating sheath oxidation. Type K thermocouples are common because they’re cheap and widely stocked, but they exhibit measurable drift after a few thousand hours at these temperatures, sometimes reading 20–40°C low without any obvious failure indication. Type N elements are more stable in this range and worth the modest cost premium for bed and cyclone temperature duty.
Six-month calibration cycles for bed and cyclone temperature elements are the working standard for most well-run plants. In practice, many sites stretch this to annual, then wonder why their combustion tuning is off. Drift compensation through DCS offset correction is acceptable as a short-term measure between calibrations, but it masks the underlying degradation and should be logged formally, not just keyed in quietly by a shift operator.
Flow Measurement and the Fan Curve Cross-Check
Primary and secondary air flow measurements deserve equal skepticism. Orifice plates in air ducting accumulate dust deposits on the upstream face, progressively under-reading flow. Pitot tubes in flue gas streams block even faster — in high-load operation with a fuel switch to higher-ash coal, a Pitot can be partially plugged within days. When a flow reading looks inconsistent with combustion behavior (good temperature, normal CO, but apparent low-air alarm), pull the fan performance curve and calculate expected flow from the measured static pressure and fan speed. This takes ten minutes and is far more reliable than assuming the meter is correct.
DCS Logic Faults and Nuisance Trips
Single-sensor interlock trips are a significant operational risk in older CFB control systems. If one bed temperature element fails high and the interlock logic is wired to trip on a single-tag exceedance, you get a forced shutdown from a failed thermocouple, not a real overtemperature. Two-out-of-three (2oo3) voting logic for critical parameters — bed temperature, furnace pressure, drum level — is the correct architecture and should be a baseline requirement for any controls upgrade or new commissioning.
2oo3 voting logic on critical CFB interlock parameters materially reduces nuisance trips caused by single-sensor failuresTrue
2oo3 logic requires at least two of three redundant sensors to agree before triggering a trip, preventing a single failed sensor from causing an unnecessary forced outage while still protecting against genuine process exceedances.
Bad actor tags — sensors that generate repeated spurious alarms — tend to get acknowledged and silenced by operators rather than repaired, especially on night shifts. This is how a real process upset gets missed: the alarm has been nuisance-silenced so many times that no one responds when it’s genuine. Tracking alarm frequency by tag in the DCS historian and flagging any element generating more than, say, 10 alarms per shift for immediate investigation is a simple governance practice that most plants don’t do consistently.
Control Loop Tuning Issues Specific to CFB
The bed temperature PID loop has a long dead time — typically 3–8 minutes depending on fuel feed path length and bed inventory — which makes aggressive proportional tuning cause oscillation rather than stability. Internal model control (IMC) tuning or model-predictive control is a better fit than standard PID for this loop. The interaction between the fuel feed rate loop and the primary air flow loop is also non-trivial; a step increase in fuel feed should ideally be accompanied by a coordinated air flow increase, but in many installations these loops are tuned independently and fight each other during load changes.
Sensor Validation Checklist
A quick field protocol for distinguishing instrument failure from genuine process upset: first, check if adjacent instruments with physical proximity to the same process point are showing consistent readings. Second, look at the historian trend — a sudden step change is more likely an instrument failure; a gradual drift is more likely a real process shift. Third, apply the fan curve or heat balance cross-check as an independent reference. Fourth, physically inspect the impulse line or thermowell if the first three steps don’t resolve the ambiguity. Only after ruling out instrumentation should you adjust the process.
Skipping that sequence — jumping straight to combustion or fuel adjustments because the DCS is alarming — is one of the more expensive habits in CFB operations.
Preventive Maintenance Scheduling and Outage Planning for CFB Boilers
Every forced outage on a CFB boiler is, in hindsight, usually traceable to something that was either visible weeks earlier or simply never checked. A structured PM program is not about paperwork — it’s about converting the diagnostic knowledge from erosion patterns, defluidization events, and cyclone wear into a rhythm of intervention that happens before the failure, not during it.
Daily Operator Rounds: The Data Foundation
The daily log is only useful if operators record the right parameters consistently. At minimum, each shift should capture bed pressure drop (normal range 6–12 kPa — any reading drifting outside that band warrants a note, not just an acknowledgment), cyclone inlet temperature, individual air zone flow and pressure readings, ash extraction rates by zone, and CEMS rolling averages for SO₂, NOx, and CO. Soot blower cycle completion status matters more than most operators realize; a blower that’s “running” but not completing its travel due to a sticky lance will show up as progressive fouling two weeks later.
In practice, the value of daily logs is cumulative. A single bad reading means little. Thirty days of readings showing bed pressure creeping up 0.3 kPa per week points directly to distributor plate fouling or ash packing — and gives you a repair window instead of an emergency.
Monthly Focused Inspections: Catch It Before It Cascades
Monthly scope should be targeted, not exhaustive. Pull and physically inspect roughly 5% of air distributor nozzles per zone — rotating which 5% each month so the full population gets assessed over roughly 20 months. A nozzle that’s partially plugged or eroded at the tip will skew fluidization locally, and you won’t see it clearly in aggregate pressure readings until a significant fraction of the zone is compromised.
Loop seal aeration nozzles deserve a dedicated check: flow test each leg, look for asymmetric returns, and inspect the refractory around the aeration box for hairline cracking that worsens with thermal cycling. Fuel feeder calibration — especially on screw or rotary feeders handling high-moisture biomass or mixed coal — drifts seasonally. A feeder that was accurate in July can be 8–12% off by January if the fuel bulk density has shifted and nobody recalibrated. Instrument purge lines on bed thermocouples and pressure taps are the most neglected item on most plants I’ve seen; a blocked purge line gives you clean-looking data that is simply wrong.
Annual Major Outage: Full Internal Assessment
The annual outage is where the cumulative stress of a full operating year gets accounted for. Refractory mapping should be systematic — sketch the full furnace interior with zones graded by condition, not just a list of patched spots. Pressure part UT thickness surveys should cover the full tube circuit in the splash zone and lower furnace (typically the highest erosion risk), with results plotted against the previous year’s baseline. Tube wall thinning exceeding roughly 0.5 mm per 1,000 operating hours in any zone should trigger immediate tube replacement planning, not a “monitor and recheck” deferral.
Cyclone wall thickness measurement is often skipped when budgets are tight. That’s a mistake — cyclone shell erosion tends to accelerate non-linearly once the wear liner is gone. Safety valve lift tests and CEMS analyzer calibration against certified reference gas cylinders are non-negotiable for regulatory compliance and should never be deferred to “next outage.”
Spare Parts Strategy and Vendor-Managed Inventory
Critical long-lead items — air distributor nozzles, loop seal aeration pipes, cyclone wear tile sets, drum safety valves — should be held on-site or through a vendor-managed inventory arrangement. Lead times on cyclone ceramic liner sets from specialized suppliers can run 12–20 weeks depending on specification and source. For EPC clients operating in regions with unreliable import logistics, carrying a full nozzle set and one spare safety valve per boiler is simply prudent asset management, not over-stocking.
Risk-Based Inspection: Let Operating History Drive Scope
A fixed calendar schedule is a starting point, not a ceiling. If the boiler ran three months on high-sulfur lignite instead of the design coal, the refractory inspection scope expands. If there were two thermal trips above 980°C in the previous year, the pressure part survey gets more ultrasonic test points in the cyclone outlet duct. Start-stop cycles matter too — a boiler with 40 cold starts per year ages its refractory faster than one running continuously, and the inspection interval should reflect that.
A structured CFB preventive maintenance program can reduce forced outage rate from approximately 8% to under 2% over a 3–5 year implementation period.True
Industry data from multiple CFB operating fleets shows that time-based and risk-based PM programs, when consistently applied, substantially reduce unplanned trips by catching defluidization precursors, erosion-driven tube failures, and refractory collapse before they escalate. The 8% to sub-2% range is realistic for plants transitioning from reactive to proactive maintenance; actual results depend on fuel variability, operator discipline, and outage budget allocation.
The TCO math is straightforward. A 150 t/h CFB boiler generating roughly 40–50 MWe loses somewhere between $15,000 and $35,000 per day during an unplanned outage, depending on power purchase agreement terms and replacement fuel costs — the range is wide because it depends heavily on whether the plant is merchant or contracted. Cutting forced outage rate from 8% to under 2% on a boiler operating 8,000 hours per year recovers 480 hours of lost generation annually. Over a 10-year horizon, combined with reduced tube replacement frequency and extended refractory life, a consistent PM program is typically the difference between a 25-year asset and one that reaches 35 years with margin to spare.
Frequently Asked Questions About CFB Boiler Troubleshooting
What is the first thing to check when CFB boiler bed pressure suddenly drops?
Check primary air flow rate and the distributor nozzle pressure drop at the same time — don’t look at either in isolation. A sudden bed pressure drop while primary air flow reads normal almost always means rapid bed inventory loss: material is either being carried over through the cyclone faster than solids return, or drain valves have leaked bed material out. That’s a different problem from a drop that’s accompanied by reduced primary air flow, which points toward the PA fan, its inlet damper, or a duct blockage. In practice, pulling up the trend historian for both bed pressure and PA flow over the previous 15–30 minutes usually tells the story. If bed pressure has been drifting down gradually over a shift rather than dropping sharply, look at your loop seal — restricted solid return is a slower but equally damaging cause of inventory loss.
How often should cyclone separator wear be measured in a coal-fired CFB boiler?
Ultrasonic thickness measurement at the barrel-to-cone junction and at the inlet duct should happen at every major outage, or every 8,000 operating hours, whichever comes first. If the previous interval showed erosion exceeding roughly 2 mm, shorten that interval — don’t wait for the calendar. The barrel-cone junction is where most people find surprises because velocity profiles concentrate there and early-stage wear looks superficial until suddenly it isn’t. Keep a map of measurement points from outage to outage; a single number without location context is nearly useless for trend analysis.
Can a CFB boiler be designed for coal be operated on biomass?
Yes, but not without a proper fuel switch feasibility study. The main issues are interconnected: biomass bulk density is typically lower, so the fuel feed system — screws, rotary valves, chutes — may not have the volumetric capacity to maintain heat input. Fluidization velocity usually needs to come down because the lighter, more friable fuel behaves differently in the bed. More critically, potassium-rich ash from most agricultural biomass causes aggressive alkali-induced fouling on superheater tubes, and if the original refractory was specified without accounting for potassium sulfate attack, you’ll see accelerated degradation in the furnace upper zone. A fuel switch is not a control-room adjustment — it requires engineering review across feed, combustion, heat transfer, and materials.
What causes recurring SO2 exceedances despite normal limestone feed rates?
Usually one of three things. First, degraded limestone quality: CaO content below roughly 85% means you’re feeding inert mass that isn’t absorbing sulfur. Second, wrong particle size — limestone that’s too coarse (above about 0.5 mm) doesn’t calcine fast enough in the furnace residence time, while material that’s too fine (below 0.05 mm) gets elutriated before it reacts. Third, bed temperature running below 820°C, which slows calcination severely. Check your limestone supplier’s certificates against actual delivered samples; in my experience, specification drift on CaO content is more common than people expect, especially with long supply chains.
SO2 removal efficiency with in-furnace limestone injection drops significantly when bed temperature falls below 820°C, even at Ca/S ratios of 2.0–2.5.True
Calcination of CaCO3 to reactive CaO requires sustained temperatures above roughly 820°C; below this threshold, conversion is incomplete and sulfation capacity drops sharply regardless of feed rate.
How do I distinguish a real high-bed-temperature alarm from a thermocouple fault?
Cross-check against adjacent thermocouples and the cyclone inlet temperature trend simultaneously. A genuine temperature excursion propagates — you’ll see correlated rises across multiple measurement points, and the cyclone inlet temperature will usually climb in step. A single thermocouple fault shows an isolated deviation while everything else stays flat. To confirm, check the cold junction compensation circuit for that instrument; a failed CJC or a broken compensating cable will produce a reading that drifts in one direction without physical cause. Don’t pull a fuel trip based on a single instrument reading if everything else is steady.
What refractory material is recommended for the cyclone cone in a high-sulfur coal CFB application?
Silicon carbide-based castable with SiC content above 70% and installed density above roughly 2.7 g/cm³ is the standard answer for this location — it handles the combined erosion and sulfate chemical attack better than high-alumina castables alone. Anchor spacing matters as much as material selection: keep anchors no further apart than 150 mm, because the thermal cycling in a CFB cyclone is aggressive and large unreinforced panels will spall under repeated start-stop cycles. Specify stainless steel V-anchors rather than plain carbon; sulfur-bearing atmospheres will corrode carbon steel anchors and undermine the refractory from behind.
How does Taishan Group support overseas CFB boiler projects with troubleshooting and maintenance services?
Each EPC project includes a full documentation package — commissioning manuals, P&IDs, cause-and-effect matrices, and a spare parts list sized to the specific unit and fuel type, not a generic catalog. For international clients, remote diagnostic support via CEMS data sharing is standard: the operations team can share real-time or historian data and receive engineering review without waiting for a site visit. On-site commissioning engineers are available for initial startup and for any major refractory or pressure-part repair outages. Training programs for local operations and maintenance crews are built into project delivery, covering both normal operations and the specific failure modes most relevant to the installed fuel and configuration.
References
Circulating Fluidized Bed Boilers — CFB Boiler Technology — GE Vernova
Circulating Fluidized Bed Boiler Technology and Solutions — Valmet
Circulating Fluidized Bed Boilers — Product Technology — Mitsubishi Power
Circulating Fluidized Bed Technology — Industrial Boiler Solutions — ANDRITZ
Fluidized Bed Combustion — Technology Overview — Babcock & Wilcox
BPVC Section VII — Recommended Guidelines for the Care of Power Boilers — ASME
National Board Inspection Code — Inspection, Repair and Alteration — National Board of Boiler and Pressure Vessel Inspectors
Coal Analysis and Production Information — Thermo Fisher Scientific
Boiler Logs Can Reduce Accidents — National Board of Boiler and Pressure Vessel Inspectors
How to Troubleshoot Common Issues in Circulating Fluidized Bed Boilers? Read More »