
How to Conduct Performance Testing and Calibration of a Circulating Fluidized Bed Boiler?
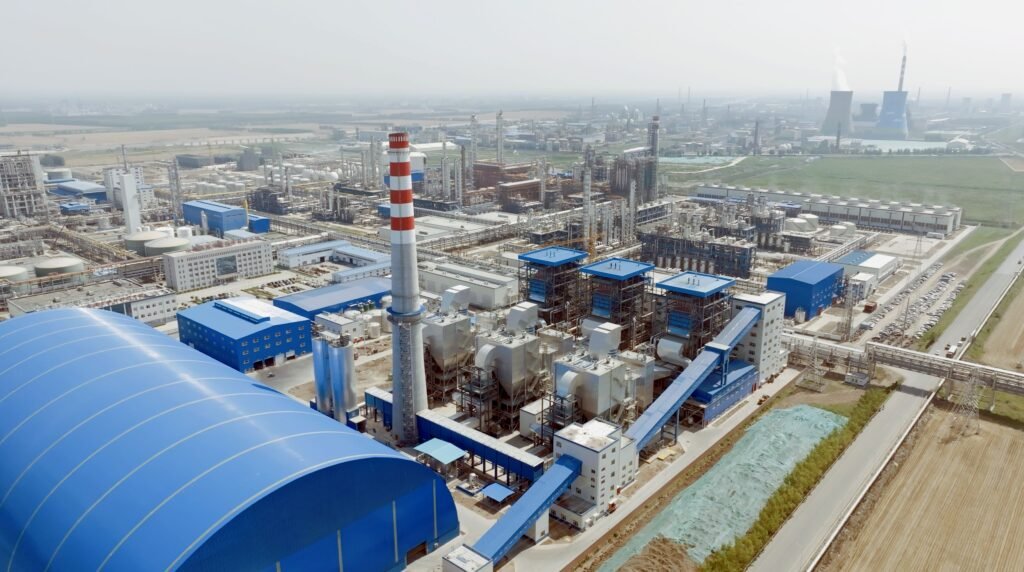
A CFB boiler running out of calibration is a slow bleed — bed temperature drifts above 950°C and you start losing refractory life faster than your maintenance budget can absorb, or it sags below 850°C and SO₂ capture collapses just as your emissions inspector shows up. Oxygen trim goes unmonitored, excess air creeps up, and fuel consumption quietly climbs 2–4% before anyone traces it to a miscalibrated O₂ probe. By the time a plant engineer notices the efficiency gap on the monthly report, the financial damage — unplanned downtime, excess fuel spend, regulatory fines — is already booked.
Performance testing and calibration of a CFB boiler involves systematically verifying bed temperature distribution (target 850–950°C), flue gas oxygen content (3–6% dry basis at the economizer outlet), carbon burnout, heat loss accounting, and auxiliary systems against baseline design values — typically following ASME PTC 4 or GB/T 10184 — then adjusting air distribution, fuel feed rates, limestone dosing, and instrumentation until measured efficiency reaches the 88–93% range expected under optimized operating conditions.
What makes CFB calibration genuinely different from pulverized-coal or stoker work is the number of interdependent control loops that can mask each other’s errors. Fix the secondary air split and your bed temperature settles nicely — but now your cyclone return-leg differential is off and char recirculation drops without triggering a single alarm. The following sections walk through each test domain in the sequence that actually works on a real plant floor, not the order that looks tidy in a standards document.
Pre-Test Preparation: Plant Readiness, Documentation, and Instrumentation Verification
Starting a performance test on a CFB boiler without proper pre-test groundwork is one of the most reliable ways to waste two or three days of test team time and end up with data you can’t defend. The preparation phase isn’t a formality — it’s where you catch the problems that would otherwise invalidate your results or force a retest at significant cost.
Mechanical Readiness: What to Walk Down Before You Touch an Instrument
The cyclone separator refractory is the first place to check, and it’s often the most overlooked. Spalling or cracking — particularly around the inlet duct and the cone section — causes bypass of unburned particles and hot gas, which skews combustion efficiency readings directly. A visual inspection through available access ports, combined with a review of any refractory repair history in the maintenance log, is the minimum. If there’s been a recent cold restart after an unplanned trip, assume the refractory needs a closer look.
Loop seal aeration nozzles deserve attention beyond what most teams give them. Blocked or partially blocked nozzles reduce solid recirculation, which shifts bed inventory and alters heat transfer in ways that make your test data non-representative of steady design-point operation. Pull a few nozzle plugs if access allows; at minimum, verify aeration airflow rates against design and check for unusual back-pressure signals in the DCS.
Air distributor plate pressure drop should fall within roughly 3 to 6 kPa under normal fluidizing conditions — the exact target depends on bed material particle size distribution and design air velocity, so pull the OEM specification rather than using a generic number. A drop significantly below range usually means nozzle erosion or breakage; above range suggests partial blockage or ash sintering near the plate. Either condition affects fluidization quality and will distort combustion performance results.
Walk every expansion joint and access door on the flue gas path before testing starts. An air in-leak of even a few percent at the economizer or air preheater casing will artificially elevate measured O₂ content and make your excess air calculation meaningless. Bed drain valves should be operated at least once to confirm they cycle freely — a seized drain valve during testing limits your ability to adjust bed inventory if conditions drift.
Instrumentation Calibration: Tolerance Is Not Optional
For CFB testing against ASME PTC 4 or GB/T 10184, all primary measurement devices need documented calibration before the test window opens. Thermocouples at the dense bed, freeboard (typically two or three elevations), cyclone inlet and outlet, superheater headers, economizer inlet/outlet, and air preheater exit should each have a calibration certificate dated within the interval specified by your test protocol — in practice, within 30 days is a reasonable threshold for mineral-insulated Type K or Type N thermocouples in high-temperature service.
Flow meters on primary air, secondary air, fuel feed (gravimetric or volumetric), feedwater, and main steam lines need to be within ±0.5% calibration tolerance. That’s not a loose target. A 1% error on feedwater flow alone propagates into a meaningful error on calculated heat absorption and — by extension — computed efficiency. Pressure transmitters across the furnace, cyclone, and flue gas ductwork should be zeroed and spanned against a traceable reference; don’t rely on the last scheduled PM date if the unit has had any significant transient event since then.
All flow and pressure instrumentation used in CFB performance testing should be calibrated to within ±0.5% of reading before the test begins.True
ASME PTC 4 and GB/T 10184 both specify instrument uncertainty limits that require primary flow measurement devices to be calibrated to this tolerance to keep overall test uncertainty within acceptable bounds for efficiency guarantee verification.
Documentation Package: Assemble Before the Test Team Arrives
Pulling documents on the morning of the test is a bad habit that causes delays and, occasionally, leads to testing against the wrong design basis. The package should be complete and reviewed at least 48 hours before mobilization.
Required items: the original design performance guarantee sheet (particularly guaranteed efficiency, steam output, and emission levels at specified fuel and load conditions); all prior performance test reports for the unit; fuel proximate and ultimate analysis certificates from samples taken within a week of the planned test date — coal quality variation is significant enough that a months-old analysis introduces real uncertainty; limestone sorbent specification showing Ca/S molar ratio target and particle size distribution; DCS historian data covering the prior 30 days to establish baseline operating trends and flag any anomalous periods; current P&ID drawings marked up to reflect any field modifications; and the applicable local environmental permit with emission limits for SO₂, NOₓ, CO, and particulate matter.
The 30-day DCS pull is worth emphasizing. Patterns in bed temperature drift, cyclone pressure differential trends, or recurring high-CO alarms in that window often reveal equipment issues that won’t show up on a single walk-down. If the historian shows bed temperature consistently running at the low end of the 850–950°C design band, that’s a fuel or air distribution problem worth resolving before you test, not during.
Establishing Stable Baseline Operating Conditions Before Data Collection
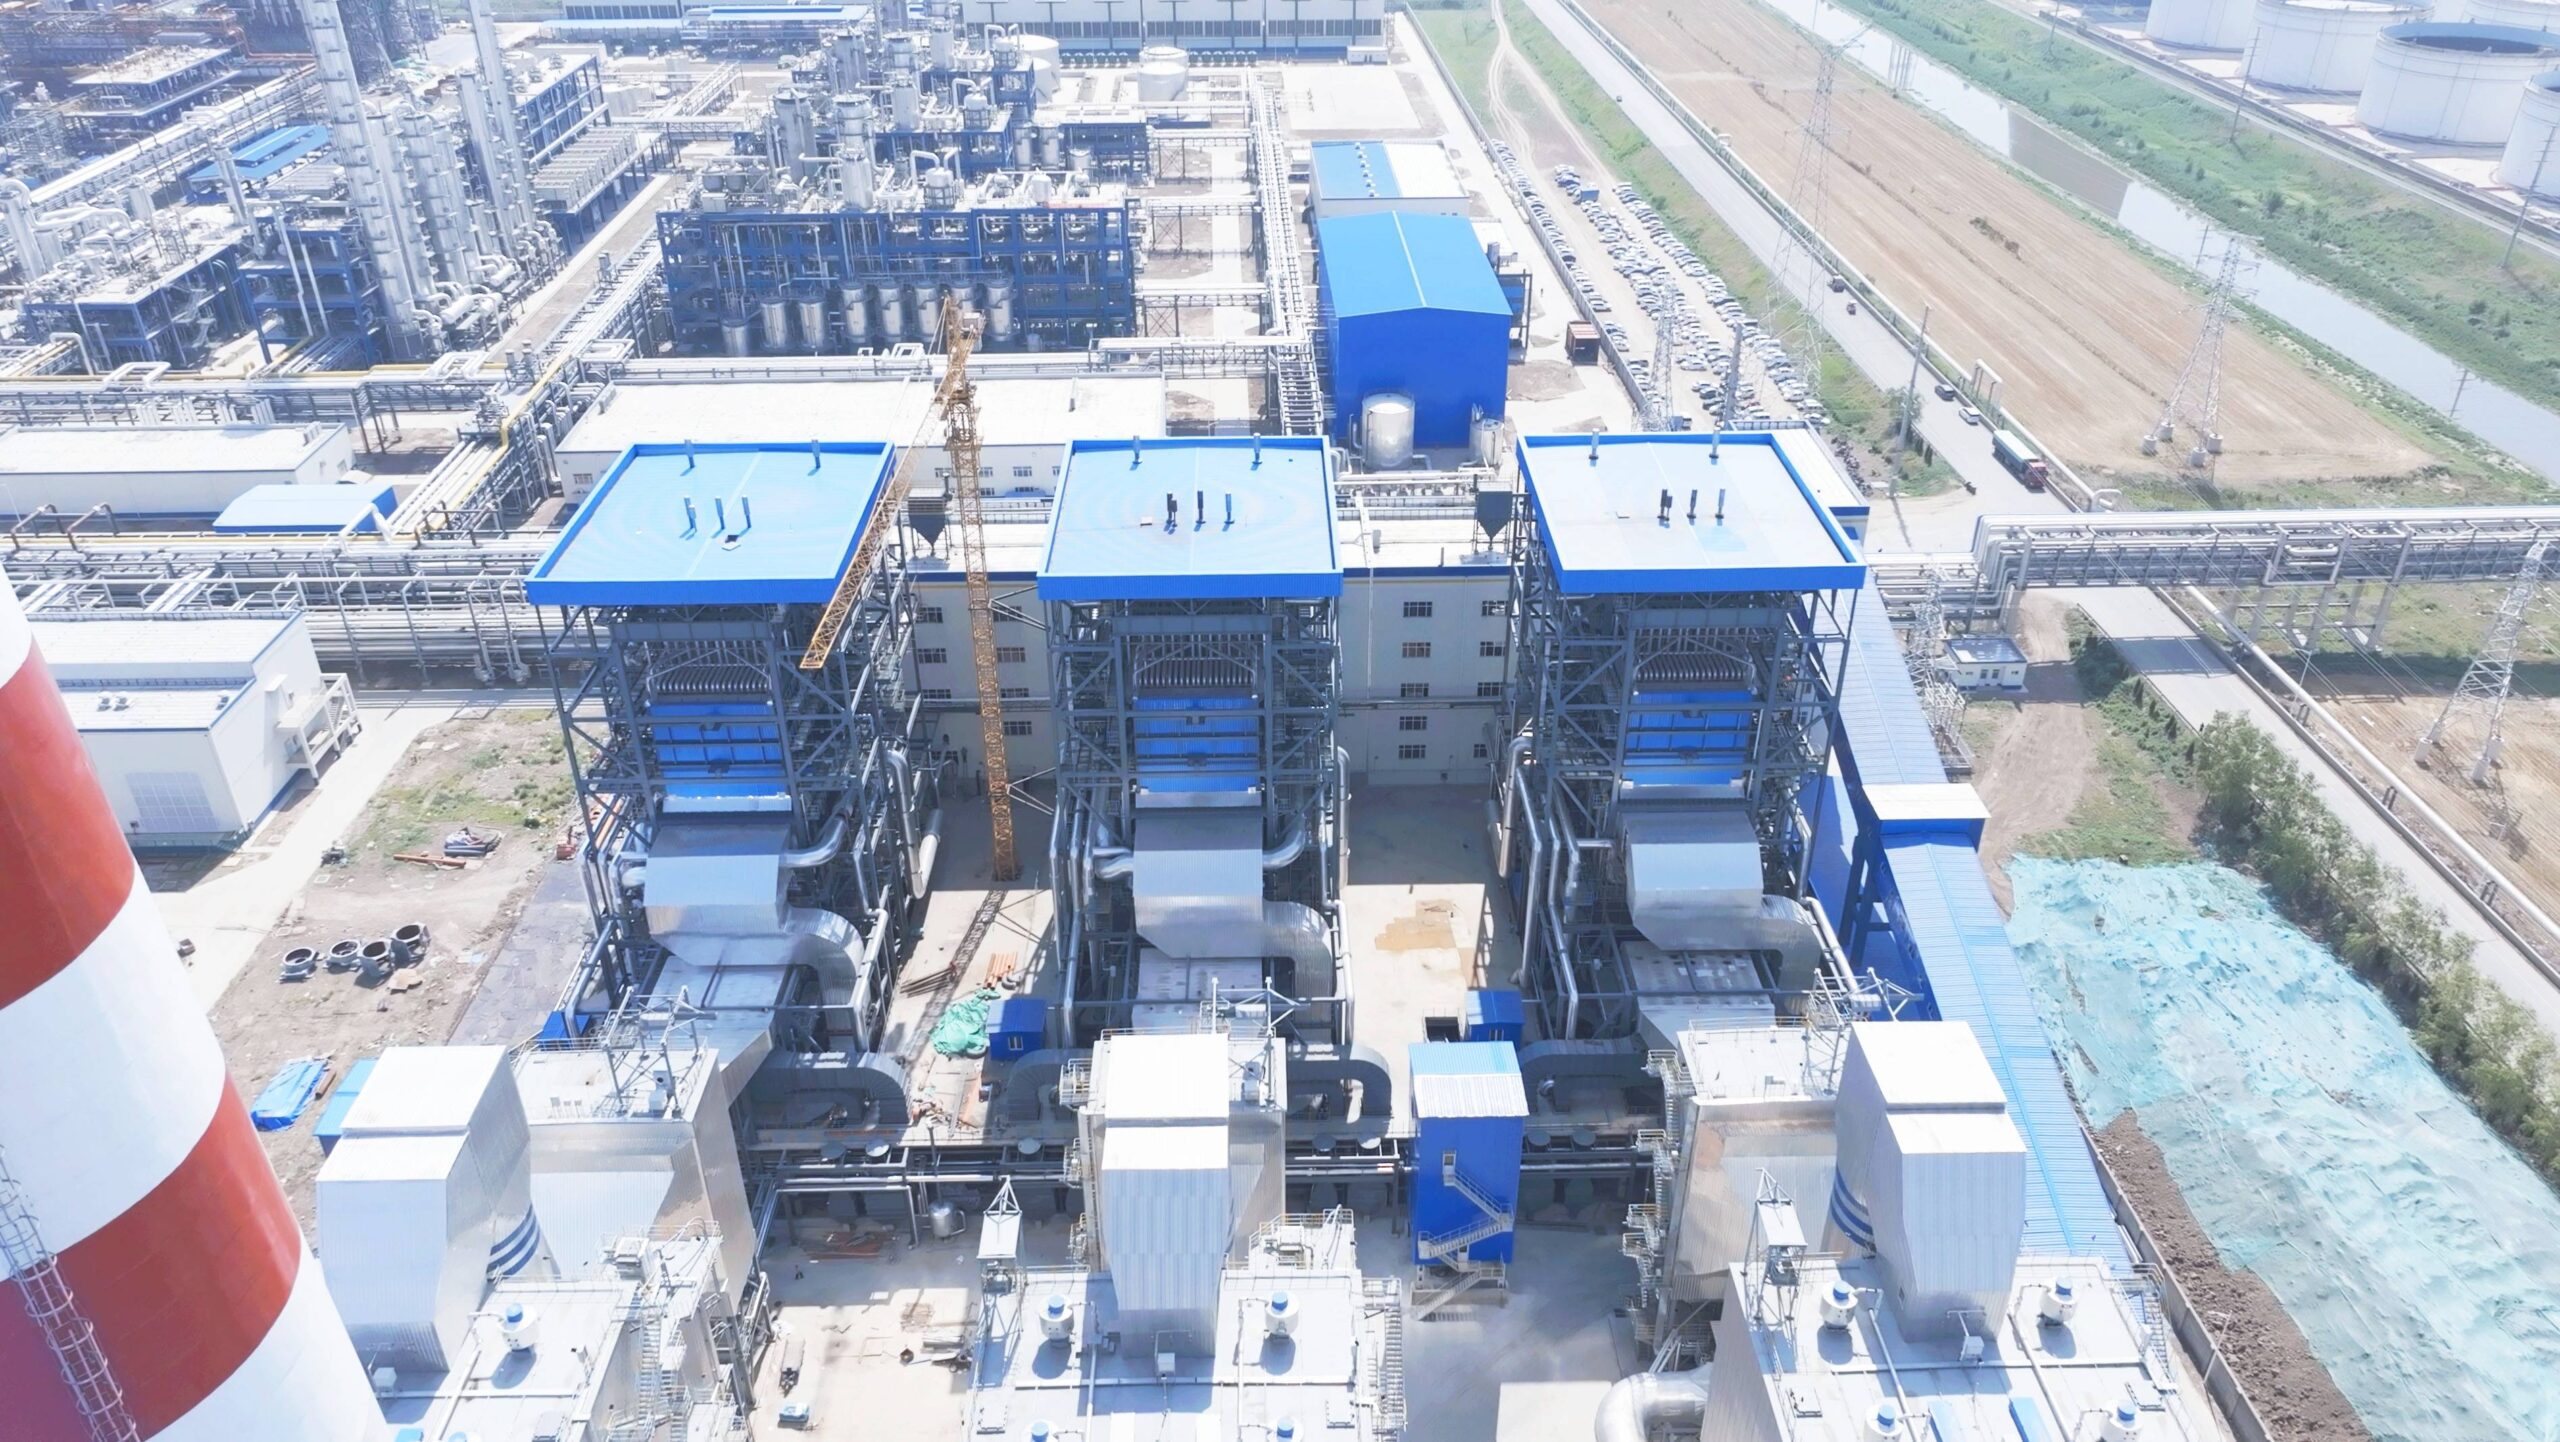
Before a single thermocouple reading or flue gas sample gets logged, the unit has to be genuinely settled — not just visually calm on the DCS trending screens, but measurably stable against defined acceptance criteria. This is where a lot of performance tests go wrong. The test team arrives, the boiler looks steady, someone calls “good enough,” and data collection starts. Then the post-test analysis reveals drift in bed temperature that inflated the calculated efficiency by a point and a half, or oxygen readings that wandered enough to make the combustion calculations meaningless. You don’t get a second chance at a witnessed acceptance test, so confirming stable baseline conditions isn’t a formality — it’s the technical foundation everything else rests on.
Steady-State Acceptance Criteria for CFB Units
The criteria used for a pulverized coal boiler don’t translate directly to CFB operation. The bed is a dynamic system with significant thermal mass, and it responds to disturbances more slowly and sometimes less predictably than a suspension-fired furnace. For a CFB performance test, the following windows should all be satisfied simultaneously before data collection begins:
| Parameter | Acceptance Window | Monitoring Period |
|---|---|---|
| Bed temperature (average of multiple probe locations) | ±15°C of target | 30 minutes continuous |
| Main steam pressure | ±0.5% of rated | 30 minutes continuous |
| Main steam temperature | ±5°C of setpoint | 30 minutes continuous |
| Flue gas O₂ at economizer outlet (dry basis) | ±0.3% absolute | 15 minutes continuous |
| Bed differential pressure | ±200 Pa of target | 30 minutes continuous |
All five have to hold concurrently. Passing four out of five is not a stable baseline.
Minimum Stabilization Hold Time and Why CFB Units Need More of It
Plan for a minimum hold period of 2 to 4 hours at target load before data collection starts — not 90 minutes, not “close to two hours.” The wide range depends on unit size, bed inventory mass, and whether an external heat exchanger (EHE) is part of the circuit. A 130 t/h unit with a standard loop seal arrangement typically stabilizes faster than a 440 t/h unit with an EHE, where the ash circulation rate and heat extraction balance need additional time to reach equilibrium after any load adjustment.
The fundamental reason CFB units require longer stabilization than pulverized coal boilers is thermal inertia. The fluidized bed inventory — typically several tonnes of bed material — acts as a thermal buffer. If load was increased to reach test conditions, that bed mass is still absorbing or releasing heat well after the fuel feed rate has been adjusted. Steam parameters may look stable before the bed temperature has actually settled, which creates a deceptively clean DCS trend that hides real drift. The EHE complicates this further because ash circulation rate, which governs heat transfer to the secondary superheater or reheater surfaces in that circuit, doesn’t stabilize instantaneously after a hydrodynamic change.
A CFB boiler's fluidized bed thermal inertia requires longer pre-test stabilization than pulverized coal boilers of equivalent capacity.True
The dense bed inventory in a CFB unit stores significant thermal energy, meaning bed temperature continues to drift after fuel and air inputs are adjusted. Pulverized coal furnaces have no equivalent solid thermal mass in the combustion zone, so they respond and stabilize faster to operating point changes.
Common Destabilizing Factors and Corrective Actions
Fuel moisture fluctuation is probably the most common source of instability on plants burning coal with inconsistent surface moisture — anything that varies by more than roughly 3 to 4 percentage points across a shift. Higher moisture cools the bed directly and reduces combustion intensity; lower moisture spikes it. The corrective action isn’t glamorous: tighten stockpile management in the days before the test, blend from a consistent pile, and if the plant has a crusher with a moisture meter, use it. During stabilization, monitor bed temperature trend rate rather than absolute value — if the trend is still moving at more than about 2°C per minute, you’re not ready.
Limestone feed interruptions shift bed chemistry and, more immediately, affect the SO₂ capture equilibrium that influences combustion zone temperature. Even a 15-minute interruption can take 30 to 45 minutes to wash through the system. Check limestone silo levels, screw feeder condition, and any pneumatic conveying line pressure drops before the stabilization period begins — not during it.
Primary-to-secondary air ratio drift is subtle and easy to miss if operators are watching steam parameters rather than windbox pressure differentials. A shift in the PA/SA split alters the hydrodynamic profile of the furnace: too much primary air increases entrainment and thins the bed inventory in the lower furnace; too little drops fluidization velocity and risks defluidization in localized zones. Both move bed differential pressure and O₂ simultaneously. If O₂ is drifting during stabilization, check the FD fan vane positions and the air flow transmitters before assuming it’s a combustion issue.
Partial clogging of bed ash cooler outlets is one of those problems that sneaks up on you. It restricts bed material drainage, which gradually increases bed inventory and bed differential pressure. The bed gets denser, fluidization behavior changes, and combustion air distribution shifts. The fix — clearing the cooler outlet — causes a sudden drop in bed pressure that destabilizes everything again and resets the stabilization clock. Check cooler drain flow rates and outlet temperatures during the pre-stabilization period, not after you’ve already logged 90 minutes of “stable” data.
In practice, it helps to assign one engineer specifically to watch the stability trend board during the hold period with authority to delay the test call. Operators under schedule pressure will sometimes declare stability prematurely. A written sign-off against all five criteria, time-stamped, protects everyone.
Thermal Efficiency Testing Methods: Input-Output and Heat Loss (Indirect) Approaches
Two fundamentally different approaches exist for measuring CFB boiler thermal efficiency, and choosing the wrong one — or applying the right one carelessly — will produce numbers that look credible but are quietly wrong. Both have their place. Understanding when to use each, and where the traps are, is what separates a defensible performance test from a paperwork exercise.
The Direct Input-Output Method
The input-output method is conceptually simple: measure the heat absorbed by the working fluid, divide by the heat supplied in fuel. For a steam boiler, the numerator is the product of steam mass flow and the enthalpy rise from feedwater inlet to steam outlet. For a hot water boiler it’s mass flow multiplied by the temperature differential across the circuit, adjusted for specific heat. Clean in theory.
In practice, the method lives or dies on two measurements that are genuinely hard to get right: fuel mass flow and fuel calorific value. Solid fuel — coal, biomass blends, refuse-derived fuel — is notoriously difficult to meter accurately on a live plant. Belt weighers drift; chute blockages cause surges; moisture variation in run-of-mine coal can swing the as-received LHV by 10–15% within a single shift. If your fuel sampling protocol is weak, the input-output result is noise dressed up as data.
The standard you’re working under matters for the HHV/LHV convention. ASME PTC 4 is based on HHV (higher heating value), which includes the latent heat of condensed water vapor in combustion products — a heat that a boiler never actually recovers. GB/T 10184 and DIN EN 12952 both use LHV. This isn’t a trivial difference: for a bituminous coal with roughly 8–10% hydrogen content, the LHV-based efficiency figure will be 2–4 percentage points higher than the HHV-based figure for the same physical performance. Comparing numbers across standards without adjusting for this convention is a common procurement mistake.
The Indirect Heat Loss Method
Most serious performance tests on CFB units use the indirect (or loss) method as the primary result, cross-checked against the input-output figure. The logic is straightforward: instead of trying to measure fuel flow precisely, you measure every heat loss and subtract their sum from 100%. Each individual loss is more tractable than total fuel throughput.
The loss components, with typical CFB-specific ranges, break down roughly as follows:
| Loss Component | Symbol | Typical CFB Range | Main Driver |
|---|---|---|---|
| Dry flue gas sensible heat | q2 | 4–7% | Excess air, exit gas temp |
| Moisture in flue gas latent heat | q3 | 0.5–2.5% | Fuel moisture, hydrogen content |
| Unburned carbon (fly ash + bed ash) | q4 | 1–4% | Fuel reactivity, cyclone efficiency, bed temp |
| Radiation and convection surface loss | q5 | 0.2–0.5% | Unit size (larger units lose less proportionally) |
| Sensible heat in bottom ash | q6 | 0.3–1.0% | Bed ash discharge temperature, ash rate |
| CO chemical incomplete combustion | qCO | 0.1–0.5% | Air distribution, bed temperature uniformity |
q4 deserves particular attention in CFB testing. Unlike a pulverized coal boiler where nearly all ash exits as fly ash, a CFB splits carbon-containing ash between the cyclone return, fly ash hoppers, and bed drain. The weighting matters: if your cyclone separation efficiency is high and bed ash constitutes 30–40% of total ash by mass, and that bed ash carries 3–5% unburned carbon while fly ash carries only 1–2%, ignoring the split — or guessing at the mass flow ratio — introduces meaningful error. Fuel type amplifies this further; high-ash coals from certain regions or mixed biomass-coal blends behave very differently from cleaned bituminous.
CFB-Specific Considerations That Other Boiler Types Don’t Require
CFB boilers burning sulfur-bearing fuel with limestone injection have a small but real exothermic credit from the sulfation reaction (CaSO₄ formation). ASME PTC 4 explicitly accounts for this; GB/T 10184 handles it in the fuel heat input correction. In practice, for a unit running Ca/S molar ratios of 2–3 on a 1.5–2% sulfur coal, the sulfation credit shifts the calculated efficiency by roughly 0.2–0.5 percentage points. Small, but when you’re trying to confirm whether a boiler meets a guaranteed 90% efficiency figure at contract acceptance, every tenth counts.
CO measurement is non-negotiable on CFB units. Bed temperature is normally held between 850°C and 950°C — low enough to suppress NOx but also the range where CO breakthrough can occur if air distribution is uneven or if the secondary air injection points are partially blocked. A CO reading above 250 mg/Nm³ at the economizer exit suggests the qCO loss term is being underestimated, and it often signals that the stated bed temperature is a single-point average masking cold zones.
CFB boiler thermal efficiency typically ranges from 88% to 93% under optimized operating conditions per ASME PTC 4 and GB/T 10184 standardsTrue
This range reflects real-world CFB units operating on coal at designed load with proper limestone injection and calibrated air distribution. Units burning high-moisture biomass or low-rank fuels, or operating significantly below MCR, will sit toward the lower end or below this range. The 88–93% band is consistent with published test results under both HHV (ASME) and LHV (GB/T) conventions, adjusted for the respective standard's baseline.
One practical note: run both methods in parallel during a formal acceptance test whenever contractually feasible. If the input-output result and the loss-method result diverge by more than 1.5–2 percentage points, something is wrong — usually either fuel sampling, flue gas flow measurement, or an overlooked ash stream. The discrepancy itself is diagnostic information.

Emissions Performance Testing: NOx, SO2, CO, Particulate, and Mercury Compliance Verification
CFB boilers have a fundamentally different emissions profile from pulverized coal or stoker-fired units, and that distinction matters when you’re setting up a test. The low bed temperature — typically held between 850°C and 950°C — suppresses thermal NOx formation almost by default. That’s the technology’s core advantage. But getting a valid, legally defensible emissions measurement still requires careful attention to sampling location, analyzer selection, and how your CEMS has been maintained leading up to the test.
Flue Gas Sampling Location and Isokinetic Requirements
The single most common mistake in stack testing is choosing a measurement plane that’s too close to a bend, damper, or fan outlet. Per ISO 16911-1 and EPA Method 1, the sample traverse should be located at least 5 to 10 equivalent duct diameters downstream of the last significant flow disturbance — more if the upstream geometry is particularly chaotic, which it often is in retrofitted or older plants. Eight diameters is a reasonable working target in most cases; shorter if you have velocity profile data showing acceptable flow uniformity, longer if you don’t.
For particulate matter, isokinetic sampling is non-negotiable. The sample extraction velocity must match the local flue gas velocity within ±10% or the particle size cut will be wrong, and you’ll either under-report or over-report depending on which direction you’re off. In practice, this means you need a pitot traverse before the particulate run, not a rough estimate from design drawings.
Analyzer selection depends on the target species. Electrochemical cells are adequate for CO in many portable setups, but NDIR analyzers give better stability over a long test and are preferred for regulatory submittals. NOx measurement should use chemiluminescence — it’s the reference method under EPA Methods 7E and 20, and most national equivalents. For SO₂, UV fluorescence or extractive FTIR are both acceptable; extractive FTIR has the added advantage of measuring HCl, HF, and mercury simultaneously if your permit requires those. Moisture removal through a Peltier cooler or ice bath condenser is required before the sample reaches most analyzers — dry-basis reporting is the standard, and wet-basis readings that get converted with a poorly characterized moisture fraction introduce real uncertainty.
CFB-Specific Emission Benchmarks
NOx emissions from a well-operated CFB boiler typically fall between 100 and 200 mg/Nm³ at 6% O₂ reference without selective catalytic reductionTrue
The low combustion temperature (850–950°C) in a CFB furnace inherently limits thermal NOx formation. Fuel NOx dominates, and staged air injection further suppresses it. Published test data from multiple operating CFB units and IEA Clean Coal Centre reviews confirm this range for bituminous and sub-bituminous coals.
SO₂ capture depends heavily on limestone quality, Ca/S molar ratio, and bed temperature uniformity. At a Ca/S ratio of 2.0 to 2.5, expect 80% to 90% removal under good operating conditions — but “good” means consistent sorbent particle size (typically 0.1 to 0.3 mm mean diameter), uniform distribution across the bed, and bed temperature not drifting above 950°C where CaSO₄ calcination can reverse. Plants burning high-sulfur coal and pushing Ca/S above 2.5 to chase the last few percent of removal often see increased bed agglomeration risk. There’s a trade-off there worth flagging in the test report.
Particulate at the stack after a well-maintained fabric filter should be below 30 mg/Nm³ for modern units — most national regulations in Europe, China, and South Asia now require that or lower. If you’re seeing 50 to 80 mg/Nm³, start with the bag integrity before questioning the measurement.
CEMS Calibration, RATA, and Regulatory Documentation
A test campaign that produces good manual stack test numbers but has a poorly calibrated CEMS is still a compliance problem. Under 40 CFR Part 75 and the EU Industrial Emissions Directive, span and zero calibration must be performed daily using certified reference gases traceable to NIST or equivalent national standards. Drift between calibrations above 2.5% of span typically triggers a data substitution requirement — meaning the monitor is considered invalid for that period, which cuts into your data availability.
Relative Accuracy Test Audits (RATA) require simultaneous manual reference method measurements alongside the CEMS at prescribed intervals — typically quarterly for new systems, then annually once performance is established. Relative accuracy must usually be within 20% of the mean reference method value, or within an absolute tolerance specified in the regulation, whichever is less stringent. Failing a RATA is serious; it can trigger enhanced monitoring requirements or regulatory scrutiny.
Data availability is usually required at 90% or above on a rolling 30-day basis. Plants with aging analyzers, poor purge gas management, or weak preventive maintenance on sample conditioning systems routinely fall below this threshold — usually not because the analyzer itself failed, but because a plugged filter or a cracked sample line went unnoticed for a week. Keep a maintenance log that’s actually used, not one that gets filled in after the fact.
For third-party audit purposes, calibration records should include the reference gas cylinder certification, the date and technician signature, instrument response before and after adjustment, and any corrective actions taken. Regulatory bodies increasingly request these records electronically, and gaps or inconsistencies — even minor ones — tend to invite closer scrutiny during permit renewals.
Key Instrument Calibration Procedures: Flow Meters, Thermocouples, Pressure Transmitters, and Fuel Analyzers
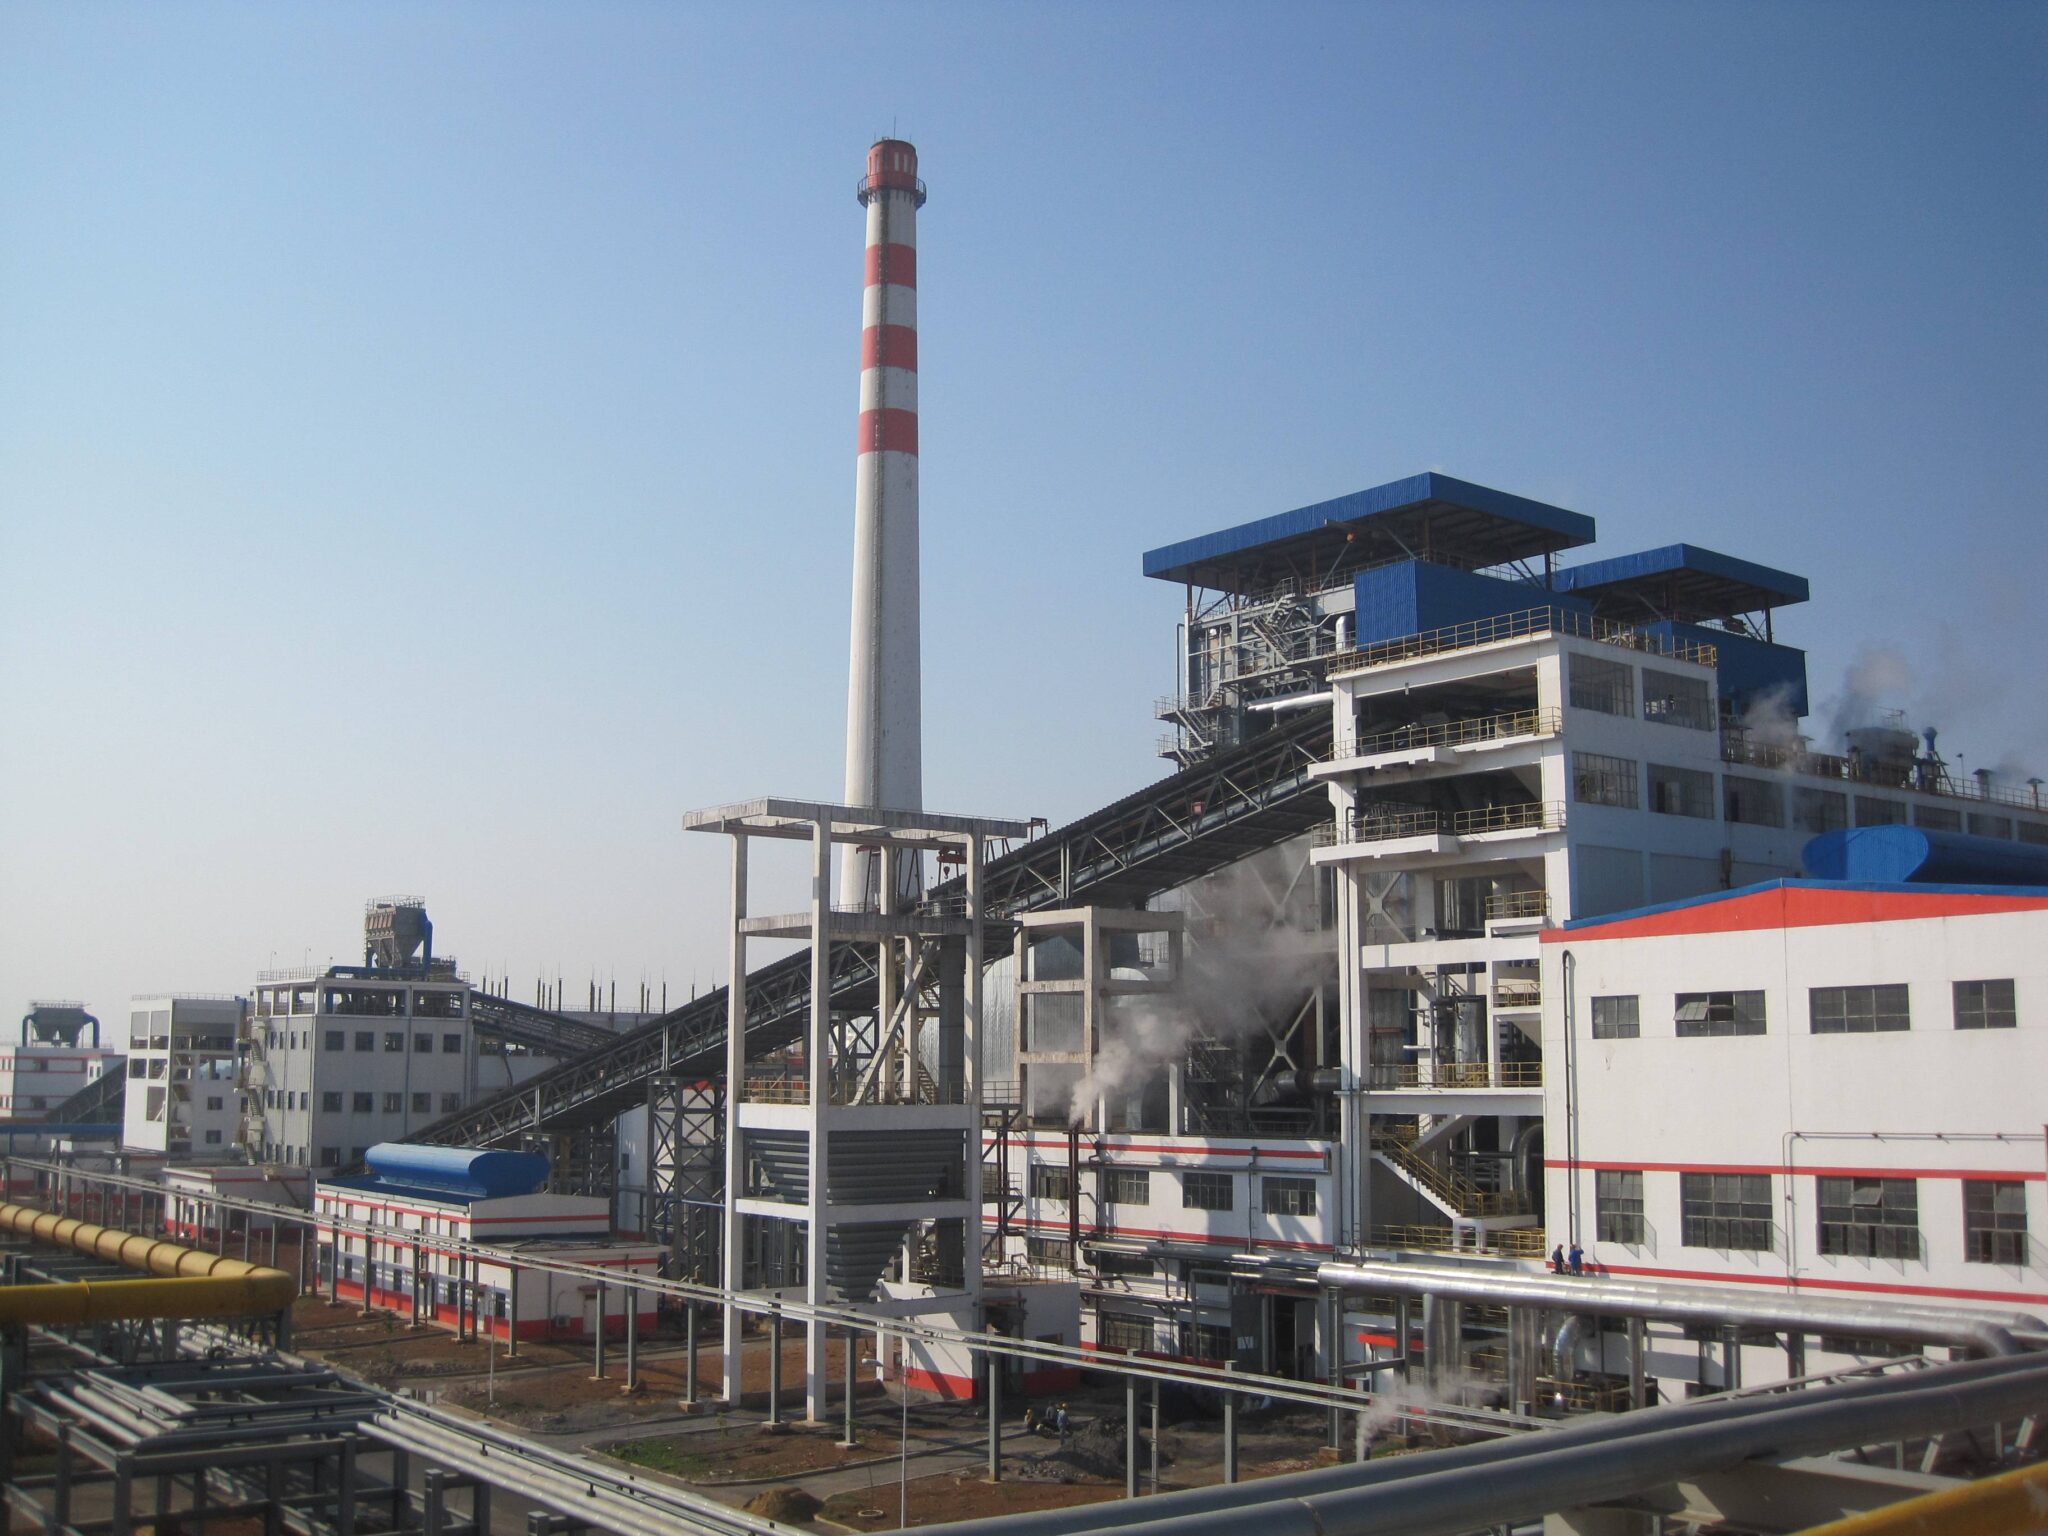
Calibration is where performance testing either holds up or falls apart. You can follow every step in ASME PTC 4 correctly and still walk away with efficiency numbers that are off by 1.5–2% if your flow meters haven’t been verified against a traceable standard or your thermocouples have drifted over a long campaign. On a 75 t/h coal-fired CFB unit, that kind of error gap is the difference between a boiler that appears to meet contractual guarantees and one that doesn’t — and that matters enormously when an EPC handover is pending.
Steam and Feedwater Flow Meter Calibration
For orifice plate meters — still the most common arrangement on steam and feedwater lines at CFB plants in the 20–200 t/h range — the pre-test verification has to start with physical measurements, not just the transmitter. Pull the meter run documentation and confirm the beta ratio (typically 0.3–0.75 depending on line size and flow range) matches the as-built bore dimensions. Wear on the upstream edge of the orifice plate, particularly in feedwater lines handling slightly abrasive or scaled water, can shift the discharge coefficient enough to introduce 0.5–1.5% systematic error in flow readings. Measure the pipe bore at minimum four diameters upstream; if it deviates from the design value by more than 0.1%, recalculate.
The differential pressure transmitter feeding that orifice calculation needs calibration against a dead-weight tester or a traceable pneumatic pressure standard across its full operating range — not just a mid-span single-point check. A ±0.5% span error in the DP cell translates through the square-root relationship to roughly ±0.25% in flow, but that’s under ideal conditions. At low load, when differential pressure drops well below the calibrated range, the error amplifies significantly. Reference ISO 5167 or ASME MFC-3M for the calculation methodology and acceptable uncertainty budgets.
A 1% error in steam flow measurement propagates directly to approximately a 1% error in calculated thermal output, and therefore in measured boiler efficiency.True
Steam flow is the primary output term in the input-output efficiency method (Q_output = ṁ_steam × Δh). A proportional error in mass flow rate carries through linearly to the output energy term, making steam flow the single largest source of efficiency measurement uncertainty in most test configurations.
Vortex meters on steam lines and electromagnetic meters on feedwater require a different check: confirm that installation straight-run requirements (typically 10–20 pipe diameters upstream, 5 downstream, depending on upstream fittings) are actually met in the field. It’s surprisingly common to find a vortex meter installed two diameters past an elbow because the original piping layout made it convenient. That alone can push flow uncertainty beyond 2%, which makes the efficiency number essentially useless for contractual purposes.
Thermocouple Calibration and Replacement Criteria
CFB furnaces run bed temperatures between 850°C and 950°C, with cyclone inlets often 50–100°C higher depending on load and fuel. The choice of thermocouple type isn’t a minor detail. Type K (nickel-chromium / nickel-aluminium) handles up to 1200°C on paper, but in high-sulfur coal environments above 900°C it sulfidizes at the sheath surface and drifts low — sometimes by 15–30°C after a few thousand hours — which causes operators to chase a bed temperature that’s actually hotter than indicated. Type N (nickel-chromium-silicon / nickel-silicon) has meaningfully better resistance to sulfidation and oxidation in that temperature band and is the better practical choice for bed and dense-phase zone measurements. For furnace top and cyclone inlet locations above 1000°C where measurement accuracy is critical for performance testing, Type S (platinum-rhodium/platinum) is the reference-grade option, though cost and fragility mean it’s usually deployed only during formal test campaigns rather than permanently installed.
In-situ comparison calibration during a test campaign means inserting a portable calibrated reference probe adjacent to the installed thermocouple at the same depth and comparing readings under stable conditions. Per IEC 60584, the acceptance tolerance is ±2.2°C or ±0.75% of reading, whichever is greater — so at 900°C that’s ±6.75°C. If the installed sensor exceeds that, it gets flagged for replacement before data collection proceeds. Replacement decisions should be driven by drift trend monitoring from previous tests, not a fixed annual schedule; a thermocouple in a clean-fuel boiler running moderate temperatures might be reliable for three or four years, while one sitting in a high-chlorine biomass co-firing CFB might drift beyond tolerance in under twelve months.
Air Flow and Fuel Feed Calibration: The Underestimated Sources of Error
Primary air flow in a CFB boiler isn’t just a combustion parameter — it’s the fluidization mechanism. Get it wrong and you’re not just miscounting excess air; you’re potentially misinterpreting bed behavior entirely. The challenge is that primary air passes through the air distributor plate at varying pressure drops, and the flow transmitters feeding the combustion control system are usually located in the windbox supply duct, well upstream of any distributor pressure effect. Those transmitters need calibration via pitot tube traverses at commissioning and after any fan change, duct modification, or major shutdown where ductwork was accessed. EPA Method 2 or ISO 10780 traverses, done properly at enough measurement points to capture the velocity profile, give you the reference flow rate to set the transmitter against. In practice, many plants skip the re-traverse after a fan impeller replacement — and that’s where silent calibration drift enters the system.
Secondary air flow calibration follows similar logic, though the consequences of error there lean more toward NOx and burnout than toward fluidization stability.
Fuel feed rate is, in most test setups, the largest single uncertainty contributor to the indirect (heat loss) efficiency calculation. Gravimetric belt weighers should be calibrated to within ±1% of full scale using static test weights across the full belt width, then verified with a dynamic weigh check using a known mass of coal over a timed run. Screw feeder load cells need the same rigor — zero the cell with the empty feeder running, span it with a calibrated test weight, and confirm linearity at three or four intermediate points. A ±2% fuel feed error on a unit burning 10–12 t/h of coal introduces enough uncertainty to make distinguishing between 89% and 91% thermal efficiency impossible. That’s a gap worth closing before mobilizing a full test team.
Load Variation Testing and Part-Load Performance Mapping for CFB Boilers
A single-point efficiency test at 100% MCR tells you almost nothing about how a CFB boiler actually performs across a shift. Most industrial units spend a significant portion of their operating hours somewhere between 50% and 80% load — during grid demand troughs, fuel quality swings, or process steam fluctuations. Building a complete performance map across the full operating range is what separates a rigorous acceptance test from a checkbox exercise.
Standard Load Test Points and Why Each One Matters
The accepted framework calls for discrete test runs at 100% MCR, 75% MCR, 50% MCR, and minimum stable load. For CFB units, that minimum stable load typically falls in the 30%–40% MCR band — noticeably lower than a conventional pulverized coal boiler, which usually struggles below 40%–50% without oil support. The reason CFB technology handles deep turndown better is the thermal buffer provided by the circulating bed inventory itself: several hundred tonnes of hot solids act as a heat reservoir that damps out combustion instability in ways a suspended flame simply cannot.
Each load point is not a snapshot. You hold the target load long enough to confirm genuine steady state — usually 45 to 90 minutes of stable operation before the clock starts on data collection — and then collect continuously for a minimum 60-minute window. Rushing this is how plants end up with efficiency figures that look fine on paper but don’t survive a serious audit.
What to Monitor and Record at Each Load Point
Thermal efficiency versus load is the headline metric, but the curve shape matters as much as any individual number. CFB units typically show a modest efficiency dip at 50% MCR and below, partly due to increased relative heat losses and partly because excess air requirements climb as load drops. At low loads, maintaining adequate bed fluidization demands a minimum superficial gas velocity — you can’t simply throttle the primary air in proportion to fuel input, which means excess oxygen at the economizer outlet rises, often pushing toward the upper end of the 3%–6% dry-basis range or occasionally exceeding it.
Bed temperature is non-negotiable. Below roughly 800°C, limestone-based SO₂ capture becomes unreliable — the calcination reaction slows and sulfur slip increases, which can push you into permit exceedances before the control system registers a problem. Above 950°C, sintering and agglomeration risk climbs sharply, particularly with fuels containing high alkali ash. At each load point, log bed temperature at multiple furnace elevations, not just the primary thermocouple the DCS displays. Channeling and cold spots are real and they hide from single-point measurements.
CFB boilers can typically sustain stable operation at 30–40% MCR without external flame support, lower than most pulverized coal boilersTrue
The large thermal mass of the recirculating solid bed inventory buffers combustion stability at low loads, which is a well-documented operational advantage of CFB technology over suspended-flame systems
Superheat steam temperature deviation from design setpoint should be tracked against load — a boiler that holds rated superheat at 100% MCR but droops 15–20°C at 60% MCR will affect turbine efficiency and potentially steam quality for process users. Auxiliary power consumption as a percentage of gross output typically worsens at part load because ID/FD fans and the primary air fan don’t scale down efficiently; documenting this helps owners calculate real net efficiency, not just the combustion-side number.
Turn-Down Ratio Verification
Testing minimum stable load isn’t just about hitting a percentage. You’re verifying that fluidization remains in the turbulent regime — bed slumping or defluidization can happen gradually, and the first signs are often a rising differential pressure across the lower furnace combined with erratic bed temperature readings rather than a dramatic shutdown.
Measure bed pressure drop against fluidization air velocity at each load point and plot both against the turbulent fluidization regime boundaries for your specific bed particle size distribution. If measured points approach the transition to bubbling or slugging flow, that’s a design or operating margin problem that needs to be documented and addressed before the boiler enters commercial service.
Scan flue gas temperature profiles across the furnace cross-section at minimum load using a grid of portable thermocouples or a calibrated infrared traverse — flow maldistribution at low loads is common in larger furnaces and produces localized incomplete combustion zones that won’t show up in the stack CEMS. In practice, this step gets skipped more often than it should, and plants later wonder why CO exceedances occur intermittently at low load without an obvious cause.
The completed performance map — efficiency, excess air, bed temperature envelope, superheat deviation, and auxiliary power draw plotted continuously across the 30%–100% MCR range — becomes the operational baseline document. It supports contract guarantee verification, informs dispatch optimization, and gives maintenance teams an objective reference for detecting degradation over time.

Calibration of CFB-Specific Control Systems: Bed Temperature, Bed Inventory, and Sorbent Feed
CFB boilers have control loops that simply don’t exist on pulverized coal or stoker-fired units, and that novelty creates real calibration gaps — especially on plants that rely on instrument technicians trained primarily on conventional boilers. Getting these three systems calibrated correctly isn’t just about meeting a test standard; it’s about preventing sintering events, controlling sulfur capture costs, and keeping wear rates on cyclones and back-pass surfaces inside a manageable range.
Bed Temperature Control and Thermocouple Calibration
The bed temperature setpoint in a CFB is typically held between 850°C and 950°C, and reaching that band involves coordinating fuel feed rate, the split between primary and secondary air, and — on units fitted with an external heat exchanger (EHE) or internal bed cooling panels — the rate of heat extraction from the dense phase. That’s three interacting variables. If any one of the sensors feeding those control loops is reading off, the others will compensate incorrectly and you’ll chase instability for days without finding it.
Calibrate all bed thermocouples as a matched set, not individually in isolation. The furnace cross-section has real temperature gradients, so the average matters as much as any single point, and the control system usually uses a median or averaged signal anyway. Run each thermocouple against a calibrated reference at 850°C and 950°C minimum — ideally at a third point near 700°C to catch any non-linearity in the compensation cable or the transmitter. Replace any element showing drift beyond ±5°C from reference before the performance test.
After the instrument checks, validate the control loop response time with a deliberate step test. Drop the fuel feed setpoint by roughly 5–8% and record how long the bed temperature takes to respond, stabilize, and return once corrected. Response times longer than about 3–4 minutes often point to a PID tuning issue or a mechanical lag in the fuel metering system — a worn rotary feeder or bridging in the fuel chute.
Verify the high-bed-temperature alarm at 950°C to 970°C and confirm the emergency fuel trip fires reliably at 980°C to 1000°C. Sintering typically begins above 1050°C for most coal ashes, but the safety margin needs to account for measurement lag and spatial non-uniformity in the bed. A trip that’s been silenced by maintenance and never re-enabled is more common than it should be; check the bypass status directly in the DCS historian, not just from the panel.
Bed Inventory Differential Pressure Calibration
Bed mass, or bed inventory, can’t be measured directly during operation. The practical method is differential pressure between the furnace bottom plenum and a tap located 1 to 2 meters above the air distributor. That dP reading is the primary indicator of bed height, and therefore of heat transfer surface contact, carbon residence time, and fluidization quality.
Calibrate these dP transmitters against a precision manometer — a calibrated dead-weight tester or a reference-grade electronic manometer accurate to at least ±0.1% of span. Pay attention to impulse line condition; partially plugged or water-filled legs produce chronic zero offsets that look like slow inventory loss and generate unnecessary bed ash drain cycles.
Incorrect bed inventory calibration causes poor heat transfer, elevated carbon carry-over to the cyclones, and accelerated wear on back-pass surfaces.True
Under-reading bed dP leads operators to add bed material unnecessarily or drain too frequently, disrupting fluidization quality. Over-reading causes under-draining, which raises bed height, increases pressure drop, and overloads the ID fan — while excess carbon fines escaping to the cyclones increase erosion on cone sections and the return leg.
Cross-check the transmitter output against historical commissioning data or cold-model correlations for that specific furnace geometry. The relationship between dP and actual bed height is not linear once solids concentration gradients form in the lower furnace, so using a single conversion factor across all load points introduces systematic error. Most plants have this correlation documented in the OEM commissioning report — if it can’t be located, that’s worth fixing before the performance test.
Limestone Sorbent Feed Rate Calibration
Limestone feed calibration is one of those tasks that gets skipped when schedules are tight, then shows up as unexplained SO₂ exceedances during the test. Calibrate gravimetric feeders or rotary valves using a weigh-hopper check: divert the discharge into a tare-weighed container over a known time interval — 2 to 5 minutes usually gives enough mass for reasonable accuracy — and compare against the feeder’s indicated rate. Do this at three points across the expected operating range, not just at design load. Rotary valve volumetric capacity changes as sorbent bulk density shifts with particle size or moisture content, so a single-point check gives false confidence.
The Ca/S molar ratio control algorithm depends on real-time SO₂ feedback from the CEMS. Verify that the loop closes — a measured SO₂ increase triggers a correctable limestone feed increase — within under 5 minutes. Longer response times usually mean either the CEMS analyzer has excessive sample conditioning lag, or the feeder control signal is going through an intermediate logic block that hasn’t been properly configured.
Limestone particle size matters more than most operators realize. A d₅₀ above roughly 300 µm measurably reduces sulfur capture efficiency because the smaller reactive surface area limits calcination and sorbent utilization. If the plant uses on-line particle size analysis, calibrate those instruments against sieve analysis of a grab sample taken during the test. If there’s no on-line analyzer, budget time for manual sieve analysis at the start of each test block and document the incoming sorbent specification against the design basis — it’s not unusual to receive material that’s coarser than contracted, particularly when supply chains tighten seasonally.
Data Analysis, Uncertainty Quantification, and Performance Guarantee Assessment
Once the test window closes and the data loggers stop, the real work starts. Raw numbers from a CFB boiler test are almost never usable as-is — you’ll have instrument spikes from a momentary transmitter glitch, a brief load transient when the operator adjusted bed inventory, or a 20-minute stretch where the limestone feed rate was erratic because a rotary valve stuck. All of that contaminates your averages if you don’t screen first.
Data Averaging and Quality Screening
The standard approach is to run each time-series parameter through a statistical control chart before calculating any averages. Apply the 3-sigma rule: flag any data point that falls more than three standard deviations from the rolling mean of that parameter, then review it manually before deciding to exclude it. Automated exclusion without engineering review is a mistake — sometimes a “spike” in bed temperature is real and tells you something important about fuel quality variation during that interval.
Once outliers are resolved, calculate time-weighted averages across the valid test window for every key parameter: bed temperature, steam flow, feedwater temperature, fuel feed rate, flue gas O₂, CO, and sorbent consumption. The averaging window should cover at least 4–6 hours of genuinely stable operation, longer if load variability was higher than expected.
After averaging, close the energy balance. Input energy from fuel combustion versus output energy in steam, plus all identified losses, should balance to within ±2% — that’s the ASME PTC 4 threshold, and in practice a well-instrumented test on a reasonably stable unit will land inside ±1.5%. If your closure is sitting at ±3% or worse, stop and investigate before proceeding to guarantee comparison. The gap usually points to an unaccounted heat loss, a mis-calibrated fuel flow meter, or moisture content assumptions that don’t match the as-tested fuel.
Uncertainty Analysis per GUM (ISO/IEC Guide 98-3)
Every performance result you report needs an uncertainty budget, and this is where many test reports fall short — they state a thermal efficiency number without any bounds, which makes guarantee comparison almost meaningless.
Identify Type A uncertainties first: these come from the statistical spread of repeated measurements during the test itself, expressed as the standard deviation of the mean. Then catalog Type B uncertainties: instrument calibration certificates (what tolerance did the lab certify that thermocouple or orifice plate to?), sensor resolution limits, and any systematic biases identified during pre-test calibration checks. Combine them using root-sum-of-squares propagation, multiply by a coverage factor of k=2 for a 95% confidence interval, and you have your expanded uncertainty.
For a properly instrumented test, thermal efficiency uncertainty should fall in the range of roughly ±0.5% to ±1.0%, depending primarily on fuel sampling frequency, moisture measurement accuracy, and the quality of the flue gas analyzers. Steam output uncertainty is usually tighter — around ±0.3% to ±0.6% — if you have a calibrated feedwater flow meter as the primary measurement. Emissions uncertainty is more variable and depends heavily on how many traverse points were used and whether the analyzer was zeroed and spanned against certified reference gases during the test.
A CFB boiler performance test without a formal uncertainty budget cannot be used to make or dispute a performance guarantee claim.True
Without quantified uncertainty bounds, it is impossible to determine whether a measured value that falls short of a contractual guarantee represents a genuine deficiency or is within the measurement error of the test itself. ASME PTC 4 and most EPC contracts explicitly require uncertainty reporting for this reason.
Formal Guarantee Assessment and Deficiency Reporting
Comparing raw test results directly against guaranteed values is a common and costly error. Measured values must first be corrected to the guarantee reference conditions defined in the contract — typically a specified fuel LHV, feedwater temperature, ambient air temperature, and steam pressure. The design specification should include correction curves for each variable; if it doesn’t, that’s a contract gap worth addressing before testing begins, not after.
Once corrected values are in hand, structure the comparison in three tiers:
| Guarantee Parameter | Corrected Measured Value | Guaranteed Value | Within Uncertainty? | Status |
|---|---|---|---|---|
| Thermal efficiency (%) | 90.8% ± 0.7% | ≥ 90.0% | Yes | Met |
| Steam output (t/h) | 148.5 ± 0.9 | ≥ 150 | Marginal | Under review |
| SO₂ emissions (mg/Nm³) | 185 ± 22 | ≤ 200 | Yes | Met |
| NOx emissions (mg/Nm³) | 142 ± 18 | ≤ 150 | Marginal | Under review |
“Marginal” cases — where the measured value misses the guarantee but the miss falls within the combined uncertainty of the measurement — are the most contentious. In practice, these situations call for a second shorter test run with improved instrumentation, not an immediate performance bond claim. Jumping straight to financial penalties on a marginal result usually damages the project relationship and rarely holds up if the supplier pushes back with their own uncertainty analysis.
Where a genuine deficiency is confirmed — measured value misses the guarantee outside the uncertainty band — the deficiency report should document: the specific parameter missed, the magnitude of the shortfall corrected to reference conditions, the probable technical cause (where determinable from the test data), and the proposed corrective action or compensation mechanism. Keep this document factual and technically precise. A well-written deficiency report referencing specific test data points and calculation sheets carries weight; a vague complaint letter does not.
Common Deficiencies Found During CFB Boiler Testing and How to Correct Them
Test campaigns on CFB boilers routinely surface the same cluster of problems — not because the technology is unreliable, but because CFB operation involves more interacting variables than a pulverized-coal or stoker unit, and small upsets in fuel sizing, air distribution, or refractory condition compound quickly into measurable performance gaps. What follows is a working troubleshooting reference drawn from the kinds of findings that come up repeatedly during performance guarantee assessments.
High Unburned Carbon Loss (q4)
This is, by a wide margin, the most common reason a CFB boiler fails to hit its efficiency guarantee. Fly ash carbon content above roughly 3–5% (the exact trigger depends on your fuel’s net calorific value and ash-to-carbon ratio) or bed ash carbon above 1% should put you immediately on alert. The efficiency penalty is real and compounding: every percentage point of unburned carbon in fly ash typically represents 0.3–0.6 percentage points of thermal efficiency loss, depending on ash yield and collection split.
Root causes split into four categories. First and most common: fuel particle size out of spec. If your crusher or ring granulator is running with worn liners or a gap that’s drifted, oversized particles drop to the bed, burn partially, and discharge as high-carbon bottom ash before the residence time budget is exhausted. Pull a sieve analysis on the fuel feeding the spreader — if you’re seeing more than 10–15% above the design top size, that’s your culprit. Second: bed temperature running low. Below roughly 850°C, combustion kinetics slow and char burnout becomes incomplete. In practice this often traces back to reduced limestone injection (operators cutting sorbent to save cost) or to fuel with higher moisture than design, which absorbs combustion heat. Third: cyclone separation efficiency has degraded. A worn or refractory-damaged vortex finder is a silent efficiency killer. The vortex finder controls the inner vortex geometry; even a 15–20 mm erosion of the inlet lip measurably increases coarse char bypass to the convective pass. Inspect it at every major outage. Fourth: the primary-to-secondary air split is too high. Excess primary air lifts fine char out of the bed before it burns out. Rebalancing toward more secondary air slows the velocity in the lower furnace and extends char residence time.
Excess Air Above Design Setpoint
Running high excess air — flue gas O₂ at the economizer outlet persistently above the 3–6% design band — is frequently misread as a combustion control issue when it’s actually an air in-leakage problem. The dry flue gas heat loss climbs roughly 0.3–0.5% per percentage point of unnecessary excess O₂, and the induced draft fan draws meaningfully more power pushing the extra gas volume through the system.
Systematic diagnosis means conducting an O₂ traverse at multiple cross-sections: furnace exit, cyclone outlet, economizer inlet, and air preheater outlet. If O₂ jumps between the economizer inlet and the RAPH outlet, you have leakage across the rotary air preheater seals — a classic and underappreciated source on units that have been running two or three years without a seal replacement. If the step occurs earlier, walk the gas path physically. Manhole gasket failures, cracked expansion joints, and even an inspection door left slightly ajar have all caused O₂ deviations that looked like control problems until someone did the traverse properly.
Air in-leakage across a rotary air preheater is a common cause of elevated flue gas oxygen readings that can be mistaken for excess combustion air.True
RAPH seal bypass introduces ambient air directly into the flue gas path downstream of combustion, raising measured O₂ without any actual change in furnace air-fuel ratio. This is well documented in utility boiler practice and is diagnosable by comparing O₂ readings at inlet vs. outlet of the RAPH.
Miscalibrated air flow transmitters are the other trap. If the transmitter reading low primary air causes the control system to compensate by increasing the secondary air damper, total airflow rises even though the operator sees nothing unusual on the HMI. Cross-check transmitter output against a calibrated pitot traverse during the test; discrepancies of 8–12% are not unusual on units that haven’t had flow instruments verified in over a year.
Superheat Temperature Shortfall
A main steam temperature running 10–20°C below design at full load sounds modest but often signals something structural rather than a tuning issue. In a CFB boiler specifically, the diagnosis is more layered than in a pulverized-coal unit because the furnace heat absorption profile is different.
Start by building a temperature profile across the entire convective pass — furnace exit gas temperature, inter-superheater gas temperature, and economizer inlet — using calibrated thermocouples installed at the test ports. If furnace exit gas temperature is already lower than design, the superheater is simply not receiving enough thermal driving force, and adding sootblowing cycles or adjusting spray attemperator flow won’t fix the underlying problem.
Common CFB-specific causes: if bed-to-wall heat transfer is unusually high (which can happen when bed particle size distribution is finer than design or bed inventory is higher than specified), the furnace absorbs more heat and flue gas arrives at the superheater cooler. Elevated fly ash deposition on superheater tubes from high-ash or high-sticky-ash fuels insulates the tube surface and reduces heat transfer coefficient. Reduced flue gas velocity from running high excess air — the same problem discussed above — dilutes the gas and lowers the convective coefficient further. Finally, if the actual fuel’s ash fusion temperature is lower than the design basis, deposits form and bond at temperatures that would be innocuous with the specified coal, and the character of the deposit (sintered versus loose) matters enormously for how aggressively you can clean it.
Work through these in order. The temperature profile traverse gives you the location of the deficiency. The fuel analysis and ash fusion test (run per ASTM D1857 or equivalent) tell you whether you’re dealing with a fuel mismatch. Only after ruling those out should you look at tube fouling management — cleaning frequency, sootblower nozzle condition, and whether the sootblowing medium pressure is actually reaching specification at the lance tip.
Frequently Asked Questions: CFB Boiler Performance Testing and Calibration
How often should a full performance test be conducted on a CFB boiler?
Most O&M contracts and OEM warranties require a full acceptance test at commissioning — this is non-negotiable if performance bonds or liquidated damages clauses are in play. After that, annual full-load performance tests are the standard expectation under both ASME PTC 4 and GB/T 10184 frameworks, and most insurers covering large utility-scale or industrial CFB units will ask to see recent test records during policy renewal.
Interim calibration of critical instruments — flow meters, thermocouples, and CEMS analyzers — should happen every 3 to 6 months, depending on operating hours and fuel abrasiveness. A plant running 24/7 on high-ash coal will drift faster than one doing 6,000 hours a year on consistent fuel. Don’t wait for the annual test to find out your main steam flow meter has drifted 2%.
After major maintenance events, a partial test targeting the affected parameters is strongly recommended, even if the annual test isn’t due. Cyclone refractory repair, air distributor replacement, or any fuel type change can shift combustion behavior enough that the previous test results are no longer representative. Run at least a combustion efficiency check and an emissions sweep before returning to normal operation.
Can you test on biomass or alternative fuels instead of the design coal?
Yes, but the results require correction back to design fuel reference conditions. This is not optional fine print — if you report raw efficiency numbers while burning a biomass blend with 25% moisture against a design coal spec at 10%, the numbers are simply not comparable.
Correction factors come from combustion calculations using the actual versus design fuel properties. When the alternative fuel has significantly different LHV, moisture, or ash behavior (and biomass usually hits all three), apply wider uncertainty margins and be explicit about it in the report. The test report must document the actual fuel analysis side by side with the design specification and fully disclose the correction methodology. Any report that buries this in an appendix should be treated with skepticism.
Manufacturer testing versus independent third-party: which should EPC clients require?
Manufacturer-conducted tests using their own instruments and personnel are useful for internal commissioning checks. For acceptance testing tied to performance bonds or regulatory compliance, require an independent accredited testing organization — TÜV, SGS, Bureau Veritas, or a recognized national metrology institute are the typical choices. The key requirement is ISO/IEC 17025 laboratory accreditation for the testing body.
An independent accredited test body should witness all instrument calibrations, collect fuel samples independently, and issue a signed and sealed test report for formal CFB boiler acceptance testing.True
ISO/IEC 17025 accreditation requires documented witness procedures and independent sample custody chains; this is standard practice for performance guarantee verification under international EPC contracts.
The conflict-of-interest risk with manufacturer-only testing is real. It’s not necessarily bad faith — it’s structural. Their instruments, their personnel, their interpretation. For a contract with six-figure liquidated damages exposure, that’s not an acceptable arrangement.
How do you account for fuel quality variation during a test?
Collect incremental samples at roughly 15-minute intervals throughout the test period, combine into a composite, and send it to an accredited laboratory for full proximate and ultimate analysis plus calorific value determination. This is the only defensible approach.
The test report should state the actual fuel LHV used in every efficiency calculation, and include a sensitivity analysis showing how a ±1% uncertainty in LHV propagates into reported thermal efficiency. On a 93% efficiency claim, that ±1% LHV uncertainty can easily translate to ±0.4 to 0.6 efficiency points — enough to flip a guarantee pass into a borderline fail.
What minimum instrumentation does a valid ASME PTC 4 test actually require?
At minimum: a calibrated main steam flow meter at ±0.5% uncertainty, main steam pressure and temperature transmitters, feedwater flow meter with temperature measurement, a fuel feed gravimetric system at ±1% uncertainty, continuous flue gas O₂ analyzer at the economizer outlet, flue gas temperatures at air preheater inlet and outlet, continuous CO measurement, and defined sampling ports for fly ash and bed ash with a documented sampling procedure.
For CFB-specific analysis — which any serious test should include — add cyclone inlet gas temperature, bed differential pressure readings, and limestone feed rate monitoring. Without bed differential pressure data, you have almost no visibility into whether bed inventory is within the design operating window during the test, and that directly affects both combustion efficiency and SO₂ capture performance. Skipping it is a common shortcut that weakens the whole dataset.
References
Performance Test Codes — Fired Steam Generators, Measurement and Test Uncertainty — ASME
ASME PTC 4 — Fired Steam Generators Performance Test Code — ASME
NIST Policy on Metrological Traceability — National Institute of Standards and Technology (NIST)
Metrological Traceability: Frequently Asked Questions and NIST Policy — National Institute of Standards and Technology (NIST)
Suggested Daily Boiler Log Program — Boiler Performance Monitoring — National Board of Boiler and Pressure Vessel Inspectors
Circulating Fluidized Bed Boilers — CFB Technology and Performance — GE Vernova
Circulating Fluidized Bed Boilers — CFB Boiler Technology — Valmet
Circulating Fluidized Bed Boiler Technology — Mitsubishi Power
Circulating Fluidized Bed Boilers — ANDRITZ
Coal Analysis and Production Information — Thermo Fisher Scientific