
How to Inspect CFB Boiler Tubes, Drums, and High-Wear Components Using NDT Methods?

Unplanned tube failures in a CFB boiler don’t announce themselves politely. Erosion in the lower furnace can strip wall thickness at 0.5–2.5 mm per year depending on bed particle size and fluidizing velocity, and because the wear is uneven — worst at membrane wall corners, cyclone inlet throats, and return leg impact zones — a unit that passed a visual walkdown six months ago can be sitting on a tube that’s down to 60% of nominal wall. When it lets go mid-campaign, you’re looking at an emergency shutdown, refractory demolition, scaffold erection under pressure, and replacement lead times that can push forced outage costs into the hundreds of thousands before you factor in lost generation or steam supply to the process. Systematic NDT inspection — properly scoped, correctly gridded, and timed to planned outages — is what separates a controlled maintenance event from a crisis.
CFB boiler NDT inspection uses ultrasonic thickness testing (UT), magnetic particle testing (MT), radiographic testing (RT), and borescope or visual inspection (VT) to measure remaining wall thickness, detect surface and near-surface cracking, and assess drum and weld integrity. High-wear zones — lower furnace membrane walls below roughly 3 m elevation, cyclone refractory interfaces, and return leg ducts — require UT grid spacing of 25–50 mm. Low-risk upper furnace sections can be surveyed at 100–150 mm spacing. Minimum acceptable remaining wall thickness is typically 70–80% of nominal per ASME PCC-2 and EN 12952-6.
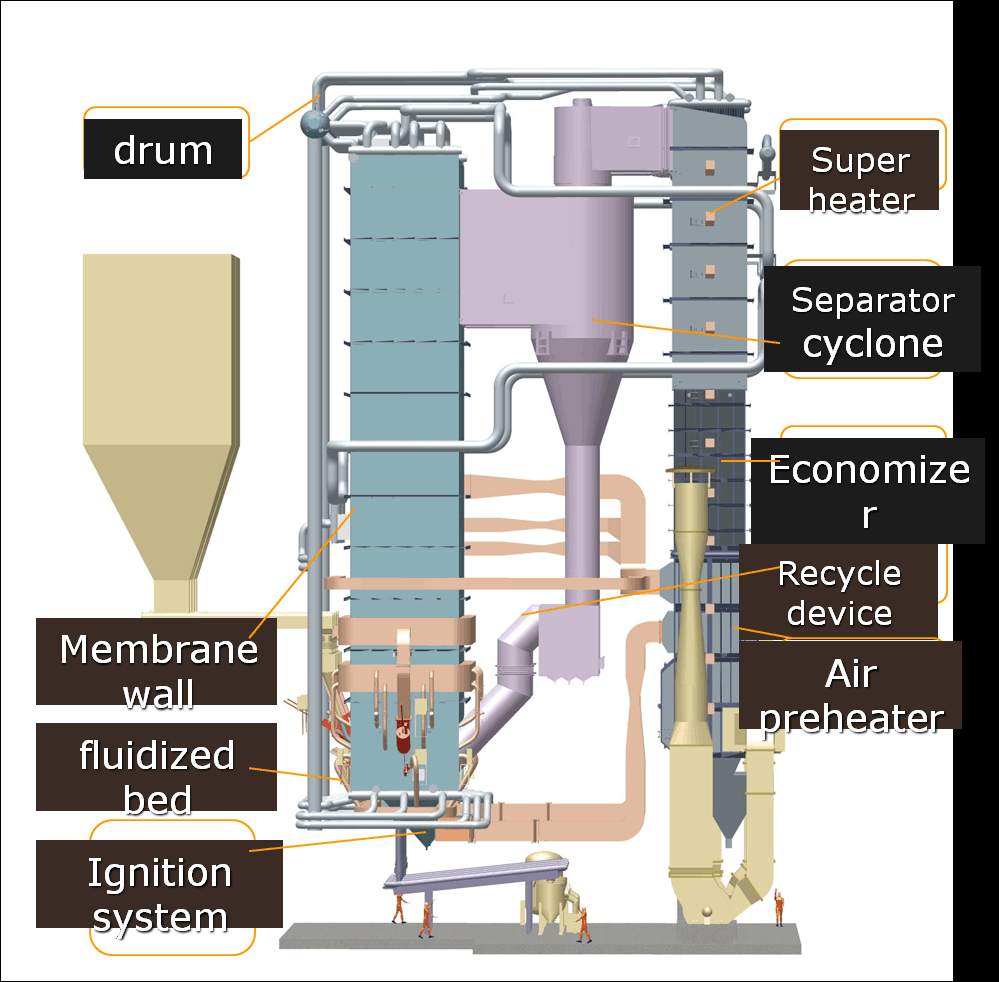
What makes CFB inspection genuinely harder than fire-tube or even pulverized-coal boiler inspection is the combination of abrasive bed material, refractory lining that hides the worst wear zones until you chip it back, and the sheer physical access challenge inside a furnace that might be 6 m wide and 25 m tall with membrane walls you can only reach from scaffold or rope access. The method choices, the grid spacing decisions, the sequence of the inspection campaign — all of it matters more than most procurement specs acknowledge.
Mapping CFB High-Wear Zones Before Scheduling Any NDT Work
Before a single UT probe touches a tube, someone needs to sit down with the plant’s operating data and draw a wear-risk picture of the boiler. Skipping this step is how plants burn through an entire 14-day outage chasing low-risk areas while a critically thin lower furnace panel gets a cursory pass. The mapping work is unglamorous, but it’s where most of the real inspection value gets created or destroyed.
Building a Wear-Risk Heat Map from Operational Data
Pull at least 12–18 months of bed temperature distribution logs and overlay them on an isometric drawing of the furnace. Hot spots — sustained deviations of more than roughly 50–80 °C from the average bed temperature — correlate directly with localized particle velocity anomalies, and those anomalies are what eat tube walls. Layer in the differential pressure trend data across each cyclone leg; a cyclone running at a consistently lower ΔP than its pair is often telling you something about particle loading asymmetry and where the impact energy is actually going.
Plot your historical tube failure records on the same isometric. Even a single tube leak at a specific elevation is worth marking. Three leaks within a 600 mm radius over five years? That’s a Tier 1 zone regardless of what the nominal erosion model says. Limestone feed rate variations matter too — coarser limestone fractions (toward the 0.5 mm end of the 0.1–0.5 mm bed material range) measurably accelerate abrasion, and if your procurement team switched suppliers partway through the data window, note it on the timeline.
The Six Canonical High-Wear Zones
Every CFB has its own personality, but the erosion tends to concentrate in the same structural locations across designs.
The lower furnace membrane wall from grade to roughly 2 m elevation is usually the most aggressive zone, seeing 1.5–2.5 mm/year wall loss depending on fluidizing velocity. Above 6 m/s, the lower end of that range moves up fast. The furnace-to-cyclone transition duct — that abrupt geometry change — generates particle impingement at oblique angles, driving 1.0–2.0 mm/year on the outer radius of the bend. Inside the cyclone, the barrel inner refractory interface tubes erode at 0.8–1.5 mm/year in the zone where refractory has spalled or thinned, exposing bare tube to the particle spiral. The loop seal and J-valve return duct tubes are often overlooked; they sit in a lower-velocity flow but accumulate 0.5–1.2 mm/year because the particle concentration there is extremely high. Up in the upper furnace, superheater platens face a combined corrosion-erosion mechanism, especially on the leading edge of platen bundles, running roughly 0.3–0.8 mm/year — lower rate but higher consequence given the elevated tube metal temperature and pressure. Finally, EHE (external heat exchanger) tube bundle leading edges see 0.5–1.5 mm/year depending on the bed velocity in that fluidized compartment.
Visual Walk-Down Indicators Before NDT Instruments Come Out
A competent walk-down during the first 6–8 hours of an outage, before the unit has fully cooled, can pre-screen half the inspection scope. Refractory spalling patterns at cyclone barrel joints tell you immediately where tube exposure has occurred. Fin weld cracking on membrane panels — look for the characteristic hairline running parallel to the fin — indicates thermal fatigue cycling that typically precedes erosion acceleration. Tube color banding (the blue-to-grey oxidation gradient) at different elevations can indicate where flame impingement or abnormal particle concentration has driven localized overtemperature. Scale and oxide patterns at tube-to-header connections, and any staining around drain or vent plugs, are cheap leading indicators of wall thinning and potential leak initiation.
Risk-Ranking Matrix and NDT Method Assignment
| Zone | Consequence | Likelihood | Tier | Recommended NDT | Frequency |
|---|---|---|---|---|---|
| Lower furnace wall (0–2 m) | High | High | 1 | UT grid (25–50 mm spacing) + TOFD | Every outage |
| Furnace-to-cyclone duct | High | High | 1 | UT scanning + visual | Every outage |
| Cyclone barrel/refractory interface | High | Medium | 1 | UT spot grid + refractory probe | Every outage |
| Loop seal / J-valve return duct | Medium | Medium | 2 | UT sampling (50 mm grid) | Every second outage |
| Superheater platens (upper furnace) | High | Low–Medium | 2 | UT + MFL or eddy current on leading edges | Every second outage |
| EHE tube bundle leading edges | Medium | Medium | 2 | UT spot checks + visual | Every second outage |
| Upper furnace walls (above 6 m) | Low | Low | 3 | Random UT sampling | Periodic / condition-based |
Tier 1 zones should be fully measured every outage, full stop. Using a 25–50 mm UT grid in those areas isn’t over-engineering — it’s the minimum that gives you a reliable wear rate calculation when you compare successive outage data sets. For Tier 3 zones, a 100–150 mm grid on a sample area is usually enough to confirm the assumed low wear rate, or to flag an anomaly worth escalating.
Remaining wall thickness below 70–75% of nominal is generally the threshold triggering mandatory repair or replacement under ASME PCC-2 and EN 12952-6 before returning to service.True
ASME PCC-2 Article 2.1 and EN 12952-6 Section 8 both establish fitness-for-service remaining-thickness criteria in this range, though exact values depend on design pressure, tube OD, and material grade. Always verify against the original design calculations.
How Fuel Switching Invalidates the Existing Wear Map
This is where plants get caught out. A unit that has run on bituminous coal for eight years has a well-characterized wear map. Switch to biomass co-firing at 20–30% by energy input, or transition to processing municipal solid waste in a waste-heat-recovery CFB configuration, and the map can shift substantially within a single operating season. Biomass co-firing changes the bed particle size distribution and typically increases alkali chloride deposition on superheater surfaces, moving the corrosion-erosion balance on those platens. MSW streams introduce chlorine-driven corrosion mechanisms that have almost nothing to do with the original erosion model.
In practice, any significant fuel change — a different coal seam, a new biomass feedstock, or a shift in refuse-derived fuel composition — should trigger an expedited re-baselining inspection within the first 3,000–5,000 operating hours after the change, not at the next scheduled outage. The cost of one additional targeted UT survey is trivial against a tube failure event in a freshly unfamiliar wear environment.
Ultrasonic Thickness Testing of CFB Membrane Walls and Headers
Before you touch a transducer to anything, know what you’re working with. CFB membrane walls and headers are not like conventional fire-tube or even PC-fired boiler pressure parts — the erosion patterns are localized, asymmetric, and in some cases move between outages as bed material distribution shifts. UT thickness testing done without that context produces a pile of numbers that nobody acts on correctly.
Equipment Selection: Don’t Underspecify the Gauge
For routine membrane wall scanning, a digital UT thickness gauge with a live A-scan display is the minimum you should accept on site. The A-scan matters because it lets the technician verify the back-wall echo is clean — critical when magnetite scale or refractory dust is sitting inside the tube. The Olympus 38DL Plus is probably the most common unit you’ll see in the field for this work, though equivalent instruments from GE Inspection or Sonatest work fine provided they offer dual-element mode and A-scan monitoring simultaneously.
Transducer selection depends on tube geometry. For tubes in the 38–76 mm OD range — which covers most CFB waterwall and evaporator circuits — use dual-element (pitch-catch) probes at 5–10 MHz. Dual-element designs reduce near-surface dead zone, which matters when remaining wall is already down to 3–4 mm. If you’re doing inspections on a partially cooled unit (surface temperatures up to roughly 250–300 °C), swap to high-temperature delay-line probes; trying to push a standard contact transducer onto a 200 °C tube surface destroys the wear face and gives you garbage readings.
Header girth welds are a different animal. Manual contact UT can characterize volumetric flaws but will miss tight stress-corrosion cracks at the weld root. For anything above DN150 headers, encoded phased-array UT (PAUT) scanners running a 16- or 32-element linear array are worth the setup time. They generate a full volumetric map of the weld zone in one pass and the encoded position data means you can overlay results from successive outages — which is how you catch slow crack growth before it becomes a forced outage.
Calibration: The Step You Cannot Shortcut
Calibrate on a step-wedge reference block machined from the same material specification as the tube being measured — SA-210 A1 for standard carbon steel waterwalls, SA-213 T11 or T22 for superheater circuits, T91 for high-temperature final superheater applications. Material acoustic velocity varies enough between these grades that using a generic carbon steel block on a T91 tube will introduce a systematic error of roughly 1–2%, which at 6 mm nominal wall means you could be off by 0.1 mm. That sounds trivial until you’re deciding whether a tube is above or below the minimum acceptable thickness threshold.
At elevated tube temperatures, velocity decreases — approximately 0.5–1% per 50 °C rise depending on alloy. Verify your velocity setting against the step-wedge at the actual inspection temperature or apply the correction factor explicitly. For PAUT on header welds, establish a distance-amplitude correction (DAC) curve per ASME Section V Article 4 for the relevant flaw geometries: embedded lack-of-fusion, root cracks, and laminar discontinuities in the heat-affected zone.
Grid Protocol for Membrane Walls
In Tier 1 zones — membrane walls below roughly 3 m elevation, the cyclone inlet duct walls, the lower furnace corners — mark a permanent 50 × 50 mm grid using paint markers or, better, a center-punch dimple at each node. Paint washes off; dimples survive multiple outages and let you return to the exact same measurement point year after year. That repeatability is what makes erosion rate calculation meaningful.
At each node, take three readings: tube crown (12 o’clock), and both flanks at the fin weld toe (approximately 4 and 8 o’clock positions). The flanks are where erosion and corrosion-erosion interaction tends to be worst in CFB units because the turbulent boundary layer is thicker at the crown but the fin weld creates a local flow acceleration at the flank. Record all three; don’t average them away.
Flag any single reading that falls below the minimum acceptable thickness alert — typically 80% of nominal per ASME PCC-2 and EN 12952-6. That threshold isn’t fixed; some jurisdictions and some operators use 75% or even 70% depending on operating pressure and remaining creep life calculations, so confirm with your pressure vessel authority. Any tube at or below the MAT goes into the “confirm and disposition” pile before the unit restarts.
In low-risk zones — upper furnace walls above 8 m, convection pass side walls away from gas impingement — a 100–150 mm grid is defensible, but only after you’ve already done at least one full baseline survey at the tighter spacing.
Reading the C-Scan Map
Encoded PAUT scanners produce thickness C-scan maps that compress a lot of information quickly. Three patterns matter in CFB service:
Erosion channels show up as elongated thin bands running parallel to the predominant flue gas flow direction — usually vertical stripes on the furnace walls. These tell you bed material is impacting in a concentrated jet, often from a misaligned secondary air nozzle or a worn nozzle tip.
Pitting corrosion appears as isolated round thin spots, irregular in plan. In CFB units burning high-sulfur fuels or biomass blends, low-temperature sulfuric acid condensation during start-stop cycling creates this pattern, often concentrated in the economizer or lower air duct region.
General thinning is a broad-area average reduction with no strong gradient — typically uniform erosion across a whole wall panel or header surface. This is what you see when fluidizing velocity has been running consistently above design, perhaps 7–8 m/s where the design was 5–6 m/s.
Dual-element UT probes reduce the near-surface dead zone compared to single-element contact probes, making them preferable for measuring thin remaining walls in eroded CFB tubes.True
Dual-element (pitch-catch) transducers separate the transmit and receive functions, which eliminates the ring-down dead zone inherent in single-element pulse-echo designs. This allows reliable measurement closer to the surface, typically down to 1.5–2 mm remaining wall, which is critical in high-erosion CFB zones where nominal 6–7 mm walls may have eroded to 3–4 mm.
Common UT Pitfalls in CFB Environments
Scale and magnetite oxide layers on the tube ID are probably the most common source of false readings. A 0.5 mm magnetite layer has a significantly higher acoustic impedance than steel; it creates a partial reflection that the gauge may track as the back wall. Dual-element mode helps, but if your A-scan shows a double echo or a suspicious early peak, suspect scale before trusting the reading.
Refractory anchor studs welded onto the OD — common in the lower furnace — physically block scanner travel and force manual spot measurements. Budget extra time in these zones; it’s slow, tedious work. Curved fin geometry at membrane wall fin welds requires custom shoe adaptors to maintain coupling. Off-the-shelf flat-faced probes will rock on the fin radius and introduce coupling variability. Have adaptors made to match your specific fin weld profile before the outage starts, not during it.
Rough grit-blasted surfaces chew through couplant fast. Use a gel couplant rather than oil in these areas — it stays in the asperities longer, and on a vertical surface in a hot environment, oil runs before you can take the reading.
Data Recording Structure
A workable recording table for each measurement point should include: tube ID and panel designation, elevation above furnace floor (meters), angular position (crown / left flank / right flank), nominal wall thickness per drawing, measured thickness, the calculated percentage of nominal remaining, estimated remaining life in years at the current erosion rate (measured thickness minus MAT, divided by erosion rate — simple but effective), and the recommended action: monitor at next outage, apply weld overlay or thermal spray before restart, or remove and replace immediately. Keep the action codes to three levels or people stop using the system properly.
Radiographic and Phased-Array UT Inspection of Drum Welds and Nozzle Connections
The steam drum and mud drum are, without question, the single highest-consequence pressure vessels in any CFB boiler. A tube failure is a maintenance event. A drum failure is a catastrophe. That distinction should drive how you allocate NDT budget and outage time.
Why CFB Drums Age Differently Than You Might Expect
CFB units cycle thermally far more aggressively than pulverized-coal boilers. A typical CFB can ramp from hot standby to full load in roughly 2–4 hours; a comparable PC unit takes 6–8 hours or more. That faster thermal gradient — repeated dozens of times a year in grid-balancing or process-steam applications — drives fatigue crack initiation at the nozzle-to-shell junction radii, at the heat-affected zones of longitudinal seams, and at circumferential welds where residual stress from original fabrication was never fully relieved. High-sulfur coal feedstocks compound this: sulfur-bearing condensate during cooldown can drive hydrogen uptake at weld HAZ regions, which shows up years later as subtle hardness anomalies or, in worse cases, hydrogen-induced cracking.
RT vs. PAUT: Choosing the Right Tool for Drum Geometry
Radiographic testing with Ir-192 or Se-75 sources — and increasingly with digital detector array (DDA) panels replacing film — is still the workhorse for volumetric defect detection in butt welds up to roughly 50 mm wall thickness. DR gives you faster setup, better dynamic range, and eliminates film chemistry, which matters when you’re running a 10-day outage and every hour counts. The problem is the exclusion zone. In a congested boiler house with personnel working nearby scaffolding, holding a radiation perimeter can kill your parallel-tasking schedule. Some plants lose 4–6 hours per shift just managing access.
Phased-array UT combined with time-of-flight diffraction (TOFD) sidesteps that entirely. A 16–64 element linear array running a 45°–70° S-scan sweep, encoded with a magnetic wheel encoder, gives you real-time volumetric coverage and — critically — crack depth sizing that RT simply cannot provide. RT will find a crack; PAUT/TOFD tells you how deep it is. For fitness-for-service decisions under API 579 or ASME PCC-2, depth sizing is not optional. Use RT where access is good and wall geometry is straightforward. Default to PAUT/TOFD in partially accessible boiler houses or wherever you need to characterize rather than just detect.
PAUT with TOFD can detect and size fatigue cracks at drum nozzle-to-shell junctions that RT would miss due to unfavorable crack orientation.True
RT sensitivity to planar flaws (fatigue cracks, SCC) is strongly orientation-dependent; cracks parallel to the radiation beam may produce no detectable image. PAUT S-scan coverage from multiple angles and TOFD's diffraction-tip technique detect planar flaws regardless of orientation, per ASME Section V Article 4 and EN ISO 13588.
Internal Drum Inspection: Sequence and Surface Methods
Before any volumetric work on the outside, you need to get inside. Drain fully, cool to below 40 °C — not 45, not “warm to the touch.” Confined space entry procedure applies without exception: atmospheric test for O₂, CO, combustibles, continuous monitoring while personnel are inside. Pull every internal fitting: feed pipe, steam separators, chemical dosing quills, any baffles. They obstruct access and they mask welds you need to see.
Magnetic particle testing with the yoke technique is the standard for the tube-to-drum socket welds and baffle attachment welds. Apply white contrast paint first — it makes red or black magnetic ink indications jump out under UV or white light and is essentially mandatory in the confined, poorly-lit drum interior. Work systematically around every ligament. Record all indications per EN ISO 17638 or ASME Section V Article 7.
Acceptance criteria matter here and they are not always memorized correctly in the field. Under ASME Section I PW-51, any linear MT indication longer than 1.5 mm is rejectable. For PT on drum internals cross-referenced against ASME BPVC Section VIII Div. 1 Appendix 8: linear indications exceeding 1.6 mm require evaluation, and any relevant rounded indication over 4.8 mm does too. These are not conservative targets — they are the floor.
Nozzle Weld PAUT Setup and Hardness Screening
Nozzle-to-shell welds are geometrically awkward. The weld profile changes along the scan path, and the nozzle itself limits encoder travel. In practice you’ll configure the magnetic wheel encoder to run the curved shell surface and adjust your focal law set to account for the changing sound path as the beam sweeps through the junction radius. A 16-element probe can work; 32 or 64 elements give you better near-surface resolution, which is exactly where fatigue cracks initiate.
After PAUT scanning, run portable Vickers or Leeb hardness testing at the HAZ on both shell and nozzle sides of each weld. Target readings above roughly 350 HV10 in the HAZ of carbon or low-alloy steel drums warrant immediate metallurgical review — that hardness level is consistent with inadequate PWHT or martensite formation, both of which dramatically increase susceptibility to hydrogen-induced cracking. On high-sulfur coal CFB units especially, I’d treat any HAZ above 300 HV as worth flagging and documenting, even if it doesn’t cross the hard rejection threshold.
Keep the hardness data in the inspection record alongside the PAUT scans. When the same drum comes up for inspection three years later, trending matters more than any single data point.
Eddy Current and IRIS Inspection of Superheater, Reheater, and Economizer Tubes
CFB superheater and reheater tubes have a particularly unpleasant failure mode: they’re being attacked from both sides simultaneously. Externally, high-velocity bed carryover and gas-phase sulfidation erode the OD, and in biomass-fired or MSW-cofired CFBs, alkali-chloride compounds deposit on tube surfaces and drive accelerated hot corrosion — chlorine-induced under-deposit attack that can eat through a 4 mm wall in a single campaign if fuel chemistry isn’t managed tightly. Internally, steamside oxide exfoliation from ferritic and martensitic alloy tubes (P22, T91, T92) produces magnetite scale flakes that travel downstream, erode attemperator internals, and eventually score turbine blades. So the inspection challenge isn’t just measuring remaining wall thickness — it’s characterizing both surfaces in a tube that you often can’t reach with a UT probe from the outside, because it’s buried behind refractory, finned, or bundled too tightly for meaningful external grid scanning.
That’s where in-tube techniques earn their place.
IRIS: The High-Resolution Choice When You Have the Outage Time
The Internal Rotary Inspection System uses a rotating mirror to deflect a focused ultrasonic beam radially through a water-filled tube. It gives you full 360° wall thickness coverage at roughly 1–2 mm axial resolution, and it works on tube ODs from about 19 mm up to 76 mm — which covers most superheater, reheater, and economizer configurations you’ll encounter in 50–670 t/h CFB units. Pitting, erosion channels, intergranular attack, and steam-side oxide grooving all show up clearly because you’re resolving both ID and OD surfaces independently.
The practical catch is water. Tubes must be clean and completely water-filled, which means flushing, filling, and purging the circuit before the probe goes in — adding anywhere from half a day to two full days to outage planning depending on circuit volume and the quality of your flushing infrastructure. Debris in the tube (scale flakes, magnetite nodules) will deflect the beam and generate false calls, so a pre-flush with clean water and a verification borescope pass on suspect tubes is worth the time. Tube surface prep is not optional with IRIS; it’s the difference between a clean dataset and a frustrating re-run.
Pulsed Eddy Current for External Scanning Under Insulation or Refractory
Where tubes are insulated, refractory-encased, or simply inaccessible for direct contact, pulsed eddy current (PEC) offers a practical screening option. The technique is non-contact, penetrates up to roughly 40–50 mm of insulation or light refractory, and gives an averaged wall thickness reading over its footprint area — typically 30–50 mm diameter. That averaging is both the strength and the limitation: PEC catches general, distributed thinning well, but a localized pit smaller than the footprint area will be underweighted in the signal. Use it as a triage tool. Where PEC flags a zone showing more than 10–15% average thinning compared to the baseline, strip that section and follow up with contact UT or IRIS. Doing it this way can cut scaffold and lagging removal costs by 30–50% on a large economizer circuit, in my experience — the economics are real.
Conventional ECT and Flexible Probes: Frequency Selection Matters More Than People Admit
For straight tube sections, bobbin-type eddy current probes at 100–500 kHz work well for ferritic P11 and P22 tubes. Austenitic TP347H superheater tubes typically respond better in the 200–500 kHz range. Running both differential and absolute channels simultaneously is standard practice — differential channels are sensitive to abrupt defects like pitting and erosion grooves, while absolute channels track gradual general thinning and thermal fatigue signatures. Signal phasing lets an experienced analyst discriminate between ID pitting (common in lower-temperature economizer tubes with oxygenated feedwater) and OD erosion (dominant in superheater outlet legs facing gas flow).
U-bend regions need flexible probes, not rigid bobbins. Trying to push a rigid bobbin through a tight U-bend in a pendant superheater damages both the probe and the tube end, and you’ll miss the highest-stress portion of the circuit. Flexible probe assemblies for U-bends are an additional cost item that occasionally gets value-engineered out of inspection contracts — don’t let that happen, because U-bends in high-temperature superheaters running T91 are where stress corrosion cracking initiates.
T91 and T92: Don’t Use Standard High-Frequency ECT
This is a common field error. T91 and T92 martensitic steels have variable magnetic permeability depending on local heat treatment history, cold work during bending, and in-service thermal cycling. Standard high-frequency ECT signals become noise-dominated in these materials. The correct approach is either low-frequency remote field ET (RFET), which de-emphasizes permeability variation and responds to wall loss regardless of magnetic state, or phased-array UT angle-beam techniques that bypass the electromagnetic complications entirely. Any inspection contractor proposing standard bobbin ECT on T91 superheater tubes without qualification samples should be questioned.
Standard high-frequency ECT bobbin probes are unreliable for wall-loss detection in T91/T92 martensitic steel tubes due to magnetic permeability variation.True
T91 and T92 contain 9% chromium and have martensitic microstructure with ferromagnetic behavior; local permeability varies with cold work and thermal history, causing lift-off and phase noise that overwhelms standard ECT flaw signals. RFET or PAUT angle-beam are the qualified alternatives per EPRI and industry NDE guidelines.
Coverage Strategy and Trend Tracking
On a first-ever inspection campaign, 10% statistical sampling of each tube bundle pass is a defensible starting point — provided you’re selecting tubes at known high-risk positions (outermost row, gas inlet face, first pass after a flow bend). If that 10% sample returns a defect rate above roughly 5% of the sampled population, expand to 25% minimum; above 10% defect rate, go to 100% on that pass. Document every tube by tube-sheet coordinate, not just by general zone. A trend map built across three consecutive outages will show you which positions are degrading fastest, letting you prioritize repairs before failure rather than after. That coordinate-based documentation is what separates a meaningful inspection program from a box-checking exercise.
Refractory and Wear-Liner Condition Assessment in Cyclones, Loop Seals, and Furnace Lower Zone
The refractory system in a CFB boiler isn’t decorative — it’s the primary erosion shield standing between fast-moving bed particles and your membrane wall tubes. In the lower furnace (typically below 3–4 m elevation), castable refractory and ceramic tile wear liners take the direct abrasive hit so the tubes behind them don’t have to. When that protection degrades, tube wall loss rates don’t creep up gradually; in my experience, fully exposed membrane wall sections in high-velocity zones erode at roughly 3–5 times the rate of protected surfaces. That makes refractory condition a leading indicator of tube failure, not a trailing one. If you’re scheduling NDT and treating the refractory as a secondary concern, you’re reading the instrument panel after the engine is already damaged.
Understanding the Refractory-Tube Interface
The castable refractory is anchored to membrane walls and cyclone shells via stud arrays — typically Y-type or T-type anchors welded at 150–250 mm centers. The castable material (usually 60–80% Al₂O₃ content in high-wear zones) is poured or gunned in place, then cured. Ceramic tiles, where used, are mechanically attached or set in mortar. The weakest point is almost always the interface: thermal cycling causes differential expansion between the steel backing and the refractory mass, which progressively opens the bond. Once delamination starts, hot flue gas and entrained particles migrate behind the liner, and the anchor studs begin eroding. By the time you see anchor stud exposure from the hot face, the damage is already significant.
Visual Inspection and Damage Classification
During any planned outage, systematic visual inspection of cyclone refractory and lower furnace liners should follow a structured damage classification. Based on ASTM C1438-based condition rating practice:
| Grade | Description | Typical Action |
|---|---|---|
| Grade 1 | Surface cracking < 2 mm width, no spalling, hot face intact | Monitor; re-inspect at next outage |
| Grade 2 | Spalling to 20 mm depth, anchor stud exposed, or through-crack | Immediate full-section replacement; UT membrane wall behind affected zone |
Walk the cyclone interior in a defined grid pattern — don’t free-hand it. Mark damage locations on a scaled sketch or photograph overlay. The cyclone inlet duct and the cone transition below the barrel are almost always the worst zones; particle impingement there is aggressive and relentless.
Infrared Thermography During Online Operation
One of the more practical advances for refractory assessment is online IRT — running a thermal camera survey across the cyclone shell and lower furnace exterior while the unit is at load. A FLIR-type uncooled detector with appropriate emissivity correction works adequately for this; you don’t need exotic equipment. The principle is straightforward: intact bonded refractory insulates well, so the steel shell stays relatively cool and uniform. A void, delamination zone, or significant thickness loss lets heat conduct through faster, creating a surface temperature anomaly.
Surface temperature anomalies exceeding 50 °C above the established baseline on the cyclone shell exterior reliably indicate refractory void, delamination, or significant thickness loss requiring investigation.True
This threshold aligns with ISO 18434-1 guidance for thermal anomaly classification in industrial insulation and refractory systems; the temperature differential depends on unit load and ambient conditions, so baseline surveys at consistent operating points are essential for valid comparison.
Document results per ISO 18434-1. The practical value here is go/no-go triage: a cluster of high-delta-T anomalies on a cyclone barrel during normal operation gives you the data to justify an unplanned short outage for patch repair rather than waiting for the next scheduled window — and avoiding what could be a tube failure event. Conversely, a clean IRT survey gives plant management reasonable confidence to defer to the planned outage cycle.
Seasonal variation matters. Cold ambient temperatures in winter create larger apparent temperature differentials on the shell exterior for the same refractory condition. Always note ambient temperature and wind conditions in your IRT report; comparing a January survey to an August survey without that context produces misleading conclusions.
Impact-Echo and Rebound Hammer Checks
For castable refractory that looks visually intact but may have internal delamination, impact-echo and the simple rebound hammer give you a semi-quantitative check without removing material. The technique is low-tech but genuinely useful: tap systematically across the refractory surface with a hammer or calibrated impactor, roughly 1 m² per minute is achievable, and listen and feel for the hollow, dead response that indicates debonding. Solid bonded refractory returns a sharp, hard ring. Delaminated zones sound distinctly hollow — any experienced refractory inspector knows the difference immediately, and you can train plant personnel to screen large areas this way.
Correlate these findings directly with your IRT results. A zone that shows a 60 °C shell anomaly on IRT and hollow response on impact-echo is a confirmed problem area. Either finding alone warrants investigation; both together warrants immediate repair prioritization.
Loop Seal and J-Valve Refractory
The loop seal (J-valve) is the most mechanically abusive location in the entire CFB solids circuit. Dense-phase particle flow through the standpipe and seal return creates particle impact frequency that simply doesn’t exist elsewhere in the unit. Refractory wear here is faster than in the cyclone, and it often gets less inspection attention because access is awkward.
Check aeration nozzle orifice diameters during every outage. A nominal 6 mm orifice that has worn to 10 mm or beyond will disrupt fluidization distribution, create channeling, and accelerate localized erosion on tube surfaces near the seal exit. Replace worn nozzles rather than trying to repair them — they’re consumable components. At the standpipe-to-seal transition geometry, tube erosion is concentrated at the bend entry and exit; this is where you should be doing UT thickness measurements as a matter of routine, not optionally.
Post-Repair Quality Verification
After refractory patch or replacement work, don’t assume the repair is good just because it looks smooth. Check thickness with probe gauges at multiple points — minimum acceptable depth varies by zone but should match the original design specification. For spray-applied liners, a pull-off adhesion test per ISO 4624 confirms bond strength before the unit returns to service; a result below roughly 0.5–1.0 MPa (depending on the liner specification) should trigger rework.
Cure temperature is non-negotiable. Castable refractory needs minimum 110 °C for at least 24 hours before being subjected to operating temperatures — skipping or rushing this step causes steam-pressure spalling during initial heatup, which undoes the repair and occasionally damages the underlying tube surface. Monitor cure with thermocouple loggers, not by estimating furnace heat-soak time. It’s a cheap precaution relative to the cost of redoing the work.
Developing a CFB Boiler Remaining Life Assessment and NDT-Based Maintenance Decision Framework
NDT data without analysis is just numbers in a spreadsheet. The real value of a systematic CFB inspection campaign is what happens afterward — translating measured wall thicknesses, weld indications, and refractory loss data into a defensible decision: run it, monitor it more closely, repair it, or replace it now. That decision framework is what separates a plant that manages its pressure parts from one that reacts to tube failures at 2 a.m.
Applying ASME FFS-1 / API 579-1 to CFB Pressure Parts
Most CFB operators are familiar with ASME Section I for design, but fewer apply the fitness-for-service (FFS) hierarchy from ASME FFS-1 / API 579-1 systematically to inspection data. The three-level structure maps cleanly onto what CFB inspections actually produce.
Level 1 is essentially a screening calculation — compare your minimum measured wall thickness to the MAWP-required minimum using the basic hoop stress formula. If your remaining wall exceeds that floor with adequate margin, the component passes and you document it. Straightforward, takes minutes per data point once you have the measurements.
Level 2 is where CFB membrane walls spend most of their time when erosion is active. Local thin area (LTA) analysis accounts for the fact that a localized thinned patch behaves differently from a uniformly corroded tube — the surrounding material carries load, so you’re not forced into immediate replacement the moment one grid point drops. The LTA rules require characterizing the extent of the thinned region in both the axial and circumferential directions. This is why grid spacing matters: a 100 mm grid will miss a 40 mm diameter erosion pit entirely.
Level 3 is reserved for complex geometries — nozzle-to-drum junctions, for instance, where thermal cycling combined with pressure loading creates a multiaxial stress state that simple shell formulas can’t resolve. At that point you need finite element analysis, and the UT data becomes boundary conditions for the FEA model rather than a pass/fail check on its own.
Remaining Life Calculation: A Worked Example
Take a membrane wall tube: SA-210 A1, OD 60.3 mm, nominal wall 5.6 mm, operating at 4.5 MPa / 350 °C. The MAWP-required minimum wall, calculated per ASME Section I PG-27, comes out to roughly 2.8 mm for this material and condition. Your last outage UT survey found a minimum measured value of 4.1 mm at a lower furnace location, and the previous outage — 18 months prior — recorded 4.9 mm at the same grid point.
Erosion rate: (4.9 − 4.1) / 1.5 years = 0.53 mm/year… but wait. If you only have two data points, check whether the rate is accelerating. In this hypothetical, an earlier reading of 5.3 mm at 36 months back gives a rate of 0.4 mm/year for that earlier interval — so the rate has increased about 30% outage-over-outage. That acceleration flag matters more than the absolute number.
Using the current rate of 0.53 mm/year: remaining life = (4.1 − 2.8) / 0.53 ≈ 2.45 years. Apply a 20% safety margin and you’re scheduling replacement within roughly 24 months — but given the accelerating trend, a practical engineer targets 12–15 months and re-surveys at the next planned outage regardless.
A 30% or greater outage-over-outage increase in erosion rate at a CFB membrane wall location reliably indicates a change in one or more root causes — refractory loss, bed particle coarsening, or fuel ash hardness increase — rather than normal statistical scatter.True
Linear erosion under stable operating conditions produces roughly consistent rates between outages. A step change of this magnitude in a fixed grid point is a recognized diagnostic signal in FFS practice and is consistent with documented CFB operational experience where refractory spalling or fuel quality shifts occurred.
Repair Option Decision Matrix
Once you have the FFS result and the erosion trend, the repair decision comes down to spatial extent and economics.
| Condition | Recommended Action | Expected Life Extension | Approximate Cost |
|---|---|---|---|
| Localized erosion 50% wall remaining | Weld overlay (Inconel 625 or SS309) | 3–5 years depending on overlay thickness and base erosion rate | USD 150–300 per tube meter, varies with access and mobilization |
| Through-wall or > 50% wall loss at discrete location | Tube section replacement | 10–15 year life reset | Depends on tube grade, field vs. shop, access |
| Systematic thinning across > 20% of panel area | Full panel replacement | Full design life | Higher upfront; usually justified vs. repeated repairs |
Weld overlay is attractive for budget reasons but only appropriate where erosion is genuinely localized and the surrounding base metal is sound. Applying overlay to a tube where the adjacent grid points show 40% wall loss is a maintenance habit that tends to produce failures 8 months later, two tube diameters away from the repair.
Operational Levers That NDT Data Can Validate
NDT doesn’t just detect damage — it can confirm whether operational changes are working. Reducing bed inventory particle size from around 0.4 mm down to 0.25 mm has been documented to reduce erosion rates by 15–25% in the high-velocity lower furnace zone, though the actual benefit depends on fuel ash hardness and fluidizing velocity. If you make that adjustment between outages and your next UT survey shows the erosion rate dropping from 0.9 to 0.65 mm/year at the previously worst-performing grid points, that’s quantitative confirmation. Similarly, adjusting the secondary air split to reduce local flue gas velocity near cyclone inlet tubes is a tuning lever that many plants have, but few actually verify with before/after thickness data.
Digital Twin Integration and Documentation
Export the full UT grid dataset — not just the minimums, the entire point cloud — into your plant asset management system (IBM Maximo, SAP PM, or a comparable CMMS). Build a 3D tube wall thickness map that updates each outage, so trending is visual and accessible to maintenance planners who aren’t going to read raw inspection reports. This map also becomes the primary evidence package for regulatory reporting, insurance renewal, and any third-party FFS review. Plants that have done this for three or four consecutive outages typically find that scheduling becomes less reactive; the next repair scope is largely defined before the unit even shuts down.
NDT Inspector Qualification, Safety Protocols, and Outage Planning for CFB Units
Getting the NDT methodology right is only half the problem. The other half is putting qualified people into a safe environment with enough scheduled time to actually execute the plan. These factors collapse more CFB inspection campaigns than any technical shortcoming.
Inspector Qualification — Minimum Acceptable Credentials
For field operations — UT thickness surveys, MT on headers, PT on weld toes, ET on superheater tubes — the baseline is ASNT SNT-TC-1A Level II or ISO 9712 Level II in the specific method being applied. Not Level I supervised by someone in the trailer. The technician performing the measurement and making the accept/reject call in the field needs to hold that certification themselves.
Procedure development and final evaluation of critical welds is a different matter entirely. Drum shell welds, main steam nozzle connections, downcomers — any weld whose failure mode is catastrophic rather than gradual — require a Level III sign-off. In practice, a lot of plants try to skip this by having a Level II write a “generic” procedure and call it done. That’s a compliance gap, and it tends to surface during post-incident audits at the worst possible time.
PAUT operators need specific phased-array qualification beyond a generic UT Level II card. ASME Section V Article 4 Mandatory Appendix VII sets the framework; your procedure qualification should document the specific probe configuration, wedge, focal law setup, and demonstration block used for the geometry at hand. A technician qualified on pipeline girth welds is not automatically qualified to scan drum nozzle-to-shell connections in a congested boiler house. Those are genuinely different scan geometries.
Confined Space Entry — Drum and Furnace
Drum internal inspection is confined space entry, full stop. Complete lockout/tagout of all energy sources before anyone goes in: steam isolation valves blinded or double-blocked, feedwater locked out, fuel and combustion air isolated, ID and FD fan energy dissipated. Atmospheric testing before entry and continuous monitoring throughout — O₂ between 18.5 and 23.5%, LEL below 10%, CO below 25 ppm, H₂S below 1 ppm. A dedicated entry supervisor who does nothing else while personnel are inside, a retrieval system rigged and ready, and a communication line that doesn’t depend on someone shouting through a manway. OSHA 29 CFR 1910.146 is the reference for US operations; most international jurisdictions have near-identical requirements.
Furnace entry after a coal-fired CFB campaign carries an additional CO risk that’s easy to underestimate. Residual bed material can smolder for longer than expected. Don’t rely on time alone to declare the furnace safe.
Radiation Safety for RT Work
Se-75 gamma sources can reduce the radiation exclusion zone compared to Ir-192 for equivalent source activity in tight boiler house geometriesTrue
Se-75 has a lower average gamma energy (~265 keV vs ~340 keV for Ir-192) and lower dose rate at distance for comparable specific activity, allowing a smaller controlled area in congested spaces, though exposure time must be adjusted accordingly.
For Ir-192, expect a controlled area exclusion radius of roughly 30–50 m at the 3 mSv/h boundary — which in a typical boiler house means shutting down a substantial footprint of parallel work. Where that’s impractical, Se-75 is worth evaluating; its lower average energy allows a tighter exclusion zone, though your radiographer needs to recalculate exposure times. Regardless of source, radiation survey the area before releasing personnel, maintain a source accountability log for every exposure, and dose-monitor every person in the vicinity.
A Realistic 14-Day Outage NDT Schedule
This is roughly what a medium-sized CFB — say 130–220 t/h steam capacity — actually requires. Smaller units compress some tasks; anything above 300 t/h typically needs 18–21 days to do this properly.
| Days | Activities |
|---|---|
| 1–2 | Forced cooling, scaffold erection, temporary lighting installation |
| 3–4 | Drum internal inspection: MT on shell welds and nozzle roots, PT on ligaments, UT on shell plates, hardness survey on high-temperature nozzles |
| 5–7 | Membrane wall UT grid survey — Tier 1 zones first (lower furnace below 3 m, cyclone inlet panels) |
| 8–9 | Superheater and reheater IRIS or ECT; economizer spot UT where access permits |
| 10–11 | Cyclone and loop seal refractory assessment; IRT validation if thermal signature data was captured pre-shutdown |
| 12–13 | Report compilation, thickness data trending against previous baseline, engineering review and repair scope definition |
| 14 | Pre-startup hydrostatic test witness, final sign-off |
Days 12 and 13 are consistently underestimated. Compiling hundreds of UT readings into a usable trending map, reconciling against the previous baseline, and getting engineering sign-off on repair scope before scaffolding comes down — that takes real time. Rushing it means you miss the window to do repairs during the same outage.
Pre-Inspection Documentation Package
Assemble this before the outage starts, not during it. You need as-built drawings with a complete weld map, all previous NDT reports with baseline thickness data laid out by zone, repair history including weld overlay coordinates and tube replacement records, and the operating log highlights: number of cold starts since last inspection, any over-temperature events above design, any pressure excursions above 1.1× MAWP. Fuel analysis data for the preceding operating period matters more than most people expect — a shift to higher-sulfur coal or coarser bed material shows up in the erosion rates, and knowing that in advance tells you where to increase grid density.
For new CFB units supplied by Taishan Group across the 35–670 t/h range, factory radiographic records of drum welds, hydrostatic test certificates, and digital weld maps are delivered as part of the documentation package. Field inspection teams on the first planned outage can reference those factory records directly — comparing field UT readings against original nominal wall thickness without having to back-calculate from design drawings. That baseline tends to save a meaningful amount of time during the first major inspection campaign.
Frequently Asked Questions About CFB Boiler NDT Inspection
How often should CFB boiler tubes be inspected with UT thickness testing?
The short answer: it depends on where in the boiler you’re measuring and what the unit has been burning. Tier 1 zones — lower furnace membrane wall below roughly 3 m elevation, cyclone inlet duct, and the loop seal transition — should be measured at every planned outage. For most CFB units running on coal or high-ash biomass, that means every 8,000–12,000 operating hours, usually once a year. If your wall loss rate is coming in near the high end of the 0.5–2.5 mm/year range, annual measurement isn’t aggressive — it’s the minimum that gives you enough data points to extrapolate a remaining life trend with any confidence.
Tier 2 zones (upper furnace walls, secondary superheater headers, economizer inlet headers) can generally be surveyed every second outage without unacceptable risk, provided your Tier 1 data isn’t showing accelerated wear trends that suggest a broader problem.
A full baseline survey at commissioning is non-negotiable — without it, every future measurement is floating in space. The same logic applies after any significant fuel change. Switch from bituminous coal to petroleum coke or high-chloride agricultural residue and your erosion and corrosion maps will shift, sometimes dramatically.
Can tubes be inspected while the unit is running?
Partially. Infrared thermography on the exterior casing can flag refractory hot spots and tube overheating under load — useful as a screening tool between outages, and relatively quick to execute on an operating unit with the right access provisions. Pulsed eddy current works on insulated external piping without removing lagging. Both techniques have real value for trending.
What they cannot replace is contact UT on furnace membrane wall tubes. That requires the unit cold, scaffolding erected, and the tube surface cleaned back to bare metal — scale, refractory coating, and surface oxidation all degrade the coupling and introduce noise that is easy to misread. Full tube inspection is an outage activity. Anyone selling you otherwise is either talking about a different component or oversimplifying the physics.
What is the most common cause of CFB boiler tube failure?
Erosion thinning from recirculating bed material. Across most operational data, it accounts for somewhere around 60–70% of unplanned tube failures in CFB units, the rest being split between weld defects, overheating, thermal fatigue at transition points, and corrosion. The particle-laden gas stream at 4–8 m/s fluidizing velocity is continuously abrading tube surfaces, and the attack is concentrated and repeatable — same locations fail, outage after outage, if the refractory and wear liners aren’t maintained properly.
Systematic UT surveys detect thinning at 20–30% wall loss, well before the failure threshold. That gives you scheduled replacement during a planned window instead of an emergency tube repair at 2 a.m. with the unit offline and production stopped.
How does NDT strategy differ for biomass or MSW-fired CFB boilers?
Significantly. Biomass and municipal solid waste fuels introduce chloride chemistry that coal-fired units largely don’t see. HCl and alkali chlorides at 450–550 °C attack the superheater and reheater tubes through a completely different mechanism — high-temperature corrosion that preferentially attacks external tube surfaces, not the erosion-driven internal thinning pattern that dominates coal CFB units.
Biomass and MSW-fired CFB boilers experience higher rates of superheater external corrosion than equivalent coal-fired CFB units due to alkali chloride chemistry.True
Alkali chlorides (KCl, NaCl) deposit on superheater tube surfaces and react with the oxide layer at temperatures above roughly 450 °C, forming low-melting-point eutectic compounds that accelerate corrosion. This is well-documented in published CFB operational data and corrosion research and is not a general statement about all biomass boilers — it is specifically the chloride content that drives the mechanism.
The inspection emphasis shifts toward PAUT and conventional UT on superheater tube externals for corrosion characterization, rather than the erosion-focused membrane wall survey that dominates coal CFB NDT campaigns. Dew-point corrosion in the economizer and air preheater is also more severe with high-chloride fuels. The NDT plan needs to reflect that.
What wall thickness is acceptable before a tube must be replaced?
The calculation basis is ASME BPVC Section I pressure-design minimum thickness, which depends on operating pressure, tube OD, material allowable stress, and weld joint efficiency — not a single universal number. As a practical field rule for Tier 1 zones, tubes at or below roughly 70–75% of nominal wall should be flagged for replacement planning at the next scheduled outage. At or below 60% nominal, or showing visible pitting craters or channeling wear, the tube should not go back into service without engineering review and likely immediate repair.
Don’t average the grid readings — minimum point measurement governs. A tube with a 1.5 mm pit bottom reading at a 25 mm grid point can fail even if the surrounding measurements look acceptable.
What NDT documentation does Taishan Group provide with exported CFB boilers?
Taishan Group supplies complete mill certificates, radiographic film or digital RT records for all drum and header pressure welds, hydrostatic test certificates, and weld maps covering CFB units in its export range (35–670 t/h, coal, biomass, and waste-heat-recovery configurations). This documentation package forms the NDT baseline for the entire lifetime inspection program — every future UT survey references back to the as-built wall thickness from mill certification. The records are structured to support third-party certification by TÜV, Bureau Veritas, Lloyd’s Register, and similar inspection bodies operating in the destination country.
What is the practical difference between PAUT and conventional UT for drum weld inspection?
Conventional single-element UT fires a fixed-angle beam. To get full volumetric weld coverage, the operator walks multiple probes across multiple positions and assembles the picture manually. It works, but it’s slow, coverage depends heavily on operator skill, and defect sizing accuracy on complex geometries is limited.
PAUT electronically steers and focuses an array of elements, sweeping through a range of angles simultaneously — the S-scan — and displaying a real-time 2D cross-section of the weld volume in one pass. Defect position and sizing accuracy are substantially better, and encoded position data means the scan can be repeated at the next outage with the probe path exactly matched, which is the only way to reliably trend crack growth over time.
For CFB drum circumferential welds and nozzle-to-shell connections, where fatigue cracking and stress corrosion are the failure modes that matter most, PAUT is the correct tool. The equipment cost is higher and the operator qualification requirements are more demanding, but on a component where a missed crack means a catastrophic pressure failure, that is not where to economize.
References
- BPVC Section V — Nondestructive Examination — ASME
- BPVC Section VII — Recommended Guidelines for the Care of Power Boilers — ASME
- National Board Inspection Code — Inspection, Repairs and Alterations — National Board of Boiler and Pressure Vessel Inspectors
- Boiler Logs Can Reduce Accidents — Inspection and Maintenance Records — National Board of Boiler and Pressure Vessel Inspectors
- Non-Destructive Examination — Liquid Penetrant and Magnetic Particle Inspection — TWI Global
- Magnetic Particle Inspection in Non-Destructive Examination — TWI Global
- NDT Overview: An Introduction to Phased Array Ultrasonic Testing — American Society for Nondestructive Testing (ASNT)
- CFB Boiler — Circulating Fluidized Bed Technology and Components — Valmet
- NIST Policy on Metrological Traceability — Measurement Calibration — National Institute of Standards and Technology (NIST)
- PowerFluid Circulating Fluidized Bed Boilers — ANDRITZ
How to Inspect CFB Boiler Tubes, Drums, and High-Wear Components Using NDT Methods? Read More »