Investing in a Circulating Fluidized Bed (CFB) boiler is a strategic decision involving significant capital expenditure, and cost uncertainty is one of the biggest concerns for project owners. Prices can vary widely depending on capacity, fuel type, pressure level, and configuration. Without a clear understanding of cost ranges, buyers risk overpaying or selecting an unsuitable boiler design that increases long-term operating costs.
The cost of CFB boilers typically ranges from USD 1.2 million to over USD 100 million, depending on boiler type and scale. Small industrial CFB boilers (10–35 t/h) generally cost USD 1.2–5 million, medium-capacity units (35–130 t/h) range from USD 5–25 million, while large power plant CFB boilers (200–1,000+ t/h) can exceed USD 30–100 million. Factors such as fuel flexibility, emission control systems, automation level, and EPC scope significantly influence the final price.
Understanding these cost ranges helps investors budget accurately, compare technologies, and optimize lifecycle economics.
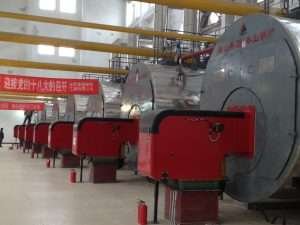
What Is the Cost Range of Small Industrial CFB Boilers for Process Steam?
For many manufacturers seeking fuel flexibility, emission compliance, and stable long-term operating costs, small industrial CFB (Circulating Fluidized Bed) boilers have become an attractive solution for process steam generation. However, uncertainty around capital cost is often the first barrier in feasibility discussions. Unlike gas or oil boilers with relatively standardized pricing, CFB boiler costs vary widely depending on design pressure, fuel characteristics, automation level, and environmental requirements. Understanding the realistic cost range—and what drives it—is essential to avoid underbudgeting and to evaluate true lifecycle value rather than headline price alone.
The cost range of small industrial CFB boilers for process steam typically falls between USD 500,000 and USD 6 million, or approximately USD 600–1,500 per kWth installed. Smaller units (5–10 t/h steam) generally cost USD 0.5–1.5 million, while mid-sized small industrial units (15–35 t/h steam) range from USD 2–6 million, depending on pressure level, fuel flexibility, emission controls, and automation scope.
This wide range reflects not only boiler size, but also how “complete” the supply scope is—bare boiler island versus a fully engineered turnkey system.
Small industrial CFB boilers are significantly more expensive than all other boiler types at the same capacity.False
While CFB boilers have higher upfront costs than gas boilers, their fuel flexibility and lower lifecycle costs often justify the investment.
CFB boiler cost is strongly influenced by fuel type, pressure, and emission requirements.True
Design complexity and compliance scope are the dominant cost drivers.
1. Typical Capacity Range for Small Industrial CFB Boilers
In industrial practice, “small” CFB boilers are generally defined by steam capacity rather than thermal input.
| Steam Capacity | Thermal Capacity (Approx.) | Typical Applications |
|---|---|---|
| 5–10 t/h | 3–7 MWth | Food, textile, small chemical plants |
| 10–20 t/h | 7–14 MWth | Paper, biomass processing |
| 20–35 t/h | 14–25 MWth | Industrial parks, CHP-ready plants |
Most small industrial CFB boilers operate below 25 MWth.True
This range balances fuel flexibility with manageable capital investment.
2. Capital Cost Range by Steam Capacity
| Steam Capacity | Typical Cost Range (USD) | Cost per kWth (USD/kW) |
|---|---|---|
| 5–10 t/h | 0.5–1.5 million | 900–1,500 |
| 10–20 t/h | 1.5–3.5 million | 700–1,200 |
| 20–35 t/h | 3–6 million | 600–1,000 |
Unit cost decreases as CFB boiler capacity increases.True
Economies of scale significantly reduce cost per kWth.
Smaller CFB boilers carry a higher unit cost due to cyclones, refractory, and control systems that do not scale down linearly.
3. Influence of Steam Pressure and Temperature
Steam parameters directly affect material selection and pressure part design.
| Steam Pressure | Typical Impact on Cost |
|---|---|
| ≤10 bar | Baseline |
| 10–25 bar | +10–25% |
| 25–45 bar | +25–40% |
Higher steam pressure increases CFB boiler cost due to thicker pressure parts and higher-grade materials.True
Mechanical design requirements escalate rapidly with pressure.
For most process steam applications, 10–25 bar saturated steam offers the best balance between cost and utility.
4. Fuel Flexibility and Its Cost Impact
One of the defining advantages of CFB boilers is multi-fuel capability.
| Fuel Design Scope | CAPEX Impact |
|---|---|
| Single fuel (coal or biomass) | Baseline |
| Dual fuel (coal + biomass) | +10–15% |
| Multi-fuel (coal, biomass, petcoke, RDF) | +15–30% |
Fuel flexibility increases initial cost but reduces long-term economic risk.True
Multi-fuel capability protects against fuel price volatility.
Designing for low-grade, high-moisture fuels requires a larger furnace and more robust feeding systems, increasing cost but improving lifecycle resilience.
5. Emission Control Systems and Compliance Costs
Environmental compliance is a major cost component for CFB boilers.
| Emission Requirement | Typical Additional Cost |
|---|---|
| Basic cyclone + bag filter | Included / low |
| Limestone injection (SO₂ control) | +5–10% |
| SNCR (NOx control) | +5–8% |
| Advanced monitoring & CEMS | +3–6% |
CFB boilers often achieve lower emission compliance cost than pulverized coal boilers.True
Lower combustion temperature enables in-furnace emission control.
In many regions, CFB boilers meet stringent limits without expensive FGD or SCR systems.
6. Automation Level and Scope of Supply
| Supply Scope | Cost Effect |
|---|---|
| Boiler island only | Lowest |
| Boiler + auxiliaries | +15–25% |
| Turnkey EPC system | +30–50% |
Turnkey CFB boiler projects have higher upfront cost but lower execution risk.True
Integrated supply reduces interface and commissioning risk.
Automation significantly reduces long-term O&M cost, especially for solid-fuel systems.
7. Comparison with Other Boiler Types (Same Capacity)
| Boiler Type | Typical CAPEX Index |
|---|---|
| Gas boiler | 1.0 |
| Biomass grate boiler | 1.3–1.6 |
| Small CFB boiler | 1.6–2.2 |
| Pulverized coal boiler | 2.0–2.5 |
CFB boilers cost more upfront than gas boilers but offer superior fuel flexibility.True
Higher capital cost is offset by fuel and compliance advantages.
8. Lifecycle Cost Perspective
While CFB boilers have higher CAPEX, fuel savings and emission advantages often dominate long-term economics.
| Cost Category (20-Year Basis) | Gas Boiler | Small CFB Boiler |
|---|---|---|
| Fuel cost | High | Low–Medium |
| O&M cost | Low | Medium |
| Carbon exposure | High | Low |
| Total lifecycle cost | High | Lower |
Lifecycle economics often favor CFB boilers despite higher initial cost.True
Fuel flexibility and lower carbon exposure improve long-term value.
9. Example Cost Scenario (15 t/h Process Steam CFB Boiler)
| Item | Value |
|---|---|
| Steam capacity | 15 t/h |
| Pressure | 16 bar |
| Fuel | Biomass + coal |
| Total CAPEX | USD 2.6 million |
| Cost per kWth | ~850 USD/kW |
| Typical payback | 4–6 years |
Mid-size small industrial CFB boilers often achieve payback within 5 years.True
Fuel cost savings offset higher capital investment.
How Much Do Medium-Capacity CFB Boilers for Cogeneration Typically Cost?
As industries and utilities seek to decarbonize while maintaining energy security, medium-capacity CFB (Circulating Fluidized Bed) boilers for cogeneration (CHP) have emerged as a strategic solution. These systems simultaneously produce electricity and process steam or district heat, significantly improving fuel utilization efficiency. However, the financial scale of CHP-grade CFB boilers is substantially higher than simple steam-only installations, leading many investors to underestimate total project cost during early feasibility stages. Understanding the realistic cost range—and the technical factors behind it—is essential for accurate budgeting, risk control, and long-term economic optimization.
Medium-capacity CFB boilers for cogeneration typically cost between USD 15 million and USD 60 million, corresponding to approximately USD 1,200–2,500 per kWe installed (or USD 700–1,400 per kWth on a thermal basis). Smaller CHP units in the 20–40 MWe range generally cost USD 15–30 million, while larger medium-capacity systems of 40–100 MWe commonly fall between USD 30–60 million, depending on steam parameters, fuel flexibility, emission controls, and EPC scope.
This wide range reflects not only capacity differences, but also how aggressively the system is designed for efficiency, fuel diversity, and long-term environmental compliance.
Medium-capacity CFB boilers for cogeneration have relatively standardized costs across projects.False
Costs vary widely depending on steam conditions, fuel design, environmental scope, and project execution model.
CFB boiler CHP costs are strongly influenced by electrical output and emission requirements.True
Higher steam parameters and stricter compliance significantly increase system complexity and cost.
1. What Is Considered a Medium-Capacity CFB Boiler for CHP?
In cogeneration applications, “medium-capacity” is usually defined by electrical output, not just boiler size.
| CHP Electrical Output | Thermal Input (Approx.) | Typical Applications |
|---|---|---|
| 20–30 MWe | 80–120 MWth | Industrial CHP, pulp & paper |
| 30–50 MWe | 120–200 MWth | District heating, industrial parks |
| 50–100 MWe | 200–350 MWth | Utility-scale CHP, city heating |
Most medium-capacity CFB CHP projects fall below 100 MWe.True
Above this range, projects are generally classified as large utility-scale plants.
2. Typical Capital Cost Range by CHP Capacity
| Electrical Output (MWe) | Typical Total Project Cost (USD) | Cost per kWe (USD/kWe) |
|---|---|---|
| 20–30 | 15–25 million | 1,200–2,000 |
| 30–50 | 25–40 million | 1,300–2,200 |
| 50–100 | 40–60 million | 1,500–2,500 |
Unit cost per kWe increases with higher efficiency and stricter compliance requirements.True
Advanced steam conditions and emission systems add disproportionately to capital cost.
Compared with simple power-only plants, CHP systems include additional heat recovery, distribution, and control infrastructure, increasing total investment but improving overall efficiency.
3. Influence of Steam Parameters on Cost
Cogeneration requires higher steam pressure and temperature than process steam boilers to achieve competitive power generation efficiency.
| Steam Condition | Typical CHP Application | Cost Impact |
|---|---|---|
| 65–90 bar / 480–510°C | Entry-level CHP | Baseline |
| 90–130 bar / 520–540°C | High-efficiency CHP | +15–30% |
| >130 bar / >540°C | Advanced CHP | +30–45% |
Higher steam parameters significantly increase CFB CHP project cost.True
Thicker pressure parts and alloy steels are required for high-temperature operation.
Medium-capacity CFB CHP projects typically target 90–130 bar as an economic optimum.
4. Fuel Flexibility and Its Cost Implications
One of the main advantages of CFB technology is its ability to burn low-grade and mixed fuels.
| Fuel Design Scope | CAPEX Impact |
|---|---|
| Single fuel (coal or biomass) | Baseline |
| Dual fuel (coal + biomass) | +10–15% |
| Multi-fuel (biomass, coal, petcoke, RDF) | +15–25% |
Fuel flexibility increases upfront cost but reduces long-term financial risk.True
Multi-fuel capability protects against fuel price volatility and supply disruption.
For CHP projects with 20–30 year horizons, fuel flexibility is often a financial necessity rather than a luxury.
5. Emission Control Systems and Environmental Scope
Environmental compliance represents a substantial portion of CFB CHP project cost.
| Emission Control Component | Typical Cost Share |
|---|---|
| Fabric filter / ESP | 5–8% |
| Limestone injection (SO₂) | 5–10% |
| SNCR (NOx) | 4–6% |
| Continuous emission monitoring | 2–4% |
CFB technology reduces the need for expensive post-combustion emission controls.True
Lower combustion temperatures enable in-furnace SO₂ and NOx control.
Compared with pulverized coal plants, CFB CHP projects often avoid full-scale FGD or SCR, containing costs.
6. Balance of Plant and CHP-Specific Costs
In CHP applications, the boiler itself typically represents only 35–45% of total project cost.
| Major Cost Block | Share of Total CAPEX (%) |
|---|---|
| CFB boiler & cyclones | 35–45 |
| Steam turbine & generator | 20–30 |
| Heat recovery & district heating | 10–15 |
| Fuel handling & storage | 8–12 |
| Electrical & I&C systems | 5–10 |
In CHP projects, non-boiler equipment dominates total capital cost.True
Power generation and heat recovery systems add significant investment beyond the boiler island.
This is why CHP project costs scale faster than steam-only CFB installations.
7. Comparison with Other CHP Boiler Technologies
| Technology | Typical CAPEX Index |
|---|---|
| Gas turbine CHP | 1.0 |
| Biomass grate boiler CHP | 1.3–1.6 |
| Medium-capacity CFB CHP | 1.6–2.2 |
| Pulverized coal CHP | 2.0–2.5 |
CFB CHP systems cost more than gas CHP but offer superior fuel flexibility.True
Higher CAPEX is offset by lower fuel and carbon exposure.
In regions with volatile gas prices or carbon constraints, CFB CHP often delivers lower lifecycle cost.
8. Lifecycle Economics Context
| Cost Aspect (25-Year Basis) | Gas CHP | CFB CHP |
|---|---|---|
| Fuel cost volatility | High | Low |
| Carbon exposure | High | Low–Medium |
| O&M cost | Low | Medium |
| Total lifecycle cost | High | Lower |
Despite higher upfront cost, CFB CHP systems often outperform gas CHP over long lifecycles.True
Fuel flexibility and carbon resilience improve long-term economics.
9. Example Cost Scenario: 40 MWe CFB CHP Plant
| Parameter | Value |
|---|---|
| Electrical output | 40 MWe |
| Thermal input | ~160 MWth |
| Fuel | Biomass + coal |
| Steam parameters | 110 bar / 535°C |
| Total CAPEX | USD 32 million |
| Cost per kWe | ~1,800 USD/kWe |
| Typical payback | 5–7 years |
Medium-capacity CFB CHP projects commonly achieve payback within 6–8 years.True
High utilization and fuel savings offset capital investment.
10. Factors That Push Costs Toward the Upper End
Costs tend to rise when projects include:
- Very high steam temperatures
- 100% biomass firing with difficult fuels
- Urban location with strict emission limits
- Fully turnkey EPC scope
Conversely, brownfield integration and moderate steam conditions can significantly reduce CAPEX.
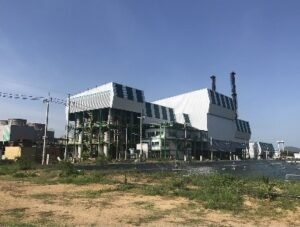
What Is the Investment Cost of Large Power Plant CFB Boilers?

For utilities and independent power producers, large power plant CFB (Circulating Fluidized Bed) boilers represent one of the most capital-intensive investments in thermal generation. These projects are not simply about installing a boiler; they involve the creation of a long-life energy asset expected to operate continuously for 30–40 years under tightening environmental regulations and volatile fuel markets. Misjudging the true investment cost—by focusing only on boiler island pricing rather than full plant scope—often leads to budget overruns and unrealistic return expectations. Understanding the realistic investment range and its technical drivers is therefore critical at the planning and financing stage.
The investment cost of large power plant CFB boilers typically ranges from USD 1,600 to 3,200 per kWe installed, or approximately USD 2,000–6,000 per kWth on a thermal basis. In absolute terms, large CFB power plants (300–600 MWe) usually require total capital investments of USD 600 million to over USD 1.8 billion, depending on unit size, steam parameters, fuel flexibility, emission standards, and EPC scope.
This wide range reflects not only capacity differences, but also how aggressively the plant is designed for efficiency, environmental compliance, and future fuel adaptability.
Large CFB power plants have relatively fixed and predictable investment costs.False
Capital cost varies widely with steam conditions, fuel scope, site conditions, and environmental requirements.
Steam parameters and environmental compliance are the dominant cost drivers for large CFB boilers.True
Higher efficiency and stricter regulations significantly increase material and system complexity.
1. What Is Considered a Large Power Plant CFB Boiler?
In utility-scale applications, “large” CFB boilers are typically defined by electrical output and steam conditions, not just furnace size.
| Unit Capacity | Thermal Input (Approx.) | Typical Application |
|---|---|---|
| 150–250 MWe | 600–900 MWth | Regional utility power |
| 250–350 MWe | 900–1,200 MWth | National grid baseload |
| 350–600 MWe | 1,200–2,000 MWth | Ultra-large utility plants |
CFB units above 300 MWe are considered large-scale utility assets.True
These units require advanced materials and complex balance-of-plant systems.
Large CFB boilers increasingly compete directly with supercritical pulverized coal units.
2. Typical Investment Cost by Unit Capacity
| Electrical Capacity | Total Project Investment (USD) | Cost per kWe (USD/kWe) |
|---|---|---|
| 150–250 MWe | 600–900 million | 2,200–3,200 |
| 250–350 MWe | 700–1,100 million | 2,000–3,000 |
| 350–600 MWe | 900–1,800+ million | 1,600–2,600 |
Cost per kWe decreases as CFB unit size increases.True
Economies of scale significantly reduce unit investment cost.
However, this trend can reverse if ultra-high efficiency or strict urban emission standards are imposed.
3. Impact of Steam Parameters and Technology Level
Modern large CFB boilers operate at supercritical or ultra-supercritical steam conditions to improve efficiency.
| Steam Technology | Typical Parameters | Cost Impact |
|---|---|---|
| Subcritical | 170 bar / 540°C | Baseline |
| Supercritical | 250 bar / 560°C | +15–25% |
| Ultra-supercritical | >280 bar / >600°C | +30–45% |
Ultra-supercritical CFB boilers require high-alloy steels that significantly increase cost.True
Material strength and corrosion resistance requirements rise sharply with temperature.
Most new large CFB projects target supercritical conditions as the best balance of cost and efficiency.
4. Fuel Flexibility and Design Complexity
Fuel adaptability is a defining advantage of CFB technology at large scale.
| Fuel Design Scope | Investment Impact |
|---|---|
| Single fuel coal | Baseline |
| Coal + biomass co-firing | +8–15% |
| Multi-fuel (coal, petcoke, biomass, waste) | +15–25% |
Fuel flexibility increases upfront investment but reduces long-term economic risk.True
Multi-fuel capability protects against fuel supply disruption and price volatility.
Large furnaces, robust feeding systems, and advanced bed material management add to capital cost.
5. Environmental Compliance and Emission Control Cost
Environmental systems represent a major share of total investment in large CFB plants.
| Emission Control System | Share of Total CAPEX (%) |
|---|---|
| Fabric filter / ESP | 5–8 |
| Limestone injection (SO₂) | 6–10 |
| SNCR or hybrid SCR | 5–10 |
| Continuous monitoring | 2–4 |
CFB boilers achieve SO₂ and NOx control more economically than PC boilers.True
Lower combustion temperature enables in-furnace emission reduction.
Compared with pulverized coal plants, large CFB units often avoid full wet FGD systems, saving capital.
6. Boiler Island vs Total Plant Cost Structure
The boiler itself is only part of the investment.
| Cost Component | Typical Share (%) |
|---|---|
| CFB boiler & cyclones | 30–40 |
| Steam turbine & generator | 20–25 |
| Environmental systems | 15–20 |
| Fuel handling & ash systems | 8–12 |
| Electrical, I&C, civil works | 10–15 |
The boiler island represents less than half of total plant investment.True
Balance-of-plant systems dominate large power plant costs.
This is why “boiler price” alone is misleading when budgeting large projects.
7. Comparison with Other Large-Scale Power Technologies
| Technology | CAPEX Index |
|---|---|
| Gas combined cycle | 1.0 |
| Supercritical PC boiler | 1.8–2.2 |
| Large CFB boiler | 1.9–2.4 |
| Ultra-supercritical PC | 2.2–2.6 |
Large CFB boilers are cost-competitive with advanced pulverized coal plants.True
Lower fuel and emission compliance costs improve overall competitiveness.
CFB technology offers superior fuel flexibility at similar investment levels.
8. Lifecycle Cost and Value Perspective
| Cost Aspect (30-Year Horizon) | PC Boiler | Large CFB Boiler |
|---|---|---|
| Fuel flexibility | Low | Very high |
| Emission compliance cost | High | Lower |
| Carbon risk | High | Lower |
| Total lifecycle cost | High | Lower |
Lifecycle economics often favor large CFB boilers over conventional coal plants.True
Fuel and compliance savings accumulate over decades.
Higher initial investment is often offset within the first half of plant life.
9. Example Investment Scenario: 600 MWe Supercritical CFB Plant
| Parameter | Value |
|---|---|
| Electrical capacity | 600 MWe |
| Steam parameters | 260 bar / 565°C |
| Fuel | Coal + 15% biomass |
| Total investment | USD 1.4 billion |
| Cost per kWe | ~2,330 USD/kWe |
| Design life | 35 years |
Large supercritical CFB plants commonly exceed USD 1 billion in total investment.True
Scale, materials, and environmental systems drive capital intensity.
10. Factors That Push Investment Toward the Upper End
Investment cost increases significantly when projects involve:
- Ultra-supercritical steam conditions
- High biomass or waste co-firing ratios
- Urban or environmentally sensitive locations
- Full EPC + long-term service agreements
Conversely, mine-mouth locations, standardized designs, and moderate steam parameters can materially reduce investment.
The investment cost of large power plant CFB boilers typically ranges from USD 600 million to over USD 1.8 billion, or USD 1,600–3,200 per kWe, depending on capacity, steam technology, fuel flexibility, and environmental scope. While capital-intensive, large CFB boilers deliver exceptional long-term value through fuel adaptability, robust emission performance, and reduced regulatory risk, making them one of the most future-proof options for large-scale thermal power generation in a carbon-constrained world.
How Do Fuel Type and Fuel Flexibility Affect CFB Boiler Pricing?
For investors, engineers, and plant owners evaluating CFB (Circulating Fluidized Bed) boilers, fuel considerations are among the most misunderstood cost drivers. Many projects underestimate how profoundly fuel type and fuel flexibility influence boiler pricing, not only at the quotation stage but across the entire design and execution process. While CFB technology is renowned for its ability to burn low-grade and mixed fuels, this versatility is not free. Each additional fuel characteristic—higher moisture, wider ash variation, corrosive elements, or variable particle size—drives tangible increases in furnace size, material specification, auxiliary systems, and automation complexity. Understanding these relationships is essential for making rational investment decisions and avoiding cost overruns disguised as “unexpected design changes.”
Fuel type and fuel flexibility directly affect CFB boiler pricing by increasing furnace volume, heat transfer surface, fuel feeding systems, material grades, and control complexity. Compared with a single-design coal-fired CFB boiler, a multi-fuel CFB system designed for biomass, petcoke, or waste-derived fuels typically costs 10–30% more in capital expenditure, while extreme fuel flexibility (high-moisture biomass, RDF, sludge) can push pricing 35–50% higher due to larger combustion chambers, corrosion-resistant alloys, and reinforced environmental systems.
This cost premium is not arbitrary; it reflects fundamental thermodynamic, mechanical, and operational realities inherent to flexible combustion design.
Fuel flexibility in CFB boilers has little impact on capital cost.False
Fuel flexibility significantly increases furnace size, system complexity, and material requirements.
Fuel characteristics are one of the most important pricing drivers for CFB boilers.True
Fuel properties directly influence boiler dimensions, materials, and auxiliary systems.
1. Why Fuel Type Matters More in CFB Boilers Than Other Technologies
Unlike gas or oil boilers—where fuel properties are tightly standardized—CFB boilers directly interact with solid fuels inside the furnace. Fuel characteristics influence:
- Combustion temperature profile
- Bed material circulation rate
- Erosion and corrosion intensity
- Ash chemistry and fouling behavior
| Fuel Type | Design Complexity | Relative Cost Impact |
|---|---|---|
| Standard coal | Low | Baseline |
| Lignite / low-rank coal | Medium | +8–15% |
| Clean biomass | Medium | +10–20% |
| Petcoke | High | +15–25% |
| RDF / waste fuels | Very high | +25–40% |
CFB boilers must be physically larger when firing low-calorific fuels.True
Lower heating value requires higher volumetric fuel throughput and larger furnace volume.
2. Impact of Fuel Calorific Value on Furnace Size and Cost
Low-calorific-value fuels require higher mass flow to achieve the same thermal input.
| Fuel | Typical LHV (MJ/kg) | Furnace Size Impact |
|---|---|---|
| Bituminous coal | 22–25 | Baseline |
| Lignite | 10–15 | +20–35% |
| Wood biomass | 8–12 | +25–40% |
| RDF | 6–12 | +30–50% |
Lower fuel heating value increases CFB boiler capital cost.True
More fuel mass requires larger combustion volume and heat transfer surfaces.
Larger furnaces mean higher steel tonnage, more refractory, larger cyclones, and heavier supporting structures—all of which directly raise pricing.
3. Moisture Content and Drying Requirements
High-moisture fuels impose an additional energy and design penalty.
| Fuel Moisture | Typical Design Response | Cost Impact |
|---|---|---|
| <10% | Standard design | Baseline |
| 10–30% | Larger furnace, more air | +5–10% |
| 30–50% | Fuel drying, higher air flow | +15–25% |
| >50% | Special feeding & drying | +25–40% |
High-moisture fuels significantly increase auxiliary power and capital cost.True
Additional drying energy and airflow systems are required.
CFB boilers can tolerate moisture better than pulverized coal systems, but tolerance does not equal zero cost.
4. Ash Content, Composition, and Erosion Resistance
Fuel ash properties strongly affect material selection and maintenance design.
| Ash Characteristic | Design Consequence | Cost Effect |
|---|---|---|
| Low ash | Standard materials | Baseline |
| High ash | Larger ash systems | +5–10% |
| Abrasive ash | Hardfacing & alloys | +10–20% |
| Alkali-rich ash | Corrosion-resistant steels | +15–30% |
Aggressive ash chemistry drives higher CFB boiler material costs.True
Corrosion- and erosion-resistant alloys are more expensive.
Biomass and waste fuels are particularly challenging due to alkali and chlorine content.
5. Fuel Feeding and Handling Systems
Fuel flexibility dramatically affects front-end systems, often underestimated in cost discussions.
| Fuel Feeding Scope | Typical CAPEX Impact |
|---|---|
| Single fuel silo | Baseline |
| Dual fuel feeding | +5–10% |
| Multi-fuel parallel systems | +10–20% |
| RDF / sludge handling | +15–30% |
Fuel handling systems can represent over 15% of total CFB project cost.True
Complex fuels require specialized conveyors, crushers, and feeders.
Multiple fuels require redundancy, segregation, and blending control—all adding to project cost.
6. Emission Control Implications of Fuel Choice
Different fuels produce different emission profiles.
| Fuel Type | Emission Challenge | Cost Impact |
|---|---|---|
| Coal | SO₂, NOx | Baseline |
| Biomass | Alkali, PM | +5–10% |
| Petcoke | High sulfur | +10–20% |
| RDF | Cl, heavy metals | +15–30% |
Fuel flexibility increases emission control system cost.True
Wider fuel ranges require more robust emission mitigation systems.
CFB boilers integrate limestone injection efficiently, but extreme fuel diversity still raises compliance costs.
7. Control Systems and Automation Complexity
Fuel variability requires advanced control logic.
| Control Scope | Cost Effect |
|---|---|
| Fixed fuel | Baseline |
| Dual fuel | +3–5% |
| Multi-fuel dynamic blending | +5–10% |
Advanced automation is essential for stable multi-fuel CFB operation.True
Fuel variability demands real-time combustion optimization.
Modern multi-fuel CFB boilers rely heavily on sensors, analyzers, and adaptive control algorithms.
8. Comparative Pricing Scenarios
| Design Basis | Relative Boiler Price Index |
|---|---|
| Coal-only CFB | 1.00 |
| Coal + biomass | 1.10–1.20 |
| Biomass-only | 1.20–1.35 |
| Coal + petcoke | 1.15–1.30 |
| Multi-fuel incl. RDF | 1.30–1.50 |
Multi-fuel CFB boilers can cost up to 50% more than coal-only designs.True
Extreme flexibility requires oversized and reinforced systems.
9. Long-Term Economic Trade-Off
Although fuel flexibility increases CAPEX, it often reduces lifecycle cost.
| Economic Factor | Single Fuel | Multi-Fuel |
|---|---|---|
| Initial CAPEX | Lower | Higher |
| Fuel price risk | High | Low |
| Supply security | Weak | Strong |
| Long-term ROI | Moderate | High |
Fuel flexibility improves long-term project resilience.True
Ability to switch fuels protects against market volatility.
Many plants recover the additional investment within 3–6 years through fuel cost optimization alone.
10. Strategic Design Philosophy
Experienced owners increasingly specify “designed-for-future-fuels” CFB boilers.
This approach includes:
- Furnace sized for lowest LHV fuel
- Materials selected for worst-case ash chemistry
- Space reserved for future feeding systems
While initial pricing increases by 10–20%, future retrofit costs are dramatically reduced.
Designing for future fuel flexibility lowers total lifecycle cost.True
Upfront oversizing avoids costly retrofits later.
Fuel type and fuel flexibility are among the most decisive factors influencing CFB boiler pricing. Lower calorific value, higher moisture, aggressive ash chemistry, and broader fuel ranges all drive increases in furnace size, material grade, auxiliary systems, and automation—raising capital cost by 10–50% compared with single-fuel designs. However, this higher upfront investment often delivers superior long-term value through reduced fuel risk, improved regulatory resilience, and stronger lifecycle economics. In modern energy markets defined by uncertainty and decarbonization pressure, fuel flexibility is not merely a technical feature—it is a strategic investment choice.
What Auxiliary Systems and Emission Controls Significantly Increase Total Cost?
In modern industrial and power plant projects, many owners focus heavily on the boiler price itself, only to be surprised later when total project investment far exceeds initial expectations. The reason is simple: in today’s regulatory and operational environment, the boiler is only one part of a much larger system. Auxiliary systems and emission control equipment—often mandatory for fuel handling, environmental compliance, and safe operation—can account for 40–60% of total installed cost. Underestimating their impact is one of the most common causes of budget overruns in solid-fuel boiler and CFB projects. Understanding which systems drive cost, and why, is essential for realistic project planning.
Auxiliary systems and emission controls significantly increase total cost because they require large mechanical structures, high-power rotating equipment, advanced materials, and sophisticated automation. In CFB and solid-fuel boiler plants, fuel handling, ash systems, flue gas cleaning (baghouses, SNCR/SCR), induced draft fans, and continuous emission monitoring can collectively add 30–70% to the base boiler price, depending on fuel type, emission limits, and project scope.
These costs are not optional extras; in most cases, they are prerequisites for legal operation, long-term reliability, and bankability.
The boiler itself represents the majority of total plant investment.False
Auxiliary systems and balance-of-plant equipment often exceed the boiler island cost.
Emission control and auxiliary systems are major drivers of total project CAPEX.True
Environmental compliance and fuel handling requirements dominate modern plant costs.
1. Fuel Handling and Preparation Systems
Fuel handling is often the largest auxiliary cost block, especially for solid fuels.
| System Component | Typical Cost Impact |
|---|---|
| Fuel receiving & unloading | 3–6% |
| Conveyors & transfer towers | 4–8% |
| Crushers & screens | 2–4% |
| Storage silos/bunkers | 3–6% |
| Weigh feeders & dosing | 2–4% |
Fuel handling systems can account for over 15% of total plant cost.True
Solid fuel logistics require extensive mechanical infrastructure.
Costs escalate rapidly when fuels are heterogeneous (biomass, RDF, petcoke), requiring redundancy, dust suppression, and explosion protection.
2. Ash Handling and Disposal Systems
Ash is an unavoidable byproduct of solid-fuel combustion and must be managed continuously.
| Ash System Type | Cost Impact |
|---|---|
| Bottom ash cooling & discharge | 2–4% |
| Fly ash collection & conveying | 3–6% |
| Ash silos & truck loading | 2–4% |
| Conditioning & stabilization | 1–3% |
High-ash fuels significantly increase auxiliary system cost.True
Larger ash volumes require more robust handling and storage systems.
CFB boilers firing low-grade fuels often produce higher ash flow rates, increasing both CAPEX and OPEX.
3. Air and Flue Gas Systems (Fans & Ducting)
Large rotating equipment is a major hidden cost driver.
| Equipment | Cost Impact |
|---|---|
| Primary air fans | 2–4% |
| Secondary air fans | 1–3% |
| Induced draft (ID) fans | 3–6% |
| Air preheaters & ducting | 2–4% |
Fans and ducting represent a major share of mechanical CAPEX.True
High flow rates and pressure drops demand large, high-power equipment.
Stricter emission controls increase pressure losses, driving up fan size and energy consumption.
4. Particulate Matter Control (Baghouse / ESP)
Particulate control is mandatory in most jurisdictions.
| Technology | Typical Cost Share |
|---|---|
| Fabric filter (baghouse) | 6–10% |
| Electrostatic precipitator (ESP) | 5–8% |
Particulate control systems are among the most expensive emission controls.True
Large surface areas and structural steel dominate cost.
Baghouses are increasingly preferred for CFB boilers due to superior fine-particle capture, but at higher capital cost.
5. SO₂ Control Systems (Desulfurization)
CFB boilers integrate sulfur capture via limestone injection, but auxiliary systems are still required.
| SO₂ Control Element | Cost Impact |
|---|---|
| Limestone storage & handling | 2–4% |
| Injection & dosing systems | 1–2% |
| Additional ash handling | 1–2% |
In-furnace desulfurization is cheaper than wet FGD but not cost-free.True
Limestone logistics and ash disposal add capital cost.
High-sulfur fuels push limestone consumption—and system sizing—upward.
6. NOx Control Systems (SNCR / SCR)
NOx compliance can significantly affect total cost.
| Technology | Cost Impact |
|---|---|
| SNCR | 3–6% |
| Hybrid SNCR + SCR | 6–10% |
| Full SCR | 8–15% |
NOx control costs escalate rapidly with stricter limits.True
Catalysts and reactors significantly increase CAPEX.
CFB boilers often meet moderate limits with SNCR, but urban or OECD markets increasingly require hybrid solutions.
7. Continuous Emission Monitoring Systems (CEMS)
Environmental authorities increasingly mandate real-time monitoring.
| CEMS Component | Cost Impact |
|---|---|
| Gas analyzers | 1–2% |
| Data acquisition & reporting | 1–2% |
| Calibration & redundancy | 0.5–1% |
CEMS is a regulatory requirement, not an optional upgrade.True
Permits often require continuous emissions reporting.
While smaller in percentage terms, CEMS adds complexity and long-term maintenance cost.
8. Water and Wastewater Treatment Systems
Auxiliary systems extend beyond combustion and emissions.
| System | Cost Impact |
|---|---|
| Boiler feedwater treatment | 2–4% |
| Blowdown & wastewater treatment | 1–3% |
| Cooling water systems | 3–6% |
Water treatment systems are critical for long-term boiler reliability.True
Poor water quality leads to efficiency loss and failures.
High-pressure and supercritical plants require particularly sophisticated water chemistry control.
9. Electrical, Control, and Automation Systems
Advanced automation is essential for modern plants.
| System | Cost Impact |
|---|---|
| DCS & PLC systems | 3–5% |
| Field instrumentation | 2–4% |
| Electrical distribution | 4–6% |
Automation reduces O&M cost but increases initial CAPEX.True
Advanced control improves efficiency and reliability.
Multi-fuel and low-emission operation is impossible without robust control systems.
10. Combined Cost Impact Overview
| Cost Category | Typical Share of Total CAPEX |
|---|---|
| Boiler island | 30–40% |
| Fuel & ash systems | 20–30% |
| Emission controls | 20–30% |
| Fans, air & gas systems | 10–15% |
| Electrical & I&C | 8–12% |
Auxiliary and emission systems can exceed the cost of the boiler itself.True
Modern compliance-driven plants are balance-of-plant dominated.
Auxiliary systems and emission controls are the dominant cost drivers in modern boiler and CFB projects. Fuel handling, ash management, particulate control, SO₂ and NOx mitigation, large fans, water treatment, and automation can collectively add 30–70% to the base boiler price, fundamentally reshaping total project economics. These systems are not optional—they are essential for regulatory compliance, operational reliability, and long-term asset value. Accurate budgeting therefore requires shifting focus from “boiler price” to total installed plant cost, with auxiliary and environmental systems fully accounted for from the earliest project stage.
How Does EPC Scope (Supply-Only vs. Turnkey) Change the Overall Budget?
When planning a boiler or CFB power plant project, many owners initially focus on equipment price, assuming that choosing a “supply-only” EPC scope will automatically minimize total investment. In practice, this assumption often leads to budget overruns, schedule delays, and contractual disputes. The choice between supply-only and turnkey (full EPC) scope fundamentally reshapes not only the headline contract value, but also risk allocation, hidden costs, financing conditions, and final installed cost. Understanding how EPC scope affects the true overall budget is essential for making an economically sound decision—especially for complex, capital-intensive boiler projects.
EPC scope directly affects overall budget by redistributing costs, risks, and contingencies rather than simply adding or removing value. Compared with supply-only contracts, turnkey EPC projects typically increase upfront contract value by 20–50%, but often reduce total installed cost, execution risk, financing cost, and lifecycle expense. Supply-only projects appear cheaper on paper, yet frequently exceed turnkey budgets once owner-managed engineering, interfaces, delays, and risk premiums are fully accounted for.
This difference explains why experienced owners increasingly evaluate EPC scope based on total project cost and risk-adjusted value, not contract price alone.
Supply-only EPC scope always results in a lower total project cost.False
Supply-only contracts often shift risk and hidden costs to the owner, increasing total installed cost.
Turnkey EPC projects usually have higher upfront price but lower execution risk.True
Integrated responsibility reduces interfaces, delays, and contingency overruns.
1. Defining EPC Scope: Supply-Only vs. Turnkey
Before comparing costs, it is essential to clarify what each EPC scope actually includes.
| EPC Scope | Responsibility Coverage |
|---|---|
| Supply-only | Core equipment design & manufacturing |
| Partial EPC | Equipment + limited engineering/support |
| Turnkey EPC | Engineering, procurement, construction, commissioning, performance guarantee |
EPC scope defines who carries execution and performance risk.True
The broader the EPC scope, the more risk is transferred from owner to contractor.
In boiler and CFB projects, the difference is especially pronounced due to the complexity of balance-of-plant systems.
2. Apparent Budget Difference at Contract Level
At contract signature, supply-only appears significantly cheaper.
| Scope Type | Contract Price Index |
|---|---|
| Supply-only | 1.0 |
| Partial EPC | 1.2–1.3 |
| Turnkey EPC | 1.4–1.6 |
Turnkey EPC contracts typically cost 20–50% more than supply-only contracts.True
The contractor prices engineering, construction, commissioning, and risk.
However, this comparison ignores owner-side costs that are not included in supply-only contracts.
3. Hidden Owner Costs in Supply-Only Projects
Supply-only EPC shifts numerous responsibilities to the owner.
| Owner Responsibility | Typical Cost Impact |
|---|---|
| Detailed engineering | 3–6% |
| Civil & structural works | 8–15% |
| Installation & erection | 10–15% |
| Interface management | 3–5% |
| Commissioning & troubleshooting | 3–6% |
Owner-managed scope can exceed 30% of total project cost.True
Engineering, construction, and coordination are capital-intensive activities.
These costs often emerge gradually, making early budgets appear artificially low.
4. Interface Risk and Cost Escalation
Complex boiler plants involve dozens of technical interfaces.
| Interface Type | Risk Level |
|---|---|
| Boiler–civil | High |
| Boiler–fuel handling | High |
| Boiler–emission control | Very high |
| Boiler–DCS | Medium–High |
Interface mismatches are a leading cause of cost overruns in supply-only projects.True
Unclear responsibility leads to rework and delays.
In turnkey EPC, these interfaces are internalized, reducing rework and claims.
5. Schedule Risk and Its Financial Impact
Delays translate directly into cost.
| Delay Source | Supply-Only | Turnkey EPC |
|---|---|---|
| Engineering misalignment | High | Low |
| Contractor coordination | Owner risk | EPC risk |
| Commissioning delays | Common | Less frequent |
Schedule delays significantly increase total project cost.True
Extended construction increases financing and overhead costs.
For capital-intensive power plants, a 3–6 month delay can add millions in interest and lost revenue.
6. Contingency and Risk Premium Comparison
| Cost Element | Supply-Only | Turnkey EPC |
|---|---|---|
| Owner contingency | High (10–20%) | Low (5–8%) |
| Contractor contingency | Low | Embedded |
| Claims exposure | High | Limited |
Risk does not disappear in supply-only projects—it shifts to the owner.True
Owners must self-insure against execution risk.
When realistic contingencies are added, supply-only cost advantage often disappears.
7. Financing and Bankability Impact
Lenders strongly prefer integrated EPC delivery.
| Financing Aspect | Supply-Only | Turnkey EPC |
|---|---|---|
| Bank acceptance | Moderate | High |
| Required guarantees | Extensive | Standardized |
| Cost of capital | Higher | Lower |
Turnkey EPC contracts improve project bankability.True
Single-point responsibility reduces lender risk.
Lower interest rates over long construction periods materially affect total project cost.
8. Performance Guarantees and Long-Term Cost
Turnkey EPC contracts typically include:
- Efficiency guarantees
- Emission guarantees
- Availability guarantees
| Guarantee Type | Budget Impact |
|---|---|
| Supply-only | Owner bears risk |
| Turnkey EPC | Contractor liable |
Performance guarantees protect long-term project economics.True
Underperformance leads to measurable financial losses.
Without guarantees, owners often spend more on retrofits and tuning post-commissioning.
9. Total Installed Cost Comparison (Typical CFB Project)
| Cost Category | Supply-Only | Turnkey EPC |
|---|---|---|
| Contract price | Low | High |
| Owner-side costs | High | Low |
| Risk contingencies | High | Low |
| Financing cost | Higher | Lower |
| Total installed cost | Often higher | Often lower |
Turnkey EPC projects often deliver lower total installed cost.True
Reduced risk and integration offset higher upfront pricing.
This is particularly true for first-of-a-kind plants, multi-fuel CFBs, and strict-emission projects.
10. When Supply-Only Can Still Make Sense
Supply-only EPC can be advantageous when:
- Owner has strong in-house EPC capability
- Project is a simple retrofit or expansion
- Local contractors are highly experienced
- Schedule risk is low
Supply-only EPC is best suited for experienced owners with strong execution capability.True
Without in-house expertise, risks escalate quickly.
For most new-build CFB and boiler projects, however, turnkey EPC provides better cost certainty.
The choice between supply-only and turnkey EPC scope does not simply change contract price—it reshapes the entire project budget, risk profile, and financial outcome. Supply-only contracts appear cheaper initially but frequently result in higher total installed cost once owner-managed engineering, interfaces, delays, contingencies, and financing impacts are fully considered. Turnkey EPC projects typically increase upfront contract value by 20–50%, yet often deliver lower risk-adjusted total cost, stronger bankability, and more predictable long-term performance. For complex boiler and CFB projects, EPC scope selection should therefore be driven by total lifecycle value—not headline price alone.
🔍 Conclusion
CFB boiler costs vary widely based on capacity, application, fuel flexibility, and project scope. While large power plant CFB boilers require high upfront investment, they offer excellent efficiency, fuel adaptability, and environmental compliance over the long term. Proper sizing and configuration are key to achieving the best return on investment.
🔹 Contact us today to get a tailored cost breakdown and technical proposal for your CFB boiler project. ⚙️🔥🏭✅
FAQ
Q1: What is the general cost range of circulating fluidized bed (CFB) boilers?
A1: The cost of a circulating fluidized bed (CFB) boiler varies widely depending on capacity, pressure level, fuel type, emission standards, and whether the system is designed for industrial or utility-scale applications. In general, small industrial CFB boilers (20–75 t/h steam capacity) typically range from USD 3 million to USD 10 million, while medium to large utility-scale CFB boilers (100–300+ MW thermal output) can cost between USD 50 million and USD 200 million or more. These figures usually include the boiler island but may exclude auxiliary systems such as fuel handling, ash disposal, flue gas desulfurization (FGD), and civil works. Despite higher upfront costs compared to pulverized coal boilers, CFB systems often deliver better long-term value due to fuel flexibility and lower emission compliance costs.
Q2: How much do industrial-scale CFB boilers typically cost?
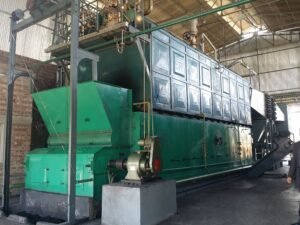
A2: Industrial CFB boilers, commonly used for process steam and combined heat and power (CHP) applications, are generally more affordable than power-utility units. For capacities ranging from 20 t/h to 130 t/h, the cost typically falls between USD 3 million and USD 15 million. Biomass-fired or waste-fueled industrial CFB boilers may be on the higher end due to additional fuel feeding and ash handling systems. These boilers are popular in industries such as pulp and paper, textiles, chemicals, and food processing, where low-grade fuels or production waste can be used. Over time, fuel savings and lower emission treatment requirements often offset the higher capital investment.
Q3: What is the cost difference between coal-fired and biomass CFB boilers?
A3: Coal-fired CFB boilers are generally 10–20% less expensive than biomass CFB boilers of the same capacity. This is because biomass systems require more complex fuel preparation, feeding, and storage equipment, as well as larger furnace volumes due to lower fuel energy density. For example, a 100 t/h coal-fired CFB boiler may cost USD 8–12 million, while a comparable biomass-fired CFB boiler may range from USD 10–15 million. However, biomass boilers benefit from renewable energy incentives, carbon credits, and lower fuel costs, which can significantly improve long-term economic performance despite the higher initial investment.
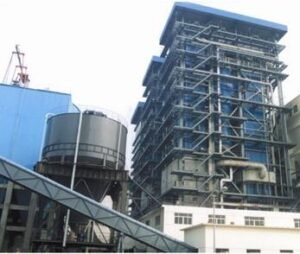
Q4: Why are utility-scale CFB power plant boilers more expensive?
A4: Utility-scale CFB boilers are designed for high-pressure, high-temperature steam generation and grid-scale power production, which significantly increases engineering complexity and material requirements. These systems often include supercritical or ultra-supercritical designs, advanced cyclone separators, extensive heat recovery surfaces, and sophisticated automation and safety systems. Additionally, utility CFB projects usually require comprehensive environmental control systems, including ESPs or bag filters and limestone-based sulfur capture. As a result, a 300 MW CFB power boiler can cost USD 150–250 million, depending on location, regulatory standards, and project scope. While expensive, these systems offer exceptional fuel flexibility and long-term compliance advantages.
Q5: What factors most strongly influence the final cost of a CFB boiler project?
A5: Several key factors determine the final cost of a CFB boiler system. Boiler capacity and pressure rating are primary cost drivers, as higher parameters require advanced alloys and thicker pressure parts. Fuel type and variability also impact cost, with multi-fuel or waste-fired designs being more expensive. Environmental requirements, such as sulfur capture efficiency and particulate emission limits, add to capital cost but reduce operating expenses later. Other factors include local labor costs, installation scope, automation level, and after-sales service agreements. A well-optimized CFB boiler project balances upfront investment with long-term fuel savings, operational reliability, and regulatory compliance.
References
- International Energy Agency – Fluidized Bed Combustion Overview – https://www.iea.org/ – IEA
- U.S. Department of Energy – CFB Boiler Technology – https://www.energy.gov/ – DOE
- ASME – Boiler and Pressure Vessel Code (BPVC) – https://www.asme.org/ – ASME
- Valmet – Circulating Fluidized Bed Boiler Solutions – https://www.valmet.com/ – Valmet
- GE Steam Power – CFB Power Plant Technology – https://www.ge.com/steam-power/ – GE Steam Power
- Mitsubishi Power – Advanced CFB Boilers – https://power.mhi.com/ – Mitsubishi Power
- ScienceDirect – Cost Analysis of CFB Boilers – https://www.sciencedirect.com/ – ScienceDirect
- Engineering Toolbox – Boiler Cost and Efficiency Factors – https://www.engineeringtoolbox.com/ – Engineering Toolbox
- MarketsandMarkets – Global CFB Boiler Market Forecast – https://www.marketsandmarkets.com/ – Markets and Markets
- World Bank – Clean Coal and CFB Power Projects – https://www.worldbank.org/ – World Bank