Efficiency is a key performance metric for industrial boilers, directly impacting fuel costs, emissions, and operational sustainability. Yet many plant managers and procurement teams lack clarity on what efficiency levels to expect—and what technologies influence them. Choosing a boiler without understanding its efficiency profile can result in wasted energy, high operating expenses, and poor environmental compliance.
Modern industrial boilers typically operate at combustion efficiencies between 80% and 89%, while high-efficiency models—especially those with economizers, condensers, and advanced controls—can reach thermal efficiencies of 90% to 95% or higher. The actual efficiency depends on boiler design, fuel type, heat recovery systems, operating conditions, and maintenance practices.
By understanding boiler efficiency in detail, buyers can make informed choices that reduce energy usage, meet regulatory demands, and improve long-term ROI. The following breakdown explains how efficiency is measured, enhanced, and maintained in industrial settings.
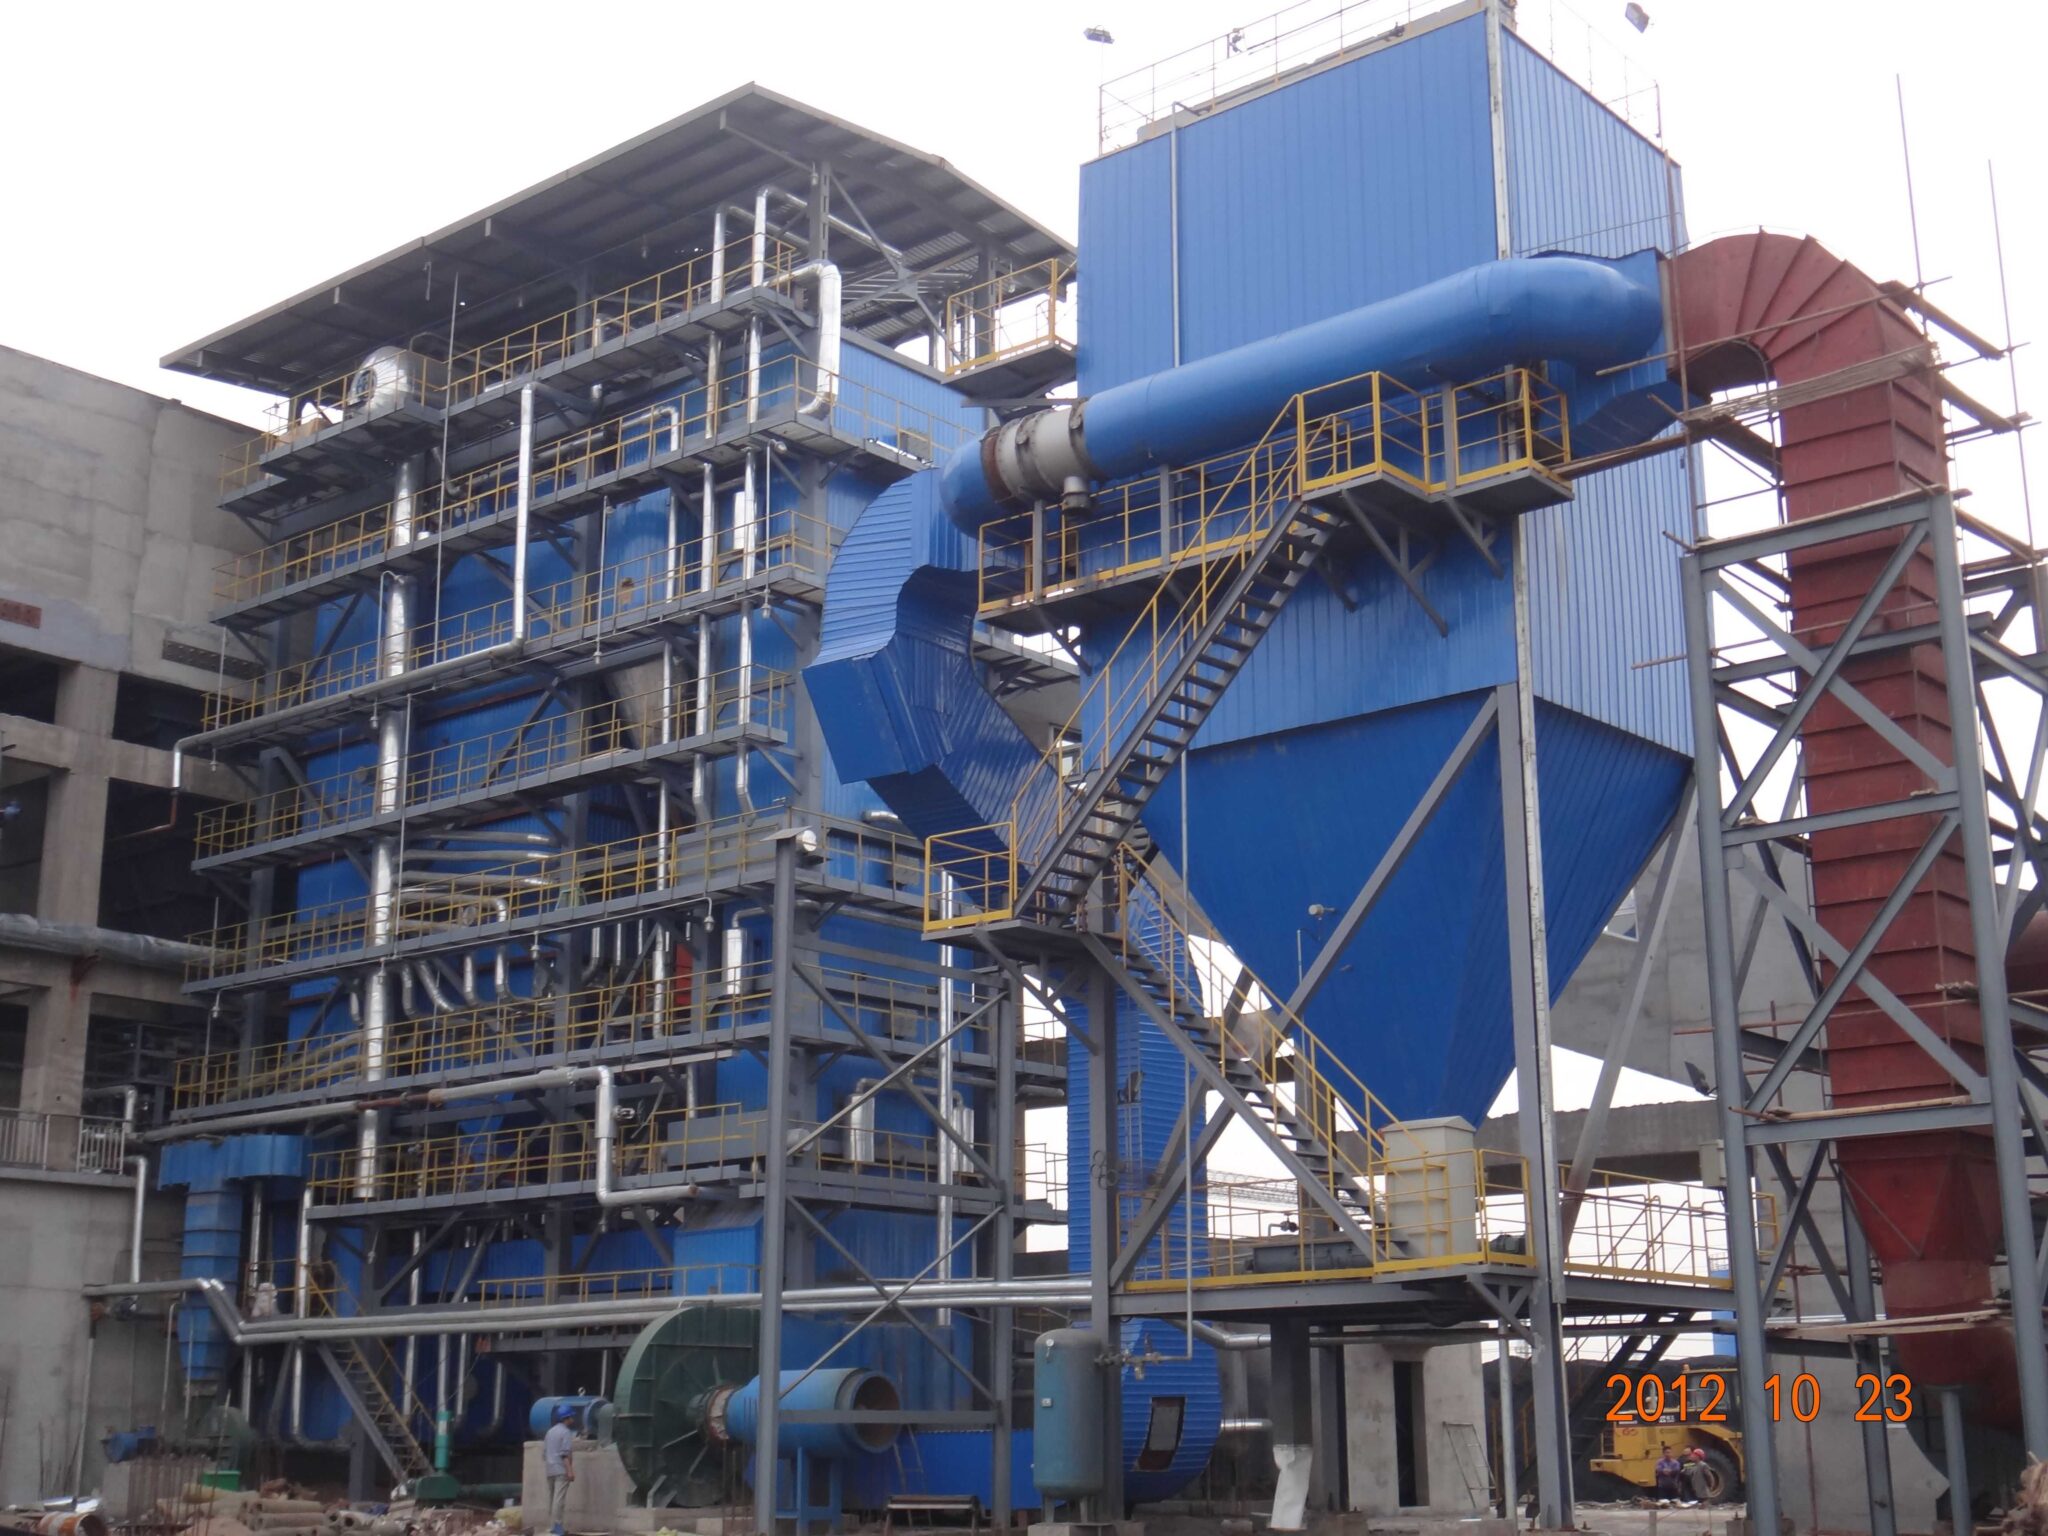
What Is the Difference Between Combustion Efficiency, Thermal Efficiency, and Overall Boiler Efficiency?
When selecting or operating a boiler system, many professionals struggle to interpret the efficiency metrics provided—combustion efficiency, thermal efficiency, and overall boiler efficiency are often used interchangeably, yet they measure different things. Misunderstanding these terms can lead to misleading performance estimates, unrealistic cost projections, or non-compliance with regulatory standards. A complete understanding of how each efficiency type is defined—and how it impacts fuel cost and carbon emissions—is essential for both engineers and facility managers.
Combustion efficiency measures how well the fuel is burned; thermal efficiency measures how well the heat from combustion is transferred to water or steam; overall boiler efficiency reflects the total usable energy output versus fuel input, accounting for all losses.
Each efficiency value offers insights at a different level of the system—and they should be analyzed together for proper boiler evaluation.
Combustion efficiency and thermal efficiency mean the same thing in boiler systems.False
Combustion efficiency only measures how completely the fuel burns, while thermal efficiency includes heat transfer to the working fluid and system losses.
Overall boiler efficiency is always lower than combustion efficiency.True
Overall boiler efficiency includes all system losses (stack losses, radiation, blowdown), making it lower than combustion efficiency.
🔥 Definitions of Boiler Efficiency Types
| Efficiency Type | What It Measures | Equation |
|---|---|---|
| Combustion Efficiency | How completely the burner converts fuel into heat (no heat transfer accounted) | = (Actual heat from combustion ÷ Potential heat in fuel) × 100% |
| Thermal Efficiency | How much of the combustion heat is transferred to water/steam | = (Heat transferred to fluid ÷ Fuel input energy) × 100% |
| Overall Boiler Efficiency | Total system efficiency including all losses (stack, radiation, blowdown) | = (Useful output steam energy ÷ Total fuel input) × 100% |
📊 Efficiency Comparison Table
| Boiler Type | Combustion Efficiency | Thermal Efficiency | Overall Boiler Efficiency |
|---|---|---|---|
| Fire-tube (standard) | 82% – 86% | 78% – 83% | 75% – 80% |
| Water-tube (modern) | 85% – 90% | 80% – 88% | 78% – 85% |
| Condensing boiler | 90% – 96% | 88% – 94% | 89% – 95% |
| High-efficiency HRSG | 90% – 94% | 90% – 93% | 88% – 92% |
Note: Combustion efficiency is typically measured with flue gas analyzers, while thermal and overall efficiencies require heat balance calculations or enthalpy measurements.
🧠 Breakdown of Losses That Lower Efficiency
| Loss Category | Impacts | Included In… |
|---|---|---|
| Incomplete Combustion | Reduces combustion efficiency | ✔️ Combustion efficiency |
| Flue Gas Heat Loss | Exhaust carries unused heat | ✔️ Thermal efficiency, ✔️ Overall efficiency |
| Radiation Loss | Heat lost through boiler shell | ❌ Combustion, ✔️ Thermal, ✔️ Overall |
| Blowdown Loss | Heat lost with discharged water | ❌ Combustion, ❌ Thermal, ✔️ Overall |
| Unburned Fuel (soot) | Fuel waste in ash or exhaust | ✔️ Combustion efficiency only |
| Auxiliary Power Use | Pumps, fans consume power | ❌ in all unless converted to system-wide efficiency |
🔍 Example Calculation: Understanding the Layers
Input Data:
Fuel energy input: 10,000 kW
Actual combustion output: 9,000 kW → Combustion Efficiency = 90%
Heat absorbed by water: 8,400 kW → Thermal Efficiency = 84%
Net steam output (after losses): 7,800 kW → Overall Boiler Efficiency = 78%
Visual Relationship:
10,000 kW → [Combustion loss: 1,000 kW] → 9,000 kW
9,000 kW → [Transfer loss: 600 kW] → 8,400 kW
8,400 kW → [System loss: 600 kW] → 7,800 kW
This shows how real boilers lose efficiency at each stage. The greatest improvements come from minimizing stack, radiation, and blowdown losses.
🧪 How to Improve Each Efficiency Type
| Efficiency Type | Improvement Methods |
|---|---|
| Combustion Efficiency | Tune air/fuel ratio, use O₂ trim, avoid excess air |
| Thermal Efficiency | Improve heat exchanger surfaces, reduce fouling, add economizer |
| Overall Boiler Efficiency | Recover blowdown heat, use condensate return, optimize load cycling |
🏭 Application Considerations
| Industry | Efficiency Focus | Why It Matters |
|---|---|---|
| Power Generation | Thermal + Overall | Impacts turbine inlet quality and cost per MWh |
| Food & Beverage | Overall | Maximizes energy recovery and reduces water usage |
| Pharmaceutical | Combustion + Thermal | Requires clean, precise, and efficient steam |
| Petrochemical | Combustion + Thermal | High fuel cost makes burner and heat transfer efficiency crucial |
⚙️ Measurement Tools
| Efficiency Metric | Tools Required |
|---|---|
| Combustion Efficiency | Flue gas analyzer, O₂/CO₂ sensors |
| Thermal Efficiency | Steam flowmeter, fuel flowmeter, enthalpy calculator |
| Overall Boiler Efficiency | Integrated energy management system or heat balance |
Conclusion
Understanding the difference between combustion, thermal, and overall boiler efficiency is critical to properly evaluating system performance and fuel usage. Combustion efficiency tells you how well you’re burning fuel, thermal efficiency shows how much of that heat is captured by the fluid, and overall boiler efficiency reveals the true value you’re getting from each unit of fuel. The best performance is achieved by optimizing all three—not just chasing a single number.
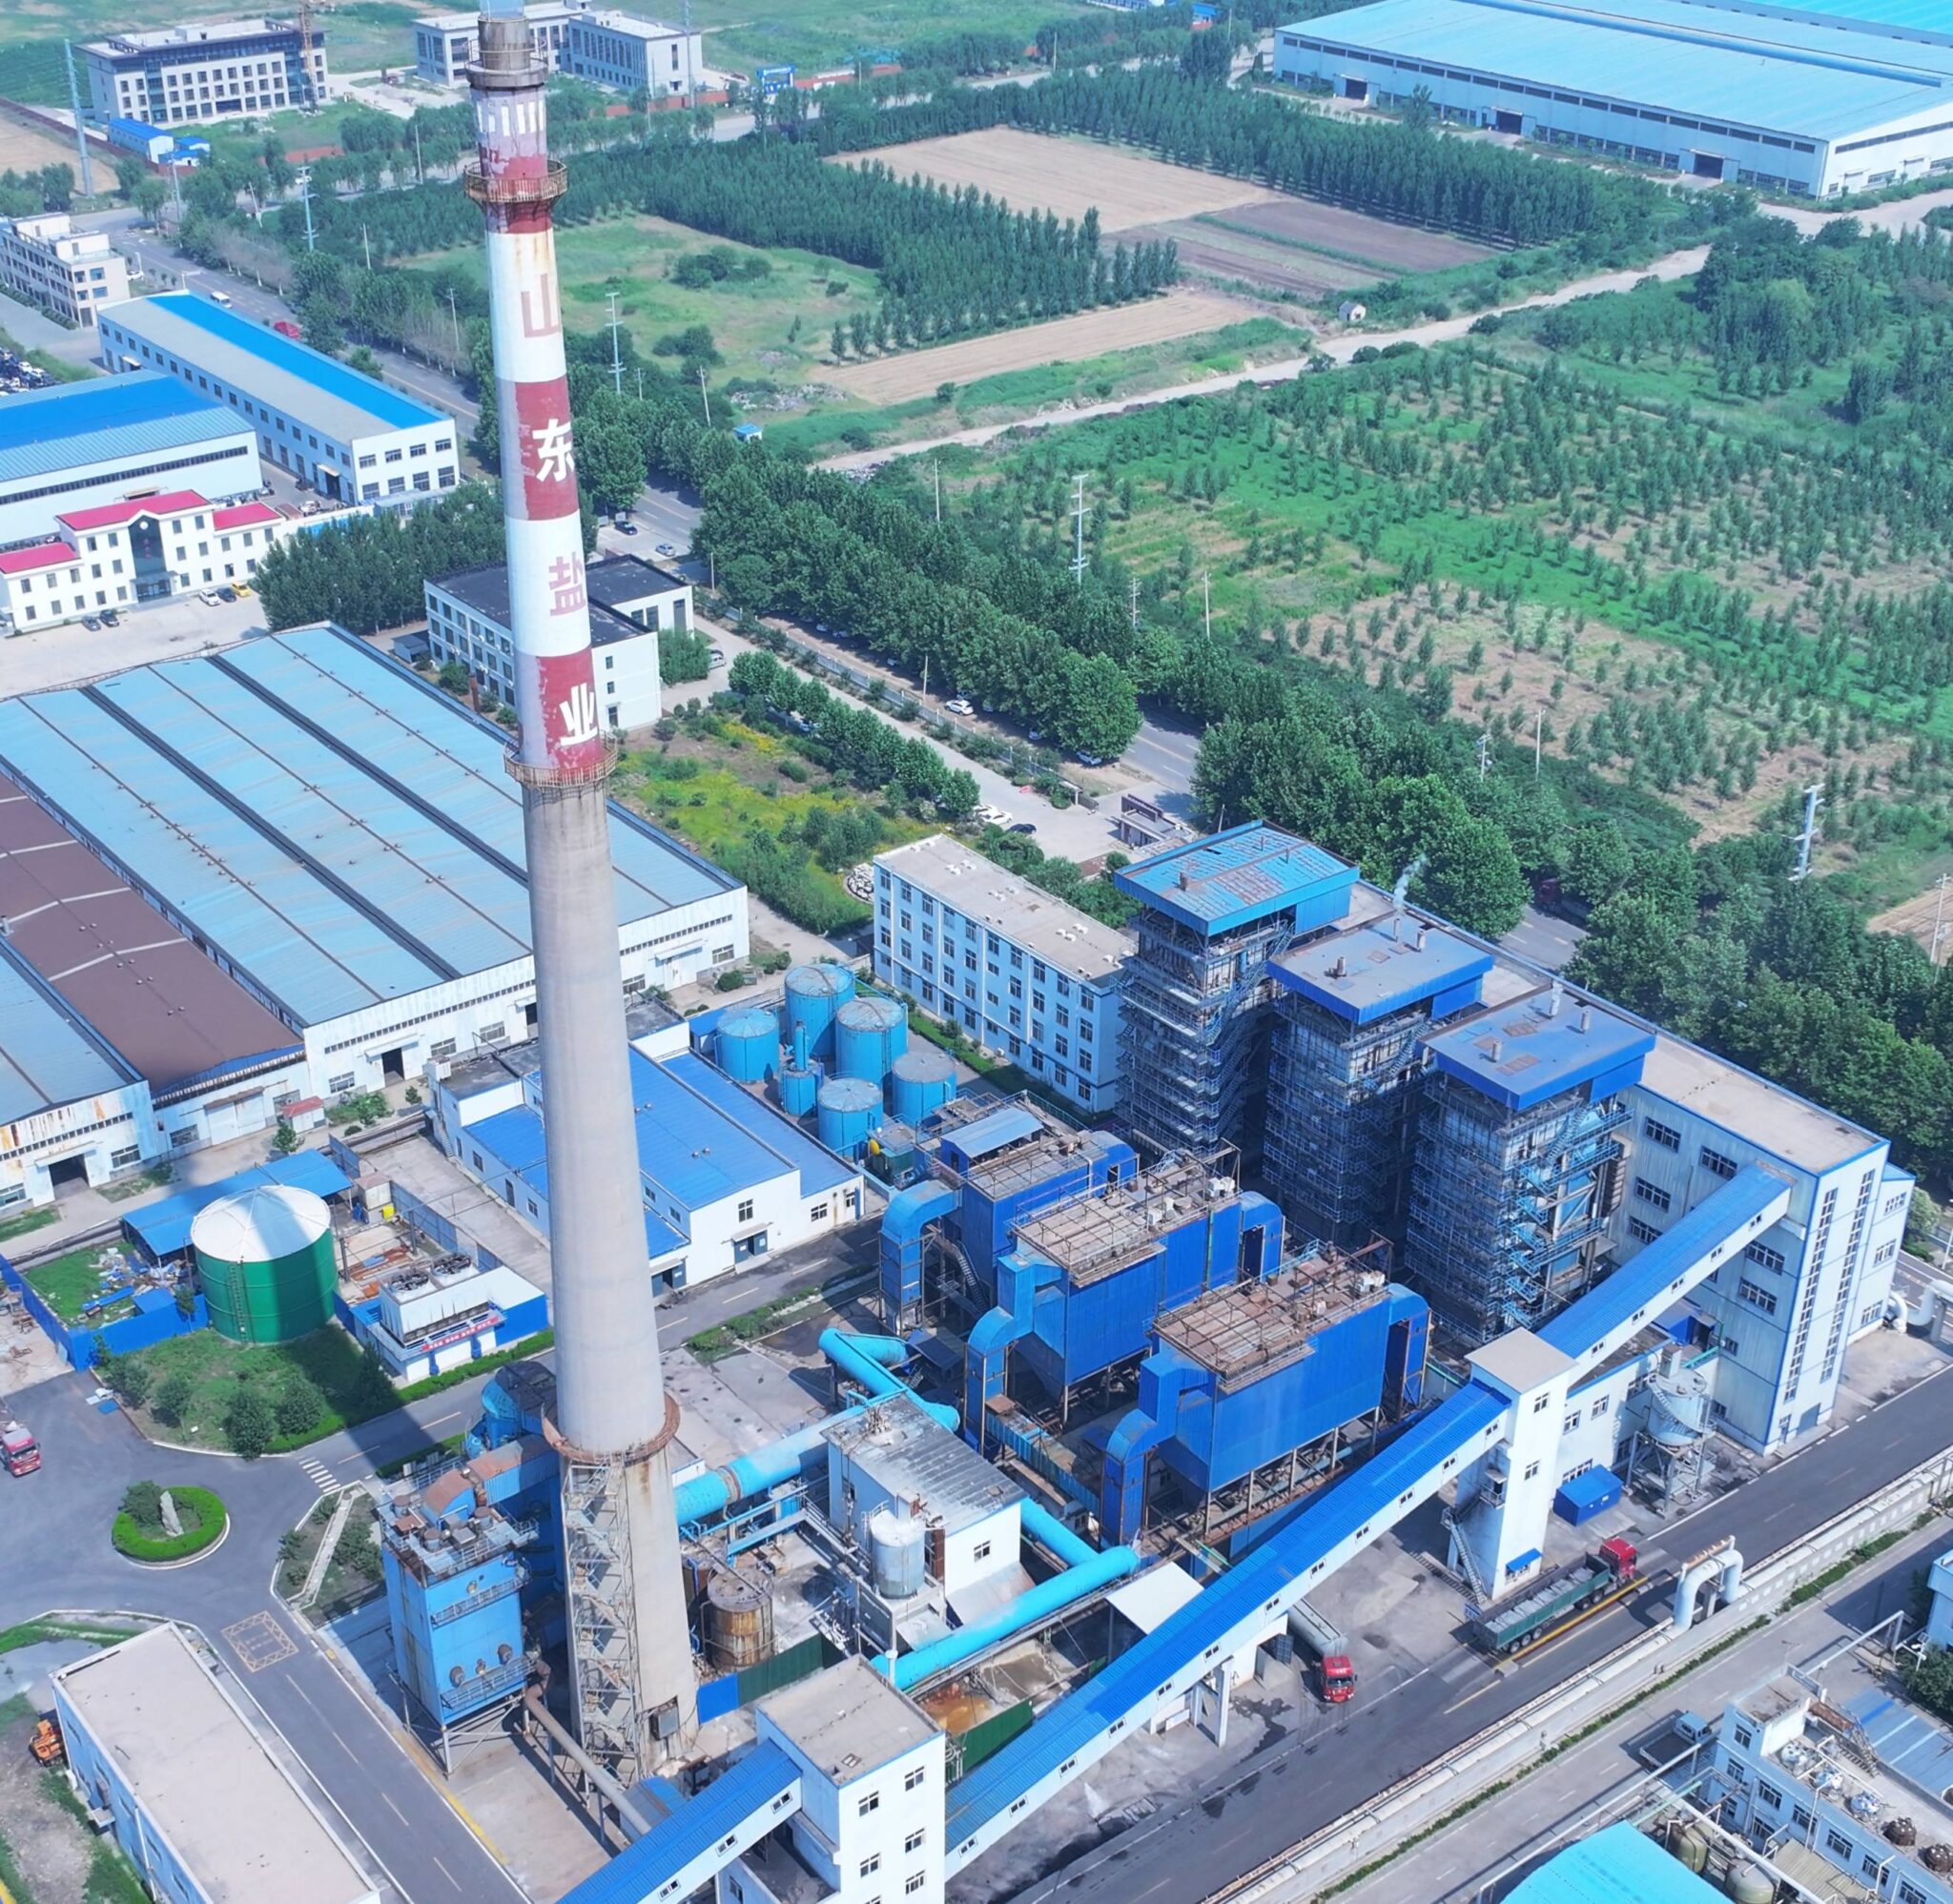
What Are Typical Efficiency Ranges for Fire-Tube vs. Water-Tube Boilers?
Industrial and commercial boiler buyers often ask: “Which type of boiler is more efficient—fire-tube or water-tube?” Choosing the wrong type based on inaccurate efficiency expectations can lead to excessive fuel costs, lower productivity, or maintenance headaches. While both boiler types are widely used, their design differences impact how effectively they transfer heat from fuel combustion to water or steam, influencing real-world efficiency. Understanding the typical efficiency ranges is essential for making the right decision based on application size, pressure, and duty cycle.
Fire-tube boilers generally operate with typical efficiencies between 75% and 85%, while water-tube boilers can reach 80% to 92% depending on pressure, size, and auxiliary systems like economizers or superheaters.
Water-tube boilers tend to be more efficient at higher capacities and pressures, while fire-tube boilers offer simpler operation at moderate loads and lower pressures.
Water-tube boilers typically operate with higher efficiency than fire-tube boilers.True
Due to superior heat transfer design, faster steam generation, and higher pressure capability, water-tube boilers generally achieve greater efficiency.
Fire-tube boilers are more efficient than water-tube boilers in high-pressure applications.False
Water-tube boilers outperform fire-tube designs at high pressure and capacity due to their faster response and better heat transfer rates.
🔥 Efficiency Comparison Table: Fire-Tube vs. Water-Tube Boilers
| Efficiency Type | Fire-Tube Boiler | Water-Tube Boiler |
|---|---|---|
| Combustion Efficiency | 82% – 86% | 85% – 90% |
| Thermal Efficiency | 78% – 83% | 80% – 88% |
| Overall Boiler Efficiency | 75% – 80% | 78% – 92% |
| Condensing Option | Rare, limited to low temp return | Possible with proper system design |
Fire-tube boilers tend to lose more heat through the shell and stack, while water-tube boilers use more surface area and convective zones to extract more energy.
🧠 Efficiency Influencing Factors
| Factor | Fire-Tube Impact | Water-Tube Impact |
|---|---|---|
| Heat Transfer Surface Area | Limited to inner shell and tubes | Higher via multiple passes and headers |
| Startup/Load Response | Slower due to large water mass | Faster due to low water volume |
| Steam Pressure Tolerance | Typically up to 250 psi | Up to 2,000+ psi in industrial units |
| Fuel Flexibility | Moderate | High (including biomass, waste fuels) |
| System Integration | Basic economizer if present | Advanced HRSG, superheater, economizer |
| Blowdown & Losses | Higher due to wet leg conditions | Lower with continuous blowdown system |
📊 Efficiency Range Visual Chart
| Boiler Type | Low End (%) | Typical (%) | Optimized with Economizer (%) | Condensing Variant (%) |
|---|---|---|---|---|
| Fire-Tube | 75% | 80% | 83% – 85% | 87% (if applicable) |
| Water-Tube | 78% | 85% | 88% – 90% | 92% (if designed for it) |
Condensing only applies where return water temperature is below 60°C (140°F)—usually in low-temp heating, not process steam.
🏭 Real-World Boiler Efficiency Examples
| Industry/Application | Boiler Type | Reported Efficiency | Details |
|---|---|---|---|
| Food Processing Plant | Fire-tube (10 TPH) | ~81% overall | Used natural gas with basic economizer |
| Power Plant (HRSG) | Water-tube | ~91% overall | Exhaust heat from gas turbine, 2-stage SH |
| Brewery | Fire-tube (low pressure) | ~78% overall | Small-scale batch steam, no economizer |
| Chemical Plant | Water-tube, superheated | ~88% | Steam used at 40 bar, 450°C |
⚙️ How to Improve Boiler Efficiency (Both Types)
| Improvement | Efficiency Gain | Notes |
|---|---|---|
| Add Economizer | +2% to +5% | Recovers heat from flue gas to preheat feedwater |
| Optimize Air-Fuel Ratio | +1% to +2% | Reduces excess air and stack losses |
| Insulate Shell & Piping | +0.5% to +1.5% | Reduces radiation and standby losses |
| Use O₂ Trim Control | +1% | Adjusts combustion dynamically for optimum burn |
| Condensing Operation | +5% to +8% | Only effective if return temp < 60°C, not typical for steam |
🧪 ASME & ISO Efficiency Definitions
| Standard | Metric | Relevant To |
|---|---|---|
| ASME PTC 4.1 | Thermal Efficiency (Boiler Test Code) | All steam boiler types |
| ISO 16528 | Design and efficiency classification | International boiler compliance |
| EN 12953 (Fire-Tube) | Construction, test, and efficiency | Fire-tube boilers |
| EN 12952 (Water-Tube) | High-pressure water-tube steam boilers | Water-tube boilers |
🧠 Summary Insights
| Category | Best Performer | Why |
|---|---|---|
| Low Initial Cost | Fire-tube Boiler | Simpler construction, fewer control requirements |
| High Pressure/Capacity | Water-tube Boiler | Handles higher pressures and faster steam output |
| Energy Recovery | Water-tube (HRSG, SH, economizer-ready) | Better suited for multi-stage energy use |
| Efficiency Potential | Water-tube Boiler | More heat surface area, less heat loss |
Conclusion
Fire-tube boilers are efficient and cost-effective for moderate loads and lower pressures, usually achieving 75% to 85% efficiency. In contrast, water-tube boilers are the top performers at high pressure and capacity, delivering 80% to 92% efficiency, especially when enhanced with economizers, air preheaters, or superheaters. Selecting the right boiler type should align with your process demand, fuel type, and energy-saving goals.
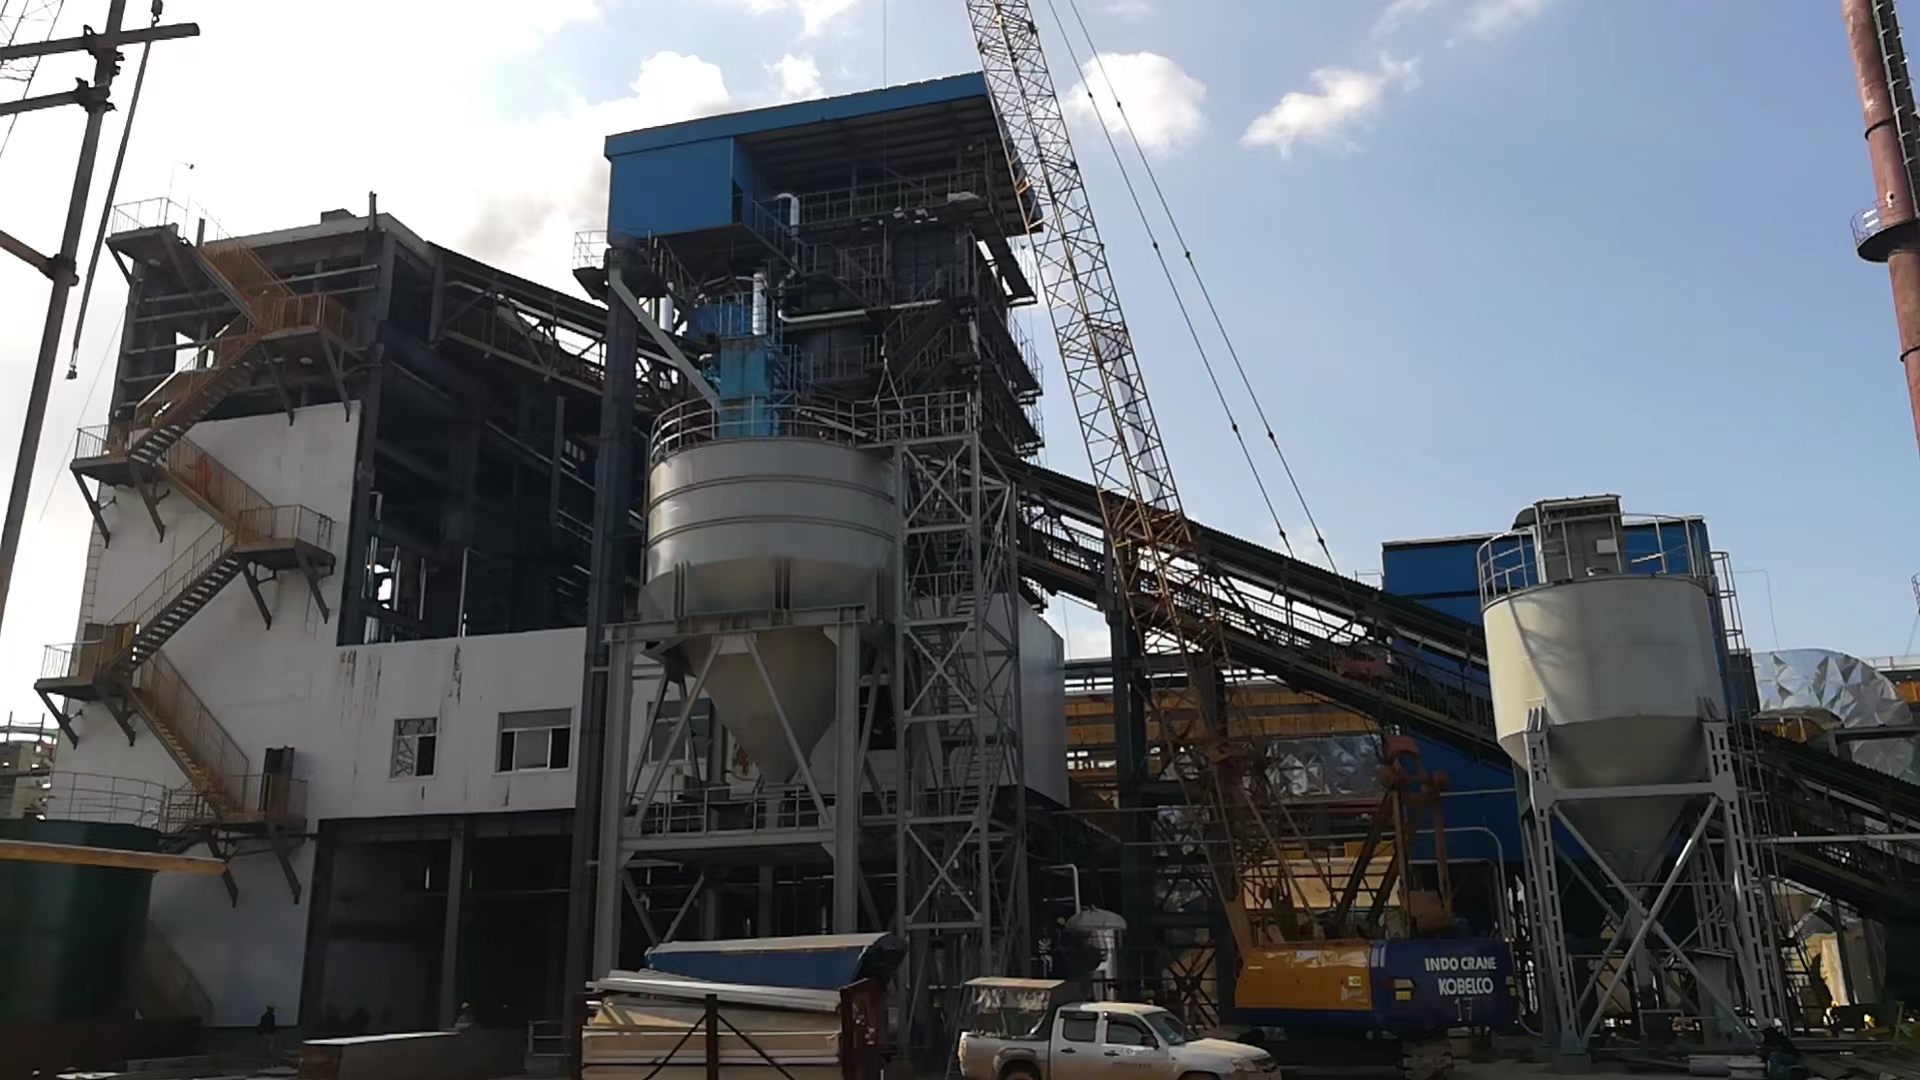
How Do Economizers, Condensers, and O₂ Trim Systems Improve Boiler Efficiency?
Maximizing the energy output of a boiler system without burning more fuel is the goal of every efficient plant. But boilers naturally lose heat through exhaust gases, stack emissions, and improper combustion. These losses may seem inevitable, but they can be recovered or prevented using advanced system enhancements. The three most effective technologies to boost boiler efficiency are economizers, condensers, and oxygen (O₂) trim systems. Each targets a different type of energy loss, making them powerful when applied together.
Economizers recover heat from flue gases to preheat feedwater, condensers reclaim latent heat from exhaust moisture in condensing systems, and O₂ trim systems automatically optimize combustion to reduce excess air and improve burn efficiency. Together, these technologies can improve boiler efficiency by 5%–15% or more.
Integrating these systems helps facilities reduce fuel consumption, cut emissions, and maintain peak operational performance.
Oxygen trim systems help improve combustion efficiency by continuously adjusting air-fuel ratio.True
O₂ trim systems reduce excess air, prevent incomplete combustion, and maintain consistent flame quality across loads.
Condensers are only useful in steam boiler systems operating above 100°C.False
Condensers are only effective when flue gas temperatures drop below water's dew point, typically in low-temperature condensing systems.
🔥 1. Economizers: Flue Gas Heat Recovery
What It Does: Captures waste heat from hot flue gases and uses it to preheat the boiler feedwater.
| Parameter | Typical Value |
|---|---|
| Flue Gas Temp (before) | 220°C – 350°C (428°F – 662°F) |
| Flue Gas Temp (after) | 120°C – 180°C (248°F – 356°F) |
| Efficiency Gain | +3% to +7% |
| Applicable To | Fire-tube, water-tube, HRSG |
How It Works: By reducing the temperature difference between the feedwater and steam, less fuel is required to reach boiling point. The hotter the feedwater, the faster and more efficiently the boiler produces steam.
| Benefit | Result |
|---|---|
| Less energy input needed | Lower fuel consumption |
| Shorter steam generation time | Faster boiler response |
| Reduced stack losses | Cleaner exhaust gas |
Economizers are most effective when there’s high delta-T between flue gas and incoming water.
💧 2. Condensers: Latent Heat Recovery (Condensing Boilers Only)
What It Does: Recovers latent heat from water vapor in flue gas by cooling it below dew point (~60°C / 140°F), causing it to condense.
| Applicable Systems | Hot Water / Low-Temp Return Systems |
|---|---|
| Efficiency Gain | +5% to +10% (depending on dew point recovery) |
| Condensate Handling Required? | Yes, acidic moisture must be neutralized |
Mechanism:
In combustion, water vapor forms from hydrogen in fuel.
Normally, this vapor exits as hot steam.
Condensing boilers extract this vapor’s latent heat, adding energy to the system.
| Advantage | Impact |
|---|---|
| Higher total energy capture | Great for heating applications |
| Lower exhaust temps | Enables plastic or PVC flue systems |
| Reduced emissions | Less fuel burned, less NOx & CO₂ |
Condensers are not suited for high-pressure steam systems due to return temp constraints.
⚙️ 3. O₂ Trim Systems: Intelligent Combustion Control
What It Does: Monitors real-time oxygen levels in the flue gas and adjusts burner air supply automatically.
| Target Range | 2% – 4% O₂ in exhaust (optimal) |
| Common Issue Without Trim | 6% – 10% O₂ → Excess air → Heat loss |
| Efficiency Gain | +1% to +3% (consistently) |
| Applicable To | Any fuel-burning boiler (gas/oil/coal)|
How It Works:
Too much air = heat escapes with flue gases.
Too little air = incomplete combustion.
O₂ trim balances combustion for max heat output and minimum fuel waste.
| Key Sensor | Zirconium oxide oxygen sensor |
|---|---|
| Control Type | PID-controlled VFD or burner damper |
O₂ trim systems provide real-time combustion optimization, especially useful under varying loads or fuel quality shifts.
📊 Combined Efficiency Impact Summary
| Technology | Efficiency Gain | Payback Time | When to Use |
|---|---|---|---|
| Economizer | +3% to +7% | 1–3 years | Always recommended for medium-high temp exhausts |
| Condenser | +5% to +10% | 2–5 years | Only for return temps <60°C (condensing boilers) |
| O₂ Trim System | +1% to +3% | <2 years | Variable loads, fuel cost-sensitive environments |
🏭 Real-World Example: Efficiency Stack-Up
| Baseline Fire-Tube Boiler | 80% Efficiency |
|---|---|
| + Economizer Added | 86% Efficiency |
| + O₂ Trim System Installed | 88% Efficiency |
| + Condenser Added (low-temp use) | 93% Efficiency (only for condensing case) |
By combining all three technologies, plants can reduce fuel use by 10%–15%, saving tens of thousands annually.
⚠️ Design Considerations & Limitations
| System Type | Technology Suitability |
|---|---|
| High-pressure Steam (>10 bar) | ❌ Condenser; ✔️ Economizer, ✔️ O₂ Trim |
| Low-temp Hot Water (60°C return) | ✔️ Condenser, ✔️ Economizer |
| Biomass or Solid Fuel Boilers | ✔️ Economizer; O₂ Trim more complex |
| HRSG in Power Plant | ✔️ O₂ Trim + Advanced Heat Recovery |
Conclusion
Optimizing boiler efficiency doesn’t require a complete overhaul—just strategic upgrades. Economizers recover sensible heat from flue gases. Condensers reclaim latent heat from vapor in condensing systems. And O₂ trim systems intelligently manage combustion for minimal loss. These solutions are modular, cost-effective, and proven across industries.
How Does Fuel Type (Gas, Oil, Biomass) Affect Boiler Performance and Efficiency?
Boiler buyers and engineers often underestimate how profoundly fuel type influences system performance. While boiler design and control systems play a key role, the inherent chemical and physical properties of fuels like natural gas, fuel oil, and biomass dictate key factors such as combustion efficiency, heat transfer rate, emissions, ash generation, and maintenance cycles. Selecting the wrong fuel type without understanding these effects can result in reduced efficiency, higher emissions, equipment fouling, and unexpected downtime.
Fuel type affects boiler performance and efficiency through combustion characteristics (e.g., calorific value, moisture content, flame temperature), emissions profile (e.g., CO₂, NOx, particulates), and ash or residue production. Gas typically offers the highest efficiency and cleanest combustion, oil is versatile but higher in emissions, while biomass requires careful design to manage moisture and ash.
Each fuel type presents trade-offs in fuel cost, infrastructure, environmental compliance, and thermal performance. Making the right choice depends on your process goals, emissions limits, and budget.
Gas-fired boilers generally achieve higher efficiency than biomass or oil-fired boilers.True
Natural gas has a high calorific value, burns cleanly, and allows precise combustion control with minimal fouling, contributing to high efficiency.
Biomass boilers produce more ash and require more frequent maintenance than gas boilers.True
Biomass combustion results in higher solid residue and slagging, requiring regular cleaning and ash handling systems.
🔥 Fuel Characteristics That Influence Boiler Efficiency
| Property | Natural Gas | Fuel Oil | Biomass |
|---|---|---|---|
| Calorific Value (HHV) | 38–42 MJ/m³ | 42–45 MJ/kg | 14–21 MJ/kg (varies by type) |
| Moisture Content | <1% (dry gas) | <0.1% | 15%–60% (heavily variable) |
| Ash Content | Negligible | Low (<0.1%) | Moderate to high (1%–10%) |
| Combustion Cleanliness | Very clean | Moderate | Dirty (soot, slag, particulate) |
| Flame Temperature | 1,950°C (high) | 1,800°C (moderate) | 1,300–1,600°C (lower) |
| Fuel Consistency | Uniform | Uniform | Highly variable |
| Emission Control Required | Low | Moderate | High (dust, CO, VOCs, NOx) |
📊 Boiler Efficiency Ranges by Fuel Type
| Fuel Type | Typical Boiler Efficiency (%) | Best Achievable (%) | Notes |
|---|---|---|---|
| Natural Gas | 85% – 92% | Up to 95% (condensing) | Highest due to complete combustion and clean burn |
| Fuel Oil | 80% – 88% | Up to 90% (with excess air control) | Slightly lower due to soot, flame quenching |
| Biomass | 70% – 85% | Up to 88% (well-designed systems) | Efficiency reduced by moisture, fouling |
Biomass systems require pre-drying, ash handling, and combustion air staging to match fossil fuel efficiencies.
🏭 Application Fit by Fuel Type
| Industry | Preferred Fuel | Reason |
|---|---|---|
| Power Generation | Biomass, Gas | Renewable targets (biomass); peaking and base load (gas) |
| Food & Beverage | Natural Gas | Clean burn, low emissions, cost-effective |
| Chemical Processing | Oil or Gas | High-temperature steam, fuel flexibility |
| Textile & Garment | Oil, Biomass | Biomass for cost savings, oil for mid-scale operations |
| District Heating | Biomass, Condensing Gas | Biomass for sustainability, gas for low-return systems |
| Remote Locations | Fuel Oil | Easier to transport and store than gas |
🔧 Design and Maintenance Impact
| Fuel Type | Combustion System Design | Maintenance Frequency | Emissions Equipment |
|---|---|---|---|
| Natural Gas | Simple burners, low NOx heads | Low (monthly checks) | Basic (sometimes no scrubbers needed) |
| Fuel Oil | Atomizing burners, pre-heaters | Moderate (sootblowing, filter changes) | Requires soot collectors or ESPs |
| Biomass | Grate/stoker/CFB or fluidized bed | High (ash removal, clinker control) | Cyclones, bag filters, scrubbers |
Biomass systems typically require automated ash removal, robust refractory lining, and frequent inspections due to fuel variability and slagging.
🧪 Emission Profile by Fuel
| Pollutant | Gas | Oil | Biomass |
|---|---|---|---|
| CO₂ | Lower per unit | Higher | Neutral (renewable cycle) |
| NOx | Moderate | High | Low to moderate (depends on temp) |
| SOx | Negligible | High (with sulfur oils) | Very low |
| Particulate | Very low | Low | High (requires filters) |
| VOCs | Low | Moderate | Can be high if incomplete burn |
📐 Case Study: Biomass vs. Gas Boiler in District Heating
| Parameter | Biomass Boiler | Gas Boiler |
|---|---|---|
| Rated Output | 5 MW | 5 MW |
| Efficiency | 82% | 92% |
| Fuel Cost ($/MMBtu) | $4.50 | $8.00 |
| Annual Fuel Cost | ~$660,000 | ~$960,000 |
| O&M Costs (annual) | $180,000 (ash, filters) | $60,000 (simple upkeep) |
| CO₂ Emissions | Net-zero (renewable) | 7,000+ tons/year |
Biomass is more cost-effective but requires more complex O&M and capital investment.
⚙️ Summary Comparison Table
| Fuel Type | Efficiency | Operating Cost | Maintenance Need | Environmental Impact |
|---|---|---|---|---|
| Natural Gas | ⭐⭐⭐⭐⭐ | ⭐⭐⭐ | ⭐ | ⭐⭐⭐⭐ |
| Fuel Oil | ⭐⭐⭐⭐ | ⭐⭐ | ⭐⭐ | ⭐⭐ |
| Biomass | ⭐⭐⭐ | ⭐⭐⭐⭐ | ⭐⭐⭐⭐ | ⭐⭐⭐⭐⭐ |
Conclusion
Fuel selection has direct consequences on boiler efficiency, performance, emissions, and maintenance. Natural gas provides the highest efficiency and cleanest burn, ideal for regulated environments. Fuel oil offers versatility and high temperature capability but at a cost of higher emissions and maintenance. Biomass, while environmentally renewable and low in CO₂ impact, demands specialized system design and higher upkeep to achieve reliable performance.
What Role Does Regular Maintenance Play in Maintaining High Boiler Efficiency?
Even the most advanced and efficient boiler systems lose performance over time without regular maintenance. Fouling, soot buildup, sensor drift, water impurities, and wear on mechanical components slowly erode efficiency. As a result, fuel consumption rises, emissions increase, and unexpected shutdowns become more likely. To preserve optimal thermal transfer and combustion quality, routine inspection, cleaning, and calibration are not optional—they are essential.
Regular boiler maintenance preserves high efficiency by preventing fouling, maintaining proper combustion, ensuring heat transfer surfaces stay clean, optimizing control system accuracy, and reducing unplanned downtime. A well-maintained boiler can operate at 90%+ efficiency, while a neglected system may drop below 75%.
Scheduled upkeep directly reduces operational costs, extends equipment life, and ensures safety compliance—making it a critical component of any high-performance boiler operation.
Boiler efficiency naturally increases over time as the system becomes seasoned.False
Efficiency typically decreases over time due to fouling, sensor drift, and component wear unless actively maintained.
Routine boiler maintenance helps reduce fuel consumption and prevent major breakdowns.True
Maintenance prevents efficiency loss from soot buildup and keeps safety and control systems functioning correctly.
🔧 Key Maintenance Activities That Support Boiler Efficiency
| Maintenance Task | Impact on Efficiency | Recommended Frequency |
|---|---|---|
| Burner Tuning & O₂ Calibration | Ensures correct air-fuel ratio; prevents heat loss | Monthly to Quarterly |
| Flue Gas Analysis | Detects excess air or incomplete combustion | Monthly |
| Economizer Cleaning | Maximizes heat recovery from flue gases | Quarterly or Semiannually |
| Tube Descaling & Soot Blowing | Restores thermal conductivity in heat exchanger | Weekly to Monthly |
| Feedwater Quality Monitoring | Prevents scaling and corrosion inside tubes | Daily |
| Safety Valve Testing | Ensures safe pressure limits, avoids inefficiencies | Annually |
| Control System Calibration | Keeps sensors and actuators operating accurately | Monthly to Semiannually |
| Blowdown Valve Operation | Removes sludge that can insulate heating surfaces | Daily (surface), Weekly (bottom) |
📊 Maintenance and Efficiency Correlation
| Maintenance Status | Typical Efficiency | Fuel Cost Impact |
|---|---|---|
| Regularly Maintained (Best) | 88% – 92% | Lowest fuel cost, stable output |
| Moderately Maintained | 80% – 85% | +5–10% fuel use per year |
| Poorly Maintained | 70% – 78% | Up to 20% higher fuel expense |
| Neglected / Breakdown-Prone | <70% | Frequent repairs, high downtime |
A 5% drop in boiler efficiency can lead to thousands of dollars in wasted fuel each month, depending on capacity.
🏭 Efficiency Maintenance Case Study
| Industry | Boiler Type | Before Maintenance | After Maintenance | Improvements |
|---|---|---|---|---|
| Textile Plant | 10 TPH Fire-tube | 78% | 86% | Soot cleaned, burner tuned, O₂ reset |
| Food Processor | 6 TPH Water-tube | 81% | 89% | Economizer cleaned, scale removed |
| Chemical Facility | 15 TPH Water-tube | 83% | 91% | Blowdown optimized, flue gas balanced |
Regular maintenance in each case saved $10,000–$30,000 annually in fuel costs and improved uptime reliability.
⚙️ Common Efficiency Loss Points Without Maintenance
| Neglected Area | Resulting Problem | Efficiency Impact |
|---|---|---|
| Burner/O₂ System | Excess air, flame instability | -3% to -8% |
| Economizer Surface | Fouled tubes reduce heat recovery | -2% to -5% |
| Steam Trap/Blowdown | Carryover or scale formation | -1% to -4% |
| Feedwater Hardness | Internal scaling reduces conductivity | -4% to -10% |
| Control Drift (sensors) | Inaccurate modulation, short cycling | -2% to -6% |
🧠 Maintenance Program Elements That Drive Results
| Program Element | Why It Matters |
|---|---|
| Scheduled Service Logs | Tracks all inspection and cleaning intervals |
| Digital Monitoring | Enables predictive alerts before efficiency drops |
| Thermal Imaging | Identifies hidden fouling or insulation loss |
| Training for Operators | Helps identify small issues before they grow |
| Service by Certified Technicians | Ensures system is tuned to spec |
Combine manual checks with automated diagnostics for best performance continuity.
💡 Tools and Tech That Support Efficient Maintenance
| Tool/Tech | Efficiency Benefit |
|---|---|
| Portable Flue Gas Analyzer | Tracks combustion quality and O₂ levels |
| Smart Blowdown Controllers | Prevent energy loss while managing TDS |
| Remote Monitoring Platforms | Real-time alerts for heat transfer issues |
| Soot Blower Automation | Timed or sensor-based fouling removal |
| Water Softening Systems | Prevents scale and internal corrosion |
Conclusion
Without a proactive maintenance plan, boiler efficiency can drop by 10–20% within just one year, resulting in substantial fuel waste, costly downtime, and reduced equipment lifespan. Regular inspection, burner tuning, heat exchanger cleaning, and control system calibration are vital to keeping your boiler running at peak efficiency. When performed consistently, maintenance becomes a profit multiplier rather than a cost center.
How Can Facilities Monitor and Optimize Boiler Efficiency in Real Time?
In many facilities, boiler systems account for 30% to 60% of total energy use, yet efficiency losses often go undetected until fuel bills spike or production suffers. Relying solely on periodic inspections or outdated meters leaves operators blind to real-time inefficiencies like excess air, scaling, or fluctuating load mismatches. To truly optimize fuel use, reduce emissions, and maintain output quality, modern plants must monitor boiler performance continuously and proactively.
Facilities can monitor and optimize boiler efficiency in real time using a combination of digital sensors (for fuel, flue gas, steam, and feedwater), smart control systems (like O₂ trim, variable frequency drives, and PLCs), and centralized monitoring platforms that analyze data to trigger immediate adjustments or alerts.
Real-time efficiency monitoring allows immediate corrective action, improved decision-making, and automated optimization based on current operating conditions, ensuring peak boiler performance 24/7.
Boiler efficiency can only be evaluated during scheduled shutdowns or manual checks.False
Real-time monitoring tools allow boiler efficiency to be tracked continuously using live sensor data and automated systems.
Digital boiler monitoring systems can detect combustion inefficiencies and trigger automatic control adjustments.True
Smart systems like O₂ trim and PLC-integrated controls respond to real-time data to optimize air-fuel ratios and load balance.
📊 Real-Time Boiler Monitoring: Key Parameters and Sensors
| Parameter Monitored | Sensor Type | Efficiency Relevance |
|---|---|---|
| Flue Gas Temperature | Thermocouples | Indicates stack heat loss; high temp = wasted heat |
| Oxygen (O₂) in Flue Gas | Zirconia O₂ sensors | Detects excess air or poor combustion |
| Fuel Flow Rate | Mass or volumetric fuel meters | Tracks energy input |
| Steam Output (Mass Flow) | Ultrasonic or differential pressure | Measures usable energy output |
| Feedwater Temperature | RTDs or thermocouples | Helps assess economizer effectiveness |
| Boiler Pressure/Temp | Pressure transducers, RTDs | Ensures steam parameters are in spec |
| TDS/Blowdown Conductivity | Electrochemical conductivity probes | Manages water quality to prevent scaling |
These measurements feed into efficiency formulas, such as:
Boiler Efficiency = (Steam Output Energy – Blowdown Losses) / Fuel Input Energy × 100%
⚙️ Smart Technologies That Enable Real-Time Optimization
| Technology | Function | Efficiency Benefit |
|---|---|---|
| O₂ Trim Control | Auto-adjusts combustion air based on flue O₂ levels | +1%–3% fuel savings |
| Variable Frequency Drives (VFDs) | Modulates pump/fan speeds to match demand | Reduced electrical and thermal waste |
| PID-Controlled Burner Modulation | Matches burner output to load profile in real time | Minimizes overshoot/undershoot |
| Boiler Management System (BMS) | Central control and safety logic for boiler components | Prevents overfiring and idle loss |
| SCADA Integration | Visualizes all data and sends alerts or logs for audit | Proactive maintenance and control |
🧠 Real-Time Monitoring Platform Dashboard Example
| Live Data Point | Target Range | Action Triggered When Outside Range |
|---|---|---|
| Flue Gas Temp | 120–180°C | Alert: Economizer fouling or incorrect load setting |
| O₂ in Flue Gas | 2.5%–4.5% | Auto-adjust burner air supply via O₂ trim |
| TDS in Blowdown | <3,000 ppm | Auto-blowdown valve opens; notification logged |
| Steam Flow vs. Fuel Input | Constant ratio trend | Efficiency drop triggers maintenance request |
| Burner On/Off Cycles | <6 per hour | Excess cycling alerts need for modulation tuning |
Dashboards may also visualize historical efficiency trends, emissions, and energy KPIs, aiding long-term analysis and sustainability reporting.
🏭 Case Study: Efficiency Gains Through Live Monitoring
Facility: Mid-size pharmaceutical plant
Boiler Type: 4 TPH water-tube boiler (natural gas)
Initial State: 81% operating efficiency, high stack temperature
Interventions:
Installed real-time flue gas analyzer
Deployed SCADA-integrated boiler control module
Tuned burner with O₂ trim system
Result:Improved average efficiency to 89%
Reduced monthly fuel cost by $6,800
Decreased flue temp by 60°C
Maintenance frequency reduced due to early warnings
📉 What Happens Without Real-Time Monitoring?
| Without Monitoring | Consequence |
|---|---|
| Flue gas temperature drifts high | Hidden energy loss (every +40°C = ~1% loss) |
| Excess air undetected | Combustion losses increase; burner efficiency drops |
| Scaling not caught early | Reduced heat transfer and pressure buildup |
| Sensor drift | Faulty readings lead to incorrect modulation |
| No alerts on fault events | Small issues escalate into expensive failures |
✅ Benefits of Real-Time Efficiency Monitoring
| Category | Benefits |
|---|---|
| Energy Efficiency | 5%–15% improvement in real-time optimization |
| Fuel Cost Savings | Direct reduction in natural gas, oil, or biomass usage |
| Reduced Emissions | More complete combustion = lower CO₂, NOx, and VOC output |
| Fewer Downtime Events | Early fault detection leads to preventive maintenance |
| Operational Insight | Historical performance data improves future planning and upgrades |
💻 Recommended Real-Time Monitoring Tools
| System/Tool | Use |
|---|---|
| Boiler Efficiency Calculators (Online/SCADA) | Auto-calculate efficiency per load cycle |
| Honeywell/Siemens O₂ Trim Kits | Integrate with burners and flue sensors |
| SCADA or HMI Dashboards | Centralize and visualize boiler metrics |
| Energy Management Software (EMS) | Tracks fuel-to-steam conversion trends |
| Mobile Alert Apps | Sends texts/emails when KPIs go out of bounds |
Conclusion
Real-time boiler monitoring transforms boiler management from reactive guesswork into data-driven optimization. By combining intelligent sensors, adaptive control systems, and centralized dashboards, facilities can maintain high combustion and thermal efficiency, reduce fuel waste, and stay ahead of maintenance issues. With today’s technology, every steam plant—large or small—can unlock peak boiler performance around the clock.
🔍 Conclusion
Industrial boilers can achieve efficiencies of 80% to 95%, depending on design and system configuration. Understanding the factors that influence efficiency helps facilities reduce energy costs, enhance sustainability, and comply with emissions standards.
📞 Contact Us
💡 Looking to improve your boiler’s efficiency or choose the right high-efficiency model? We provide efficiency audits, system upgrades, and custom boiler solutions tailored to your energy-saving goals.
🔹 Let us help you achieve maximum boiler efficiency—with smart design, integration, and support. 🔥📊♻️✅
FAQ
What is the typical efficiency of an industrial boiler?
Industrial boilers generally achieve thermal efficiencies between 80% and 95%, depending on their design, fuel type, and operating conditions:
Standard fire-tube boilers: 80%–85%
Water-tube boilers: 85%–90%
Condensing or high-efficiency boilers: Up to 95%
Supercritical boilers (power plants): 40%–47% thermal-to-electric efficiency
Actual performance varies based on load, maintenance, and system integration.
What factors influence industrial boiler efficiency?
Key variables include:
Fuel type and combustion efficiency
Boiler design (fire-tube vs. water-tube)
Steam pressure and temperature
Excess air and combustion air temperature
Insulation and heat loss prevention
Blowdown rates and water treatment
Heat recovery systems (economizers, condensate return)
Consistent tuning and monitoring are essential for maintaining peak efficiency.
How is boiler efficiency measured?
There are two main methods:
Direct Method:
Efficiency = (Heat Output ÷ Heat Input) × 100
Simple and widely used, this compares fuel input vs. steam output.Indirect Method:
Efficiency = 100 – Sum of individual heat losses
More detailed, this method accounts for flue gas loss, radiation, blowdown, etc.
Efficiency audits help identify performance gaps and upgrade opportunities.
What technologies help improve boiler efficiency?
Efficiency-enhancing technologies include:
Economizers – Recover flue gas heat for feedwater preheating
Condensate recovery systems – Reduce fresh water and fuel usage
O2/CO2 trim controls – Optimize combustion air-fuel ratio
Variable-speed drives – Match pump/fan output to demand
High-efficiency burners – Ensure complete combustion
Real-time monitoring software – Detect inefficiencies and alert operators
Combined, these systems can boost efficiency by 5%–15% or more.
Can higher efficiency lower operational costs?
Yes. Even small efficiency gains lead to significant fuel cost savings over time. For example:
A 1% efficiency increase in a 500 HP boiler can save thousands annually
Improved efficiency reduces carbon emissions and environmental compliance costs
Reduced fuel consumption = lower operational risk and longer boiler lifespan
High-efficiency upgrades typically deliver a 2–5 year ROI.
References
Cleaver-Brooks – Boiler Efficiency Facts – https://www.cleaverbrooks.com
Spirax Sarco – Improving Steam Boiler Efficiency – https://www.spiraxsarco.com
Powerhouse – Boiler Efficiency Guide – https://www.powerhouse.com
Thermodyne Boilers – Efficiency Optimization – https://www.thermodyneboilers.com
Hurst Boiler – High-Efficiency Boiler Systems – https://www.hurstboiler.com
Miura Boiler – Real-Time Efficiency Monitoring – https://www.miuraboiler.com
IEA – Boiler Energy Efficiency Improvements – https://www.iea.org
BioEnergy Consult – Boiler Heat Recovery – https://www.bioenergyconsult.com
ASHRAE – Boiler System Performance Standards – https://www.ashrae.org
EPA – Industrial Boiler Emission & Efficiency Guidelines – https://www.epa.gov

