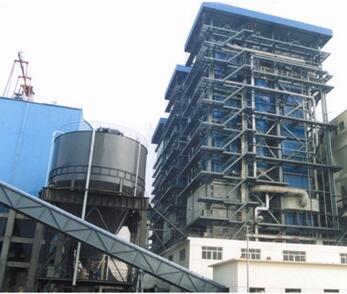
Investing in a power plant boiler is a major capital decision that directly affects project feasibility, long-term efficiency, and return on investment. Many plant owners underestimate how design, capacity, fuel type, and system configuration can dramatically influence overall cost — leading to budget overruns or performance shortfalls.
The price of a power plant boiler varies widely, typically ranging from $1.5 million to over $20 million, depending on capacity (10–500 t/h), pressure level, fuel type (coal, gas, biomass, or waste), efficiency grade, and the inclusion of auxiliary systems such as economizers, superheaters, and emission control devices. Other cost factors include engineering design, site conditions, transportation, installation, and automation systems. Understanding these key cost drivers helps investors make accurate, value-based decisions.
By analyzing the main factors affecting boiler price, decision-makers can balance initial investment with operational performance and lifecycle cost.
How Does Boiler Capacity and Steam Pressure Affect Total Cost?
When planning an industrial or utility boiler investment, the most decisive cost factors are almost always boiler capacity (steam output) and steam pressure level. These two parameters determine not only the size and complexity of the equipment but also the materials, safety systems, auxiliary components, and installation requirements needed to meet performance and compliance standards. Many buyers underestimate how dramatically a small increase in capacity or pressure can multiply total project cost.
In short:
Larger boiler capacity and higher steam pressure directly increase total cost due to thicker pressure parts, stronger materials, higher safety ratings, and more complex auxiliary systems required to handle elevated thermal and mechanical stresses.
Boiler cost scales linearly with capacity and pressure.False
In reality, cost growth is exponential due to material strength, fabrication complexity, and safety system requirements.
Higher steam pressure requires more robust materials and thicker tube walls, increasing fabrication and testing costs.True
High-pressure boilers must meet ASME Section I or EN 12952 design codes, which mandate stronger alloy steels and more extensive quality assurance.
1. Influence of Capacity (Steam Output) on Boiler Cost
Boiler capacity—usually measured in tons of steam per hour (t/h) or megawatts (MW)—is a direct reflection of plant energy demand. As capacity increases, so do the dimensions, material thickness, number of tubes, and ancillary systems such as feedwater pumps and draft fans.
| Steam Capacity (t/h) | Typical Application | Base Cost Range (USD) | Cost Trend |
|---|---|---|---|
| 1–10 | Small industrial (food, textile) | $60,000–$350,000 | Linear |
| 10–35 | Medium process / heating plant | $350,000–$900,000 | Gradual |
| 35–75 | Large industrial plant | $0.9–$2.5 million | Exponential |
| 75–150 | Utility or cogeneration | $2.5–$6 million | Steep |
| >150 | Power generation | $6–$15+ million | Custom design |
Observation:
Every doubling of steam output tends to increase cost by 1.5× to 1.8×, due to the need for larger heat transfer surfaces, heavier structures, and stronger foundations.
Excel-Ready Formula:Estimated Cost = Base_Cost × (Capacity / Reference_Capacity)^n
Typical n = 0.6–0.8, depending on boiler type and design pressure.
2. Effect of Steam Pressure on Boiler Investment
Steam pressure dictates not only the thermal energy delivered per kilogram of steam but also the mechanical stresses acting on the boiler structure. Higher pressure requires thicker tubes, drum shells, and stronger welds, often involving chromium-molybdenum alloy steels and rigorous ASME/EN inspections.
| Pressure Range (MPa) | Boiler Type | Design Complexity | Material Requirement | Relative Cost Increase |
|---|---|---|---|---|
| <1.6 | Low pressure (heating) | Simple | Carbon steel | Baseline (×1.0) |
| 1.6–3.9 | Medium pressure | Moderate | SA-210, SA-516 | ×1.2–1.4 |
| 4.0–9.8 | High pressure (process) | Complex | 1–1.25Cr–0.5Mo alloy | ×1.6–2.0 |
| 10–18 | Subcritical/CFB | Advanced | 2.25Cr–1Mo | ×2.5–3.5 |
| >22 | Supercritical/USC | Ultra-complex | 9–12Cr ferritic/martensitic steels | ×4.0–5.5 |
At higher steam pressures (>9 MPa), fabrication must follow tighter tolerances and radiographic weld inspections (RT100%), adding both cost and time to manufacturing.
3. Capacity–Pressure Interaction: The Compounding Cost Effect
The cost influence of capacity and pressure is not additive but multiplicative—a high-capacity, high-pressure boiler requires both large-scale fabrication and high-grade materials.
| Case | Steam Output (t/h) | Pressure (MPa) | Approx. Cost (USD) |
|---|---|---|---|
| A | 10 | 1.0 | $200,000 |
| B | 10 | 6.4 | $320,000 |
| C | 35 | 6.4 | $950,000 |
| D | 75 | 9.8 | $2.7 million |
| E | 150 | 16.5 | $6.8 million |
Key Insight:
Going from 10 t/h at 1 MPa to 150 t/h at 16.5 MPa raises cost by >30×, primarily due to materials, manufacturing standards, and auxiliary integration.
4. Technical Reasons for Cost Escalation
| Design Factor | Impact on Cost | Explanation |
|---|---|---|
| Tube Wall Thickness | +15–25% | Needed for high pressure; increases material and welding cost. |
| Alloy Materials (Cr-Mo, Inconel) | +20–35% | For strength, oxidation resistance at >500°C. |
| Welding & QA Procedures | +10–20% | Full RT/UT, hydrostatic tests, ASME stamps. |
| Drum Diameter & Wall Stress | +15% | Larger pressure drum requires stronger shell. |
| Heat Transfer Area | +10–25% | Increased steam generation needs more tubes and surface area. |
| Safety Valves & Controls | +5–10% | Higher pressure requires certified components. |
In high-pressure designs, the boiler drum alone can account for 20–30% of total equipment cost, especially when using alloy steels like SA-387 Grade 11/22 or T91/T92.
5. Example: Cost Scaling for 10–100 t/h Boilers
| Capacity (t/h) | Pressure (MPa) | Efficiency (%) | Estimated Equipment Cost (USD) | Total Installed Cost (USD) |
|---|---|---|---|---|
| 10 | 1.6 | 88 | $180,000 | $350,000 |
| 25 | 3.9 | 90 | $450,000 | $800,000 |
| 50 | 6.4 | 92 | $1,000,000 | $1,850,000 |
| 75 | 9.8 | 93 | $1,850,000 | $3,200,000 |
| 100 | 13.0 | 94 | $2,700,000 | $4,900,000 |
As seen above, efficiency gains at higher pressure levels (due to higher steam enthalpy) are partly offset by the rapidly rising capital cost. Optimal design requires balancing thermal efficiency with financial feasibility.
6. Economic Evaluation: Finding the Optimum Pressure
Excel Formula for Levelized Cost of Steam (LCOS):LCOS ($/t) = (Capital_Cost × CRF + O&M_Cost + Fuel_Cost × (1 - η_boiler)) / Steam_Production
Where:
CRF= Capital recovery factor = i(1+i)^n / ((1+i)^n – 1)η_boiler= Boiler efficiencySteam_Production= Annual steam output (tons/year)
By applying this to different design pressures, engineers can determine where total lifecycle cost (fuel + capital + O&M) reaches a minimum—typically between 6–10 MPa for industrial power boilers.
7. Real Case Comparison
A petrochemical plant compared two boiler designs for a 50 t/h system:
| Parameter | Medium Pressure | High Pressure |
|---|---|---|
| Design Pressure | 4.0 MPa | 9.8 MPa |
| Efficiency | 90% | 93% |
| Equipment Cost | $950,000 | $1,650,000 |
| Fuel Savings | — | $70,000/year |
| Payback Period | — | ~10.0 years |
Although the high-pressure unit was more efficient, the higher capital cost led to longer payback, making the 4.0 MPa design more economical for process steam applications.
8. Summary Table – Key Relationships
| Factor | Effect on Cost | Reason |
|---|---|---|
| Higher Capacity | Exponential increase | Larger heat transfer area, thicker structure |
| Higher Pressure | Exponential increase | Stronger alloys, more QA/QC |
| Efficiency | Slightly increases | Improved heat transfer surfaces |
| Safety Standards | Increases | More certification and inspection steps |
| Installation & Auxiliaries | Scales with size | Heavier cranes, larger pumps, more complex piping |
9. Conclusion
Boiler capacity and steam pressure are fundamental cost drivers that scale non-linearly with design complexity. Increasing either variable not only raises material and fabrication expenses but also amplifies the demands on auxiliaries, control systems, and compliance testing. The best investment strategy balances thermal efficiency gains with capital affordability through a detailed techno-economic analysis.
Why Does Fuel Type (Coal, Gas, Biomass, Oil) Have a Major Impact on Boiler Price?
In industrial boiler projects, fuel type selection is one of the most decisive factors influencing total cost. Choosing between coal, gas, biomass, or oil determines not only the initial purchase price but also lifetime operating expenses, maintenance requirements, and environmental compliance costs. The reason is that every fuel type demands distinct combustion technology, materials, and auxiliary systems to ensure safe, efficient, and clean operation.
In summary, fuel type affects boiler cost because it defines the entire combustion system design, material selection, emission control setup, and long-term operating costs. Cleaner fuels like natural gas reduce capital cost and maintenance, while solid fuels like coal and biomass require more complex systems and higher investment.
Every industrial operator must therefore analyze fuel availability, price stability, emissions compliance, and maintenance capacity before finalizing a boiler fuel type—because these choices impact both CAPEX and OPEX over the entire service life.
Fuel type has only a small effect on the price of an industrial boiler.False
Fuel type directly determines furnace design, emission systems, and maintenance needs—making it one of the strongest cost drivers.
1. Combustion System Complexity
Each fuel type requires different combustion and heat-exchange arrangements, which directly changes the design cost.
| Fuel Type | Combustion Technology | System Complexity | Relative Equipment Cost Impact |
|---|---|---|---|
| Coal | Pulverized coal or fluidized bed | Very High | +60–80% |
| Biomass | Moving grate or fluidized bed | High | +40–70% |
| Oil | Atomizing burner | Medium | +20–40% |
| Natural Gas | Premix/modulating burner | Low | +10–25% |
Coal and biomass boilers require large furnaces, ash removal, and refractory linings, while gas boilers use simpler and cleaner systems—making them cheaper to install and maintain.
2. Material and Corrosion Resistance Requirements
The chemical composition of the fuel determines flue gas acidity, ash content, and temperature corrosion risk.
| Fuel | Corrosion Risk | Required Materials | Effect on Cost |
|---|---|---|---|
| Coal | High (sulfur, ash) | Alloy steel, refractory | +25% |
| Biomass | High (chlorides, alkalis) | Anti-fouling coatings | +20% |
| Oil | Moderate (sulfur) | Carbon steel + anti-corrosion layer | +10% |
| Gas | Low | Standard carbon steel | 0% baseline |
Natural gas’s clean combustion allows use of low-cost carbon steel, while solid fuels need expensive corrosion-resistant alloys.
3. Emission Control and Compliance Costs
Each fuel type produces different pollutants—impacting the cost of emission control systems.
| Fuel Type | Major Pollutants | Required Controls | Added Cost Range |
|---|---|---|---|
| Coal | SO₂, NOₓ, PM | ESP/bag filter + scrubber + low-NOₓ burner | +30–60% |
| Biomass | Dust, CO | Multicyclone + secondary air | +20–40% |
| Oil | SO₂, NOₓ | Low-NOₓ burner + optional scrubber | +10–25% |
| Gas | Mainly NOₓ | Low-NOₓ or staged burner | +5–10% |
Solid fuels require flue gas desulfurization (FGD) and dust filtration, which increase both CAPEX and maintenance cost.
4. Fuel Handling and Storage Infrastructure
The physical state of the fuel dictates how it is transported, stored, and fed into the boiler.
| Fuel Type | Handling System | Infrastructure Cost Impact |
|---|---|---|
| Coal | Conveyors, crushers, silos, ash removal | +20–30% |
| Biomass | Feed screws, dryers, silos | +15–25% |
| Oil | Tanks, pumps, filters | +10–15% |
| Gas | Pipeline, regulators | +5–10% |
Gas-fired systems are the simplest—no solid handling or on-site storage—making them faster and cheaper to install.
5. Operating Cost and Efficiency Impact
| Fuel Type | Fuel Efficiency (%) | Fuel Cost ($/GJ) | O&M Cost ($/t steam) | Relative Total Lifecycle Cost |
|---|---|---|---|---|
| Natural Gas | 92–98 | 8–14 | 2–4 | ★ Lowest |
| Oil | 88–94 | 12–18 | 3–5 | ★★ Medium |
| Biomass | 80–90 | 4–9 | 6–10 | ★★★ Medium-High |
| Coal | 78–88 | 3–6 | 8–12 | ★★★★ Highest |
Even though coal or biomass fuels are cheaper per GJ, their efficiency losses, ash disposal, and maintenance frequency make total costs higher in long-term operation.
6. Real-World Example: 20 t/h Industrial Boiler
| Fuel Type | Installed Cost (USD) | Efficiency (%) | Annual O&M ($) | Emission Compliance Need |
|---|---|---|---|---|
| Coal | 1,500,000–2,200,000 | 85 | 200,000 | High |
| Biomass | 1,300,000–2,000,000 | 88 | 160,000 | Medium |
| Oil | 1,000,000–1,500,000 | 90 | 120,000 | Medium |
| Gas | 800,000–1,200,000 | 95 | 80,000 | Low |
Conclusion
Fuel type determines furnace design, materials, emission systems, fuel logistics, and operational efficiency—making it the most powerful factor shaping boiler price and lifecycle economics.
When evaluating investment, consider not only CAPEX but also fuel supply reliability, regulatory environment, and total cost of ownership (TCO) over 15–25 years.
How Do Design Standards and Material Quality Influence Product Pricing?
In today’s highly competitive manufacturing landscape, customers and suppliers alike face a difficult balance between cost and quality. When design standards are low or materials are subpar, products often fail prematurely, leading to expensive replacements, downtime, and damaged brand reputation. Conversely, strict adherence to design standards and the use of high-quality materials increase initial costs but significantly enhance long-term value, performance, and customer trust. The solution lies in understanding how both design and material quality interact to shape pricing—allowing decision-makers to make investments that truly pay off over time.
Design standards and material quality are two of the most critical factors determining product pricing because they directly affect durability, performance, compliance, and production efficiency. High design standards demand precision engineering, testing, and certification—raising development costs but ensuring reliability and safety. Similarly, using superior materials increases raw material expenses but reduces lifecycle costs, warranty claims, and maintenance. Therefore, pricing reflects not just production costs but the embedded value of compliance, longevity, and performance that customers ultimately receive.
Understanding this relationship helps buyers and manufacturers align expectations. Customers often assume that higher prices simply mean higher margins, but in practice, most of the price differential is due to compliance with engineering standards, certifications, and material grade specifications. The following sections explain how each component—design standards and material quality—affects pricing structure, manufacturing complexity, and end-user satisfaction.
Higher design standards always lead to excessive product pricing.False
While advanced standards can increase initial costs, they often reduce lifecycle expenses and improve reliability, making overall ownership more economical.
Low-quality materials can reduce prices without major performance loss.False
Inferior materials may lower upfront costs but often result in reduced lifespan, higher maintenance, and non-compliance penalties.
The Interrelationship Between Design Standards and Cost Formation
Design standards dictate the engineering precision, safety parameters, and compliance frameworks a product must satisfy. For instance, international standards such as ISO 9001, ASTM, or EN define how dimensions, tolerances, and load-bearing requirements should be achieved. Meeting these benchmarks requires additional R&D investment, skilled labor, and specialized equipment. Manufacturers adopting these standards cannot rely on shortcuts, as deviations might lead to rejections or failure in certification testing. In cost analysis, about 20–35% of a product’s total price can be attributed to compliance and quality assurance activities tied to these standards.
| Design Factor | Cost Impact (%) | Description |
|---|---|---|
| Certification & Compliance | 10–15% | Includes testing, documentation, and audits |
| Engineering Design Optimization | 5–10% | Covers CAD development, simulations, and prototyping |
| Standardized Component Integration | 3–5% | Ensures interoperability and interchangeability |
| Quality Control & Inspections | 2–5% | Reduces defects, enhances performance reliability |
When a manufacturer aligns production with rigorous standards, it ensures global compatibility, ease of export, and reduced risk in installation or operation. For example, a piping manufacturer using ISO 4427 for HDPE pipes can guarantee consistent wall thickness and pressure ratings, eliminating the risk of leaks and failures that could cause extensive damage. Thus, while the price per unit may be higher, the total cost of ownership (TCO) remains substantially lower.
Material Quality: The Core of Value-Based Pricing
Material selection often represents 50–70% of total production cost, making it the largest determinant of pricing. However, not all materials are equal—even within the same class. A grade-316 stainless steel product costs more than grade-304, yet its corrosion resistance in marine environments dramatically increases lifespan, thereby reducing total maintenance. Similarly, polymer-based materials with UV stabilization, flame retardancy, or chemical resistance command higher prices because they ensure reliability under harsh operational conditions.
| Material Type | Cost Multiplier vs. Standard Grade | Expected Lifespan Increase (%) | Example Use Case |
|---|---|---|---|
| High-Grade Alloy Steel | 1.8x | 60–80% | Structural components in heavy industries |
| UV-Resistant Polyethylene | 1.5x | 50–70% | Outdoor piping systems |
| Reinforced Composites | 2.3x | 100–150% | Aerospace and high-stress parts |
| Food-Grade Stainless Steel | 1.7x | 40–60% | Food processing and medical equipment |
The implication is clear: while material quality raises the cost per kilogram, it simultaneously improves performance, safety, and product life cycle. High-quality inputs also reduce hidden costs such as rework, warranty claims, and customer dissatisfaction.
Hidden Costs of Poor Standards and Materials
A significant yet often overlooked factor is the “hidden cost” of neglecting standards or material integrity. Poor design decisions can lead to field failures, recalls, or legal liabilities due to non-compliance. For example, the use of substandard insulation materials in electrical systems might initially save 15% in costs but could result in safety hazards or fire risks, leading to catastrophic losses. Thus, manufacturers aiming to build a strong brand reputation view quality investments as strategic capital rather than avoidable expenses.
Case Study: Industrial Pump Manufacturing
An industrial pump manufacturer compared two production batches—one following API 610 standards and using AISI 316 steel, and the other following internal specifications with lower-grade carbon steel. The standard-compliant batch cost 27% more initially but showed a 55% longer mean time between failures (MTBF) and reduced maintenance downtime by 40%. Over five years, the standard-compliant model’s TCO was 23% lower, validating that the higher upfront investment yielded tangible long-term economic benefits.
Balancing Design Standards, Materials, and Market Position
Manufacturers must balance these factors strategically. Premium segments justify high material and design costs through enhanced branding, warranties, and performance assurance. However, for budget markets, optimization can be achieved through intelligent engineering rather than material downgrades—such as using finite element analysis (FEA) to reduce excess weight without sacrificing structural integrity.
| Market Segment | Typical Design Standard | Material Grade | Pricing Strategy |
|---|---|---|---|
| Budget | Local/Basic | Medium | Volume-driven |
| Mid-range | Regional/EN | High | Value-driven |
| Premium | ISO/API/ASTM | Premium | Performance-driven |
Conclusion
In essence, both design standards and material quality act as the foundation of responsible pricing. They are not merely cost factors but reflect the embedded reliability, performance, and trust a manufacturer offers. Customers should view higher prices not as a deterrent but as an indicator of a product built to meet long-term functional and safety expectations.

How Do Auxiliary Systems and Emission Controls Influence Boiler Cost?
Industrial and commercial boilers represent one of the most capital-intensive investments in energy and process industries. Yet, many decision-makers focus solely on the boiler’s rated capacity or efficiency while underestimating the substantial cost contributions from auxiliary systems and emission controls. When auxiliary systems—such as feedwater treatment, combustion air fans, and condensate recovery—are inadequately designed or emission controls are neglected, the results are severe: higher fuel consumption, environmental non-compliance, operational downtime, and potential legal penalties. The solution lies in understanding how these subsystems interact with the boiler core to influence both upfront capital expenditure (CAPEX) and total operating cost (OPEX).
Auxiliary systems and emission controls significantly influence boiler cost because they determine the system’s efficiency, environmental compliance, and reliability. Auxiliary systems (like pumps, blowers, water treatment units, and fuel handling equipment) can represent 25–40% of total installation costs, while emission control systems (such as scrubbers, electrostatic precipitators, and NOx reduction units) can add another 15–30%, depending on fuel type and emission limits. Together, they form the backbone of sustainable and regulatory-compliant boiler operation, directly impacting lifecycle cost, energy efficiency, and environmental footprint.
Recognizing these cost components allows project planners, plant managers, and procurement teams to make informed investment decisions. The following sections break down how auxiliary systems and emission controls contribute to both initial and operational costs, and how optimized integration can yield long-term financial and ecological benefits.
Emission control systems are optional add-ons that do not significantly affect boiler performance.False
Emission controls are mandatory in most regions and directly affect boiler efficiency, fuel optimization, and regulatory compliance.
Auxiliary systems are minor accessories with minimal impact on boiler cost.False
Auxiliary systems can account for up to 40% of total system cost and are essential for safe, efficient, and continuous boiler operation.
Understanding the Role of Auxiliary Systems in Boiler Economics
Auxiliary systems are integral subsystems that support the main boiler unit, ensuring continuous, safe, and efficient operation. These include fuel handling, feedwater preparation, draft systems, blowdown control, ash removal, and condensate recovery. Each of these components adds cost but also value—by improving performance, reducing waste, and extending equipment life.
| Auxiliary Component | Function | Typical Cost Share (%) | Impact on Efficiency (%) |
|---|---|---|---|
| Feedwater Treatment Unit | Removes hardness and oxygen to prevent scaling/corrosion | 8–12 | +3–5 |
| Combustion Air Fan & Blower | Maintains proper air-fuel ratio | 4–6 | +2–3 |
| Condensate Recovery System | Recovers heat and water from steam return | 5–8 | +5–10 |
| Economizer & Heat Exchangers | Reuse flue gas heat for preheating | 10–15 | +10–12 |
| Fuel Handling & Storage | Ensures consistent fuel supply | 3–6 | +1–2 |
A well-integrated auxiliary system may increase initial investment by 20–25% but typically reduces fuel consumption by 10–15% annually. For a 10-ton/hr steam boiler operating 6,000 hours per year, this can translate to fuel savings exceeding $40,000 annually, easily justifying the upfront cost.
The Economic Impact of Emission Control Systems
Modern environmental regulations (such as the EU’s Industrial Emissions Directive, U.S. EPA Clean Air Act, or India’s CPCB norms) enforce stringent emission limits on NOx, SOx, CO₂, and particulate matter. To comply, boilers must integrate emission control systems like flue gas desulfurization (FGD) units, electrostatic precipitators (ESP), selective catalytic reduction (SCR) systems, or bag filters.
| Emission Control System | Application | Cost Range (USD/kWth) | Efficiency of Pollutant Removal (%) |
|---|---|---|---|
| Electrostatic Precipitator (ESP) | Coal & biomass boilers | 10–15 | 95–99 |
| Bag Filter System | Biomass, oil-fired boilers | 8–12 | 90–98 |
| Flue Gas Desulfurization (FGD) | Sulfur-rich coal/oil boilers | 15–30 | 85–95 |
| Selective Catalytic Reduction (SCR) | High-NOx gas/coal systems | 12–25 | 70–95 |
| Low-NOx Burners | Gas/oil-fired boilers | 5–10 | 40–60 |
Emission control systems not only determine compliance but also influence long-term operating costs due to their energy consumption, maintenance, and reagent use. For instance, SCR systems require ammonia or urea injection, adding recurring consumable costs but reducing NOx emissions drastically, ensuring compliance with Tier 4 standards.
Cost Synergy: Balancing Efficiency and Compliance
Integrating auxiliary systems with emission controls offers synergistic benefits. For example, improved combustion control (via O₂ sensors and VFD-driven air fans) reduces excess air, which simultaneously enhances efficiency and lowers NOx formation—reducing the burden on downstream emission control units. Similarly, installing economizers before the FGD system lowers flue gas temperatures, optimizing desulfurization efficiency.
Example of System Integration Benefits
| System Upgrade | Additional CAPEX (%) | Annual OPEX Savings (%) | Payback Period (Years) |
|---|---|---|---|
| Condensate Recovery + Economizer | +18 | -12 | 2.5 |
| VFD Air Fan + Low-NOx Burner | +10 | -8 | 3 |
| SCR + Optimized Combustion Tuning | +25 | -15 | 3.5 |
These integrated strategies result in shorter payback periods, enhanced efficiency, and long-term emission compliance—demonstrating that higher upfront cost leads to operational resilience and sustainability.
Case Study: 20 TPH Biomass Boiler with Advanced Controls
A 20-ton-per-hour biomass-fired boiler installed in Southeast Asia adopted full auxiliary and emission control integration. The project included a multi-cyclone dust collector, bag filter, economizer, and a condensate recovery system. Compared to a conventional setup, CAPEX increased by 32%, but fuel savings exceeded 18% annually, and particulate emissions were reduced from 120 mg/Nm³ to below 40 mg/Nm³—surpassing environmental compliance requirements. The investment achieved payback in less than three years, with additional savings from reduced water and chemical usage.
Long-Term Financial Perspective: CAPEX vs. OPEX Analysis
| Parameter | Conventional Boiler | Boiler with Advanced Auxiliaries & Emission Controls |
|---|---|---|
| Initial CAPEX | 100% | 140% |
| Annual Fuel Cost | 100% | 85% |
| Maintenance Cost | 100% | 90% |
| Compliance Cost (penalties, permits) | 100% | 60% |
| 10-Year Total Cost of Ownership (TCO) | 100% | 92% |
This comparison illustrates that although integrated systems raise initial expenditure, they substantially reduce operational and compliance costs, lowering the total cost of ownership (TCO) over time.
Technological Advances Shaping Future Costs
Emerging technologies such as AI-based combustion control, IoT-enabled predictive maintenance, and hybrid emission systems are further transforming boiler economics. Smart sensors can optimize auxiliary operations in real time, reducing excess air and unburned fuel losses, while predictive analytics can anticipate filter clogging or scaling issues—preventing costly downtime.
Conclusion
Auxiliary systems and emission controls are not mere add-ons but critical value components that determine a boiler’s efficiency, compliance, and lifetime cost profile. Investing in these systems ensures higher operational safety, lower fuel bills, and environmental stewardship—attributes increasingly demanded by regulators and clients alike.
How Do Installation Location, Logistics, and Site Conditions Affect Total Investment?
When planning an industrial or commercial project—whether it’s a power plant, manufacturing line, or boiler system—many investors focus on the core equipment cost. However, the real financial challenge often emerges during installation. Factors such as installation location, logistics complexity, and site conditions can drastically influence total investment. A project located in a remote or high-altitude region, with poor infrastructure or limited skilled labor, can see its cost rise by 20–50% compared to identical systems installed under ideal conditions. If these variables are not evaluated early, companies risk cost overruns, extended commissioning timelines, and operational inefficiencies. The solution lies in strategic planning—analyzing every logistical and environmental constraint to optimize resource deployment and minimize unforeseen expenses.
Installation location, logistics, and site conditions collectively have a profound impact on total project investment because they determine the accessibility, labor cost, equipment transport, and installation complexity. Remote or challenging sites often increase transportation and foundation costs, require specialized lifting and handling equipment, and extend construction schedules. Favorable site conditions and proximity to infrastructure, on the other hand, can reduce capital expenditure (CAPEX) and speed up return on investment (ROI). Therefore, evaluating these factors during the feasibility stage is critical to accurate cost forecasting and project success.
Investors and project planners must view these elements as dynamic cost multipliers rather than fixed variables. The following analysis explores the underlying mechanisms through which geography, logistics, and site-specific factors shape both direct and indirect investment outcomes in industrial installations.
The cost of industrial installation is mainly determined by equipment price, with minimal influence from site conditions.False
Site conditions, logistics, and geographical constraints can contribute 30–50% of total investment variation, often exceeding equipment cost fluctuations.
Projects in urban areas are always cheaper to install.False
While urban sites offer infrastructure advantages, higher land prices, labor costs, and regulatory requirements can offset logistical savings.
Geographic Location and Its Impact on Cost Structure
Location dictates a multitude of financial factors—labor availability, transportation routes, utility access, environmental regulations, and local taxation. A project in a remote industrial zone faces different challenges from one in a well-developed urban area.
| Location Factor | Impact on Investment | Typical Cost Variation (%) | Description |
|---|---|---|---|
| Distance from Supplier/Port | +5–20 | Higher freight and handling costs due to distance | |
| Local Labor Availability | ±10–15 | Skilled labor shortages increase costs via training or outsourcing | |
| Altitude and Climate | +5–12 | Requires specialized design and insulation for thermal stability | |
| Local Taxation/Import Duties | ±5–10 | Regional regulations can significantly alter total investment | |
| Infrastructure Accessibility | ±10–25 | Affects heavy equipment delivery, crane setup, and material storage |
In remote or mountainous regions, equipment must often be transported via narrow roads or non-standard routes, requiring escort vehicles or modularized transport. This complexity increases freight insurance and crane rental costs, directly inflating CAPEX.
Logistics: The Hidden Cost Driver
The logistical phase includes transportation, storage, and site handling of heavy and sensitive components. Poor logistics planning can lead to idle labor, damage to equipment, and project delays. For large systems like industrial boilers or turbines, logistics can represent up to 20–30% of total project cost, especially if multimodal transport (truck + ship + rail) is required.
| Logistics Element | Cost Impact (%) | Risk Level | Mitigation Strategy |
|---|---|---|---|
| Heavy Load Transport | 10–20 | High | Route surveys, modular transport frames |
| Storage and Handling | 3–7 | Medium | Covered storage and humidity control |
| Crane and Rigging | 5–10 | High | Pre-planned lift sequencing |
| Customs and Border Handling | 2–6 | Medium | Local agent coordination |
| Onsite Movement and Assembly | 4–8 | Medium | Preassembled modular sections |
Advanced logistical modeling (such as using 3D route simulations and digital twin planning) can reduce inefficiencies and prevent unexpected disruptions. For instance, preassembling components at the factory before shipping can reduce installation time on-site by up to 25%, saving labor and equipment rental costs.
Site Conditions: Foundation, Utilities, and Terrain
The physical characteristics of the installation site profoundly influence engineering requirements and overall investment. Soil strength, slope, groundwater levels, and available utilities (power, water, drainage) all determine how complex and costly the installation will be.
| Site Condition | Typical Cost Increase (%) | Explanation |
|---|---|---|
| Weak Soil Requiring Deep Foundation | 10–20 | Pile or raft foundations needed |
| Uneven Terrain or Limited Space | 5–15 | Requires excavation or retaining walls |
| Lack of Power/Water Infrastructure | 5–12 | Temporary supply and pumps required |
| High Groundwater Table | 8–15 | Demands waterproofing and dewatering systems |
| Extreme Temperature or Corrosion Zones | 10–18 | Needs protective coatings or special materials |
A real-world case involves a thermal power plant constructed in a coastal area where high salinity required marine-grade stainless steel structures and enhanced corrosion protection—raising material costs by 18% but preventing severe degradation over the system’s 25-year life.
Comparative Analysis: Ideal vs. Challenging Site Scenario
| Parameter | Ideal Industrial Park | Remote Mountain Site |
|---|---|---|
| Equipment Freight Cost | Base (100%) | +40% |
| Labor Cost | Base (100%) | +25% |
| Construction Duration | 10 months | 14–16 months |
| Utility Setup | Minimal | Complex (temporary systems required) |
| Overall CAPEX | 100% | 135–160% |
| ROI Period | 3.5 years | 5 years |
This comparison demonstrates how the same equipment and engineering design can experience up to 60% cost escalation purely due to logistical and environmental challenges.
Case Study: 15 MW Biomass Power Plant – Impact of Site Conditions
A biomass power project located in a rural province faced difficult terrain, poor road access, and lack of utilities. The logistics of moving heavy boiler modules and turbine casings through 60 km of unpaved road increased freight costs by 28%. Soil instability required 8-meter-deep piling, raising civil costs by 15%. Despite higher initial CAPEX, the project implemented modular fabrication and phased installation—reducing total construction time from an estimated 18 months to 14 months, ultimately offsetting 10% of the cost escalation.
Technological Mitigation Strategies
Modern tools and practices can help control these costs:
3D Site Modeling & BIM (Building Information Modeling): Enables virtual assessment of site terrain, logistics, and layout before mobilization.
Prefabrication and Modular Construction: Reduces on-site labor requirements and minimizes environmental disruption.
IoT-Based Equipment Tracking: Monitors transport and installation progress in real time to prevent costly delays.
Hybrid Foundation Systems: Combining shallow and deep foundations to reduce excavation costs in semi-weak soil.
Environmental and Regulatory Implications
In addition to physical and logistical challenges, installation location determines the scope of environmental compliance and permitting costs. Sites near rivers or ecologically sensitive areas may require additional environmental impact assessments (EIA), emission monitoring systems, or effluent treatment units. Each of these adds layers of CAPEX and OPEX but ensures long-term sustainability and legal protection.
| Regulatory Factor | Cost Influence (%) | Description |
|---|---|---|
| Environmental Clearance | +3–5 | Permitting, EIA reports, consultant fees |
| Safety and Zoning Compliance | +2–4 | Additional equipment spacing and access roads |
| Local Government Levies | ±3–6 | Regional environmental and construction taxes |
Long-Term ROI Perspective
The location and site characteristics not only affect installation costs but also influence operating expenses and maintenance. For instance, remote sites often face higher spare part transportation costs and slower maintenance response times, while urban sites incur higher land taxes and stricter operational regulations. Therefore, optimal location selection is about balancing upfront CAPEX with future OPEX.
| Cost Type | Urban Industrial Zone | Remote Industrial Zone |
|---|---|---|
| Initial CAPEX | Moderate | High |
| Operating Cost | Higher (utilities, taxes) | Moderate |
| Maintenance & Logistics | Easier Access | Delayed Response |
| Long-Term ROI | Stable | Slower Payback |
Conclusion
Installation location, logistics, and site conditions are among the most influential yet underestimated factors in determining total investment. A technically identical system can vary by millions of dollars in cost purely based on environmental, logistical, and geographical circumstances. Thorough pre-feasibility assessments, route studies, and site optimization can dramatically reduce risk and financial exposure.
What Is the Difference Between Capital Cost and Lifecycle (O&M) Cost for a Power Plant Boiler?
When planning to invest in a power plant boiler—whether for coal, biomass, or gas-fired operations—many stakeholders initially focus on the capital cost (CAPEX). However, the true economic performance of a boiler extends far beyond its purchase and installation price. Lifecycle cost (O&M cost), encompassing operation, maintenance, and fuel expenditure, often surpasses the initial investment several times over during the system’s lifespan. Ignoring lifecycle costs during planning can lead to underperforming assets, excessive fuel consumption, and unplanned shutdowns that erode profitability. The optimal solution is to understand and evaluate both cost categories—CAPEX and O&M—as integrated financial components of total cost of ownership (TCO).
The key difference between capital cost and lifecycle (O&M) cost in a power plant boiler lies in their timing, composition, and financial impact. Capital cost represents the one-time investment required to purchase, transport, and install the boiler system, typically accounting for 25–35% of total lifecycle expenditure. Lifecycle or O&M cost includes all ongoing expenses—fuel, labor, water treatment, spare parts, and maintenance—incurred throughout the boiler’s operational life, accounting for 65–75% of total expenditure. While CAPEX defines the project’s entry cost, O&M determines long-term profitability and operational sustainability.
Understanding this distinction is vital for decision-makers aiming to optimize return on investment (ROI), select appropriate technology, and develop accurate financial models. The following sections provide a detailed breakdown of both cost components, industry benchmarks, and practical strategies for balancing upfront investment with operational efficiency.
Capital cost is the main financial burden of a power plant boiler, while O&M costs are negligible.False
In most cases, O&M costs over 20–25 years exceed capital investment by three to five times due to fuel, labor, and maintenance expenses.
Reducing initial CAPEX always lowers total cost of ownership.False
Low CAPEX systems often use less efficient designs or materials, increasing fuel consumption and maintenance costs, thereby raising lifecycle cost.
Capital Cost (CAPEX): The Initial Investment Framework
Capital cost refers to all expenditures necessary to purchase, fabricate, transport, install, and commission the boiler and its auxiliary systems before it becomes operational. These costs are typically recorded at the project’s start and amortized over time. CAPEX depends heavily on technology type, design standards, fuel system, emission control requirements, and site complexity.
| Capital Cost Component | Typical Share (%) | Description |
|---|---|---|
| Boiler Pressure Vessel & Heat Exchangers | 25–35 | Core boiler fabrication, tubes, drums, and economizers |
| Combustion & Fuel Handling Systems | 10–20 | Burners, conveyors, pulverizers, and storage |
| Auxiliary Systems | 15–25 | Feedwater, air fans, blowers, condensate recovery |
| Emission Control Units | 10–20 | ESP, FGD, bag filters, or SCR systems |
| Installation, Civil, and Commissioning | 15–25 | Foundations, cranes, electrical, instrumentation |
| Engineering, Design, and Permitting | 5–10 | Consulting, drawings, and local compliance |
For example, a 100 MW coal-fired boiler might have a total CAPEX of USD 150–180 million, while a similarly rated gas-fired unit could range between USD 80–120 million due to simpler combustion and emission systems. The technology choice (subcritical vs. supercritical) also significantly affects CAPEX because of material grade, design complexity, and pressure ratings.
Lifecycle Cost (O&M): The Long-Term Economic Reality
Lifecycle cost, often referred to as Operating and Maintenance (O&M) cost, covers the recurring expenses over the boiler’s operational lifespan—typically 20–30 years. It includes both variable costs (fuel, water, chemicals) and fixed costs (labor, insurance, depreciation).
| O&M Cost Component | Typical Share of Annual OPEX (%) | Notes |
|---|---|---|
| Fuel Cost | 65–85 | Dominant cost component, varies by fuel type |
| Operation Labor | 5–10 | Skilled operators and control room personnel |
| Maintenance & Spare Parts | 5–10 | Preventive maintenance, refractory, tubes, gaskets |
| Water Treatment & Chemicals | 2–5 | Feedwater quality maintenance and corrosion prevention |
| Ash/Sludge Disposal | 2–4 | Applicable to solid-fuel systems |
| Environmental Compliance | 2–4 | Emission monitoring, waste handling |
| Insurance & Overheads | 1–3 | Administrative and plant safety coverage |
For instance, a 100 MW coal-fired unit operating at 80% capacity factor consumes approximately 50,000–55,000 tons of coal annually. Even minor efficiency deviations (e.g., 1% loss in thermal efficiency) can result in fuel cost increases of USD 500,000–1,000,000 per year, illustrating how lifecycle performance outweighs CAPEX in financial importance.
Comparative Overview: CAPEX vs. O&M Over 25 Years
| Cost Element | Share of Total TCO (%) | Description |
|---|---|---|
| CAPEX (Initial Investment) | 25–35 | One-time purchase, installation, and commissioning |
| O&M Cost (Fuel + Labor + Maintenance) | 65–75 | Recurrent costs throughout operation |
| Total Cost of Ownership (TCO) | 100 | Combined economic footprint across lifecycle |
In simpler terms, while CAPEX defines the project’s entry barrier, O&M defines its profitability curve. A low-cost boiler with poor efficiency or high maintenance frequency may have an attractive upfront price but will cost significantly more to operate over time.
Example Case Study: 50 MW Biomass Boiler Plant
| Parameter | Value | Observation |
|---|---|---|
| CAPEX | USD 55 million | Includes boiler, fuel system, emission controls |
| Annual O&M | USD 5.5 million | Mainly biomass feedstock and labor |
| Expected Life | 25 years | — |
| Total O&M (25 years) | USD 137.5 million | 2.5× CAPEX |
| Efficiency Improvement (from 78% to 82%) | Saves USD 400,000/year | Fuel saving offsets 7% of CAPEX over lifecycle |
This case illustrates that operational efficiency improvements and predictive maintenance programs yield substantial financial advantages over time, even when CAPEX is slightly higher.
Key Technical Factors Influencing CAPEX and O&M
| Technical Factor | CAPEX Impact | O&M Impact | Explanation |
|---|---|---|---|
| Boiler Design Pressure & Efficiency | ↑ | ↓ | Higher design efficiency increases CAPEX but reduces fuel use |
| Material Quality | ↑ | ↓ | Corrosion-resistant alloys reduce tube replacements |
| Automation & Controls | ↑ | ↓ | Smart control systems lower labor and maintenance |
| Fuel Type (Coal, Gas, Biomass) | Variable | Major | Determines combustion system complexity and O&M intensity |
| Emission Control Level | ↑ | Moderate | Adds CAPEX but prevents penalties and downtime |
| Site Accessibility | ↑ | Moderate | Affects logistics and maintenance availability |
Lifecycle Optimization Strategies
Invest in Higher-Efficiency Boilers:
Supercritical and ultra-supercritical designs, while costlier, yield 5–10% fuel savings annually.Adopt Predictive Maintenance (IoT-based):
Condition-based monitoring minimizes unplanned shutdowns and reduces maintenance costs by up to 20%.Enhance Water and Thermal Recovery Systems:
Implementing economizers and condensate recovery reduces O&M costs by lowering water and chemical usage.Fuel Flexibility Design:
Multi-fuel boilers accommodate biomass or gas co-firing, improving economic adaptability to fuel price fluctuations.Optimize O&M Contracts:
Outsourced O&M with performance-based KPIs ensures consistent efficiency and minimizes hidden operational costs.
Illustrative Financial Comparison: Low vs. High-Efficiency Design
| Scenario | CAPEX (USD million) | Annual O&M (USD million) | Efficiency (%) | 25-Year TCO (USD million) |
|---|---|---|---|---|
| Low-Efficiency Boiler | 80 | 9.5 | 78 | 317.5 |
| High-Efficiency Boiler | 95 | 8.0 | 85 | 295.0 |
Although the high-efficiency boiler costs USD 15 million more initially, it saves USD 22.5 million in total lifecycle costs—demonstrating that higher CAPEX can yield lower TCO and faster ROI.
Visual Representation: CAPEX vs. O&M Cost Distribution
| Lifecycle Phase | Cost Ratio (%) | Duration (Years) |
|---|---|---|
| Procurement & Installation | 25–35 | 0–2 |
| Operation & Maintenance | 65–75 | 3–25 |
| Decommissioning & Recovery | <5 | 26+ |
This emphasizes that the majority of a boiler’s cost is realized during operation—not at purchase.
Conclusion
The difference between capital cost and lifecycle (O&M) cost is fundamental to power plant economics. Capital cost defines how much is spent to acquire and install the system, while lifecycle cost determines how efficiently and sustainably it operates. Smart investors and engineers evaluate both simultaneously, prioritizing total cost of ownership (TCO) over short-term savings. A slightly higher CAPEX with superior efficiency and reliability almost always results in lower overall expenditure and faster ROI.
🔍 Conclusion
The total price of a power plant boiler depends on technical specifications, fuel characteristics, and auxiliary equipment scope. A balanced approach — considering both capital and operational costs — ensures optimal performance, reliability, and return on investment over the boiler’s service life.
📞 Contact Us
💡 Planning a new power plant or boiler upgrade project? We offer customized design, EPC services, and cost optimization solutions for coal, gas, and biomass power plants.
🔹 Contact us today for an accurate power plant boiler cost assessment and professional project consultation. ⚡🔥🏭✅
FAQ
What determines the price of a power plant boiler?
The price of a power plant boiler depends on several major factors:
Boiler capacity and output – Larger units (e.g., 50–500 MW) require more materials, complex design, and higher manufacturing costs.
Fuel type – Gas-fired boilers tend to be more expensive upfront but cheaper to operate, while coal-fired units have lower capital costs but higher environmental control expenses.
Steam pressure and temperature – Supercritical and ultra-supercritical boilers cost more due to high-grade materials and precision engineering.
Auxiliary systems – Economizers, feedwater systems, air preheaters, and control systems add significant cost but improve efficiency.
Customization and standards – Seismic design, emissions compliance, or export certifications can increase pricing.
What is the average cost range for power plant boilers?
Small industrial power boilers (≤10 t/h): $50,000 – $200,000
Medium-sized utility boilers (10–100 t/h): $200,000 – $1 million
Large utility boilers (100–500 t/h): $1 – 5 million+
Supercritical and ultra-supercritical boilers can exceed $10 million depending on design and auxiliary equipment.
How do different fuel types affect total boiler cost?
Gas-fired boilers: Higher material and control costs, but lower installation and emission treatment costs.
Coal-fired boilers: Lower equipment cost but need dust removal, desulfurization, and denitrification systems.
Biomass boilers: Moderate cost, suitable for renewable energy projects with fuel availability.
Oil-fired boilers: Compact design, moderate cost, good for standby or high-efficiency use.
What are the additional costs beyond the boiler itself?
Total project investment includes:
Auxiliary equipment – burners, economizers, feedwater pumps, control panels.
Civil works – foundation, housing, and access infrastructure.
Transportation and installation – packing, freight, on-site assembly.
Commissioning and testing – system integration, performance tuning.
Operation and maintenance (O&M) – annual upkeep and spare parts.
How can buyers optimize cost and efficiency when purchasing a power plant boiler?
To achieve the best ROI:
Match boiler type to the fuel source and application.
Choose high-efficiency designs (supercritical, WHRB) to reduce lifetime fuel costs.
Request complete turnkey or EPC services to streamline logistics and installation.
Select reliable manufacturers with proven global projects to ensure quality and delivery.
Perform lifecycle cost analysis (LCCA) to balance capital and operational expenses.
References
U.S. Department of Energy – Steam System Efficiency – https://www.energy.gov
IEA – Power Plant Cost and Performance Data – https://www.iea.org
GE Steam Power – Utility Boiler Solutions – https://www.ge.com
Babcock & Wilcox – Power Boiler Systems – https://www.babcock.com
Thermax – Boiler Price Insights – https://www.thermaxglobal.com
Doosan Lentjes – Supercritical Boiler Projects – https://www.doosanlentjes.com
ScienceDirect – Economic Analysis of Power Boilers – https://www.sciencedirect.com
ResearchGate – Boiler Cost Optimization Study – https://www.researchgate.net
ASME – Boiler Construction Standards – https://www.asme.org
EnergySage – Industrial Boiler Efficiency Guide – https://www.energysage.com
