Key Questions to Ask Potential Industrial Steam Boiler Suppliers
Key Questions to Ask Potential Industrial Steam Boiler Suppliers
Choosing the right industrial steam boiler supplier is critical to the long-term success of your thermal system. The wrong decision can result in inefficiencies, reliability issues, compliance failures, and higher operating costs. A reliable supplier must offer not only a technically sound product but also engineering support, customization, regulatory compliance, and after-sales service. Asking the right questions helps you evaluate whether a supplier is capable of delivering a safe, efficient, and scalable steam solution.
To evaluate potential industrial steam boiler suppliers, ask questions about thermal efficiency, fuel compatibility, capacity ranges, design standards, emissions compliance, installation scope, testing protocols, certifications (ASME, ISO, CE), and post-sale service support. Also request project references, performance guarantees, and service contract details. These inquiries help ensure the supplier aligns with your technical needs, budget, and long-term operational goals.
Use the following question checklist to confidently assess and compare suppliers.
What Steam Output Capacity Ranges Do Your Boilers Support, and Are They Scalable?
When selecting an industrial steam boiler supplier, one of the most important questions is: Can their boilers meet your plant’s current steam demand—and grow with it? Whether you’re running a food processing plant, chemical refinery, paper mill, or district heating system, steam demand can change due to production scale-up, energy optimization, or fuel transition strategies. That’s why understanding the supplier’s available capacity range and scalability options is critical to long-term ROI and system flexibility.
Buyers must determine the minimum and maximum steam output ranges supported (in TPH—tons per hour), whether units are modular, and how scalability is achieved—through parallel operation, header integration, or future module addition. This applies not just to the boiler hardware, but also to control systems, feedwater, and emissions management components.
If your supplier can’t scale with you, you’ll outgrow your boiler before you recover its investment.
Scalable steam capacity and modular flexibility are essential features of modern industrial boiler systems to ensure adaptability to future process demands.True
Steam consumption often increases as facilities expand. Choosing a supplier with a wide capacity range and scalable design prevents costly replacement or parallel retrofit.
Key Areas to Clarify About Steam Capacity and Scalability
1. What Is the Supplier’s Standard Steam Output Range?
| Capacity Class | TPH Range | Application |
|---|---|---|
| Small-scale | 0.5–5 TPH | Laboratories, small food units, laundries |
| Mid-range | 6–20 TPH | Chemical processing, hospitals, breweries |
| High-capacity | 25–100+ TPH | Paper, textile, food megaplants |
| Utility-grade | 100–500 TPH | Refining, power, district heating, IPPs |
Ask:
What are your lowest and highest available TPH models?
Are these pressure-part-limited or fuel-specific?
Can you custom-design boilers beyond your standard range?
2. Are the Boilers Modular and Designed for Scalability?
| Scalability Type | Design Strategy | Benefit |
|---|---|---|
| Parallel unit design | Multiple identical units | Redundancy and phased expansion |
| Header integration | Shared steam distribution system | Smooth load distribution |
| Pre-wired skid modules | Plug-and-play scalability | Rapid deployment with minimal redesign |
| Staged firing capacity | Within-unit modulation | Reduces energy waste during part-load |
Ask:
Can units be added later to increase capacity?
Is your control logic able to manage multiple boilers under a master PLC?
Do you provide load-sharing software?
3. How Are Boilers Adapted to Pressure and Load Variability?
| Design Variable | Scalability Impact |
|---|---|
| Pressure rating (bar/g) | Options from 10 to 110 bar |
| Superheat capability | Configurable based on process |
| Fuel flexibility | Multi-fuel burners (gas/oil/biomass) |
| Turn-down ratio | 3:1 to 8:1 standard |
Ask:
Can steam pressure and output be scaled independently?
What is your boiler’s minimum turndown percentage?
Do you offer designs for future superheating or turbine integration?
4. What’s Included in the System When Scaling Output?
| System Area | Scalability Method |
|---|---|
| Steam header & piping | Modular flange expansion |
| Feedwater system | Common or dedicated per unit |
| Deaerator | Sizing based on future load |
| Fuel delivery (e.g., HFO/LNG) | Scalable burners or dual-fuel add-ons |
| Emissions control (NOₓ, SO₂) | SCR, FGD units scaled by flow rate |
Ask:
Can auxiliary systems be pre-engineered for future expansion?
Is the control room/HMI scalable for multi-unit visualization?
Are flue gas and emissions systems modular or fixed?
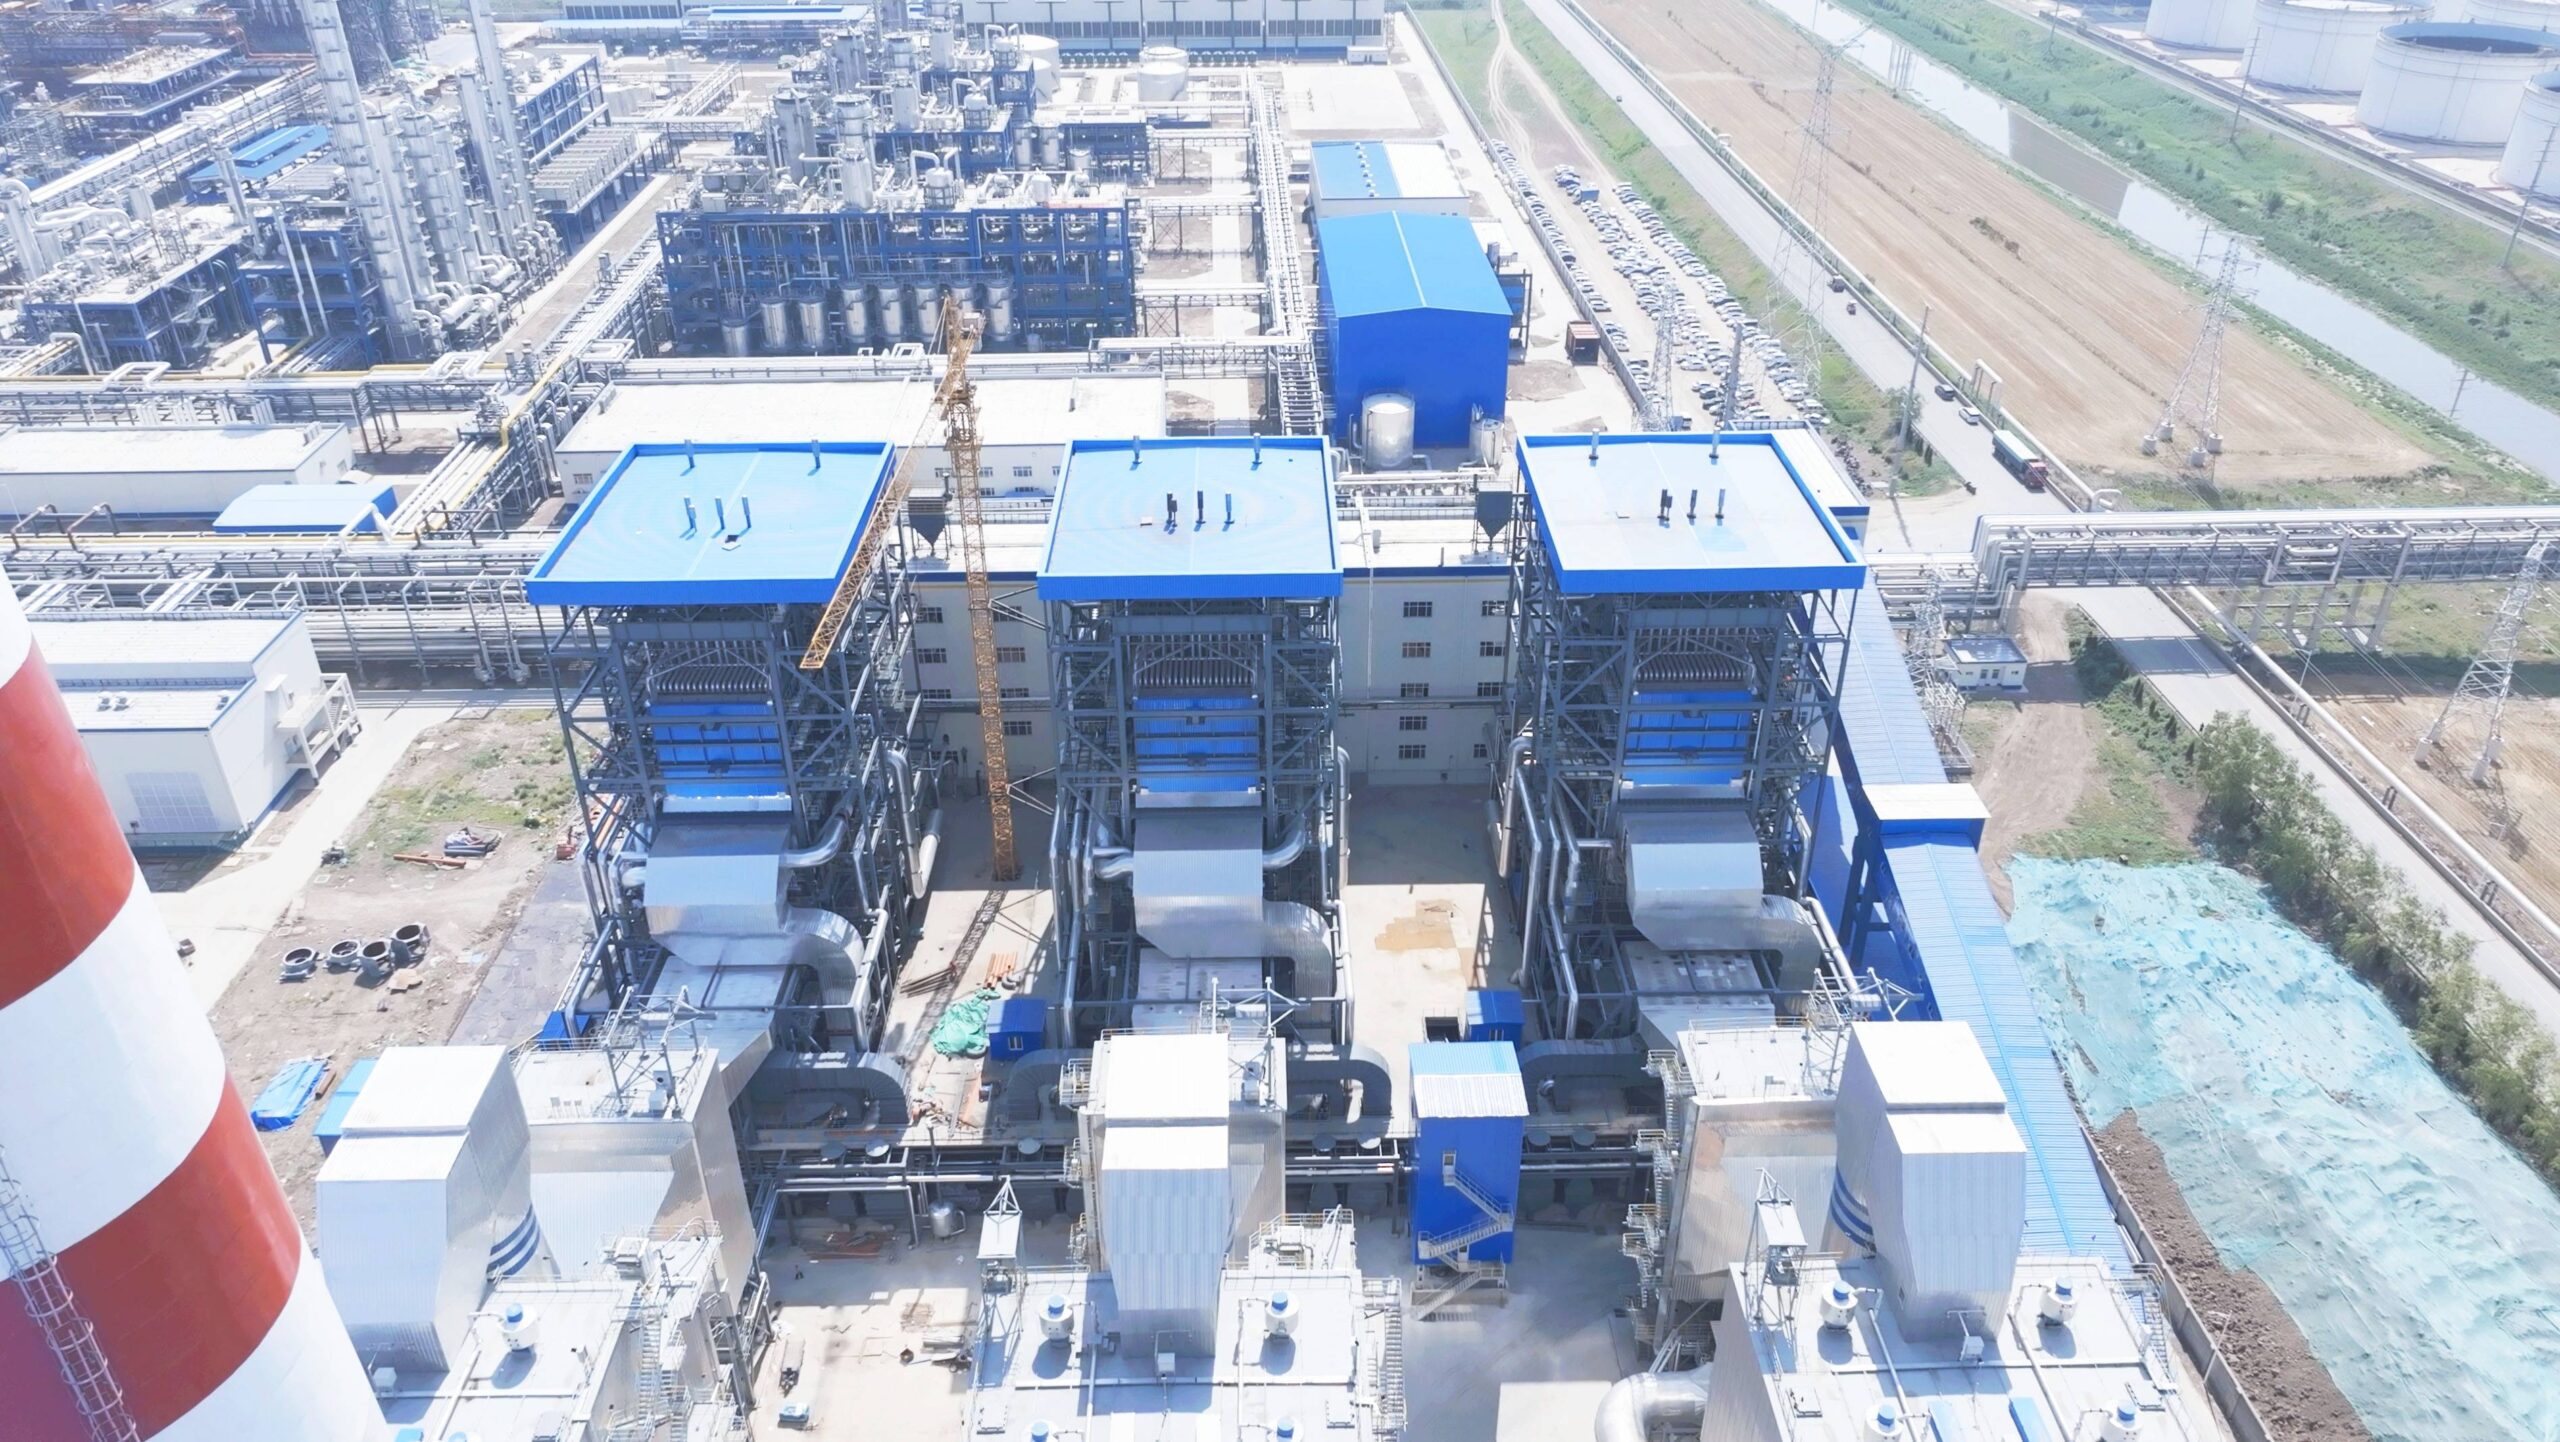
Example: Steam Scalability Design – 3×15 TPH Oil-Fired Boilers
Client: Edible oil processing plant
Initial Capacity: 15 TPH @ 17 bar
Expansion Plan: Add 15 TPH module in year 2, third unit in year 4
Design Features:
Pre-installed 3× steam outlet valves with capped future ports
Common feedwater tank sized for 3×15 TPH
Integrated steam header with load balancing logic in SCADA
Burner system with dual-fuel LFO/Biodiesel for future transition
Shared CEMS system with added flow channel capacity
Result: Seamless capacity increase from 15 TPH to 45 TPH with zero production downtime during expansion
Summary
Steam capacity is not just a technical spec—it’s a business enabler. Whether your plant needs 5 TPH today or 50 TPH tomorrow, your boiler supplier must provide a scalable platform that evolves with your growth. Ask for modular options, header integration, and multi-boiler logic—not just bigger metal. Because in a growing operation, your boiler should never be the bottleneck. Choose flexibility. Choose future-ready flow. Choose a system that starts right—and scales smart.
What Are Your Guaranteed Thermal Efficiency and Fuel Consumption Rates?
In industrial steam boiler procurement, guaranteed thermal efficiency and fuel consumption per ton of steam output are the most critical metrics to assess operational cost, emissions footprint, and return on investment. The boiler may be designed for reliability and safety, but if it burns excessive fuel or delivers low heat conversion efficiency, you pay more per unit of steam—month after month. These values must be precisely stated, contractually guaranteed, and verifiable via performance testing.
Buyers must demand the supplier’s thermal efficiency guarantees under specified conditions (e.g., 100% load, HHV or LHV basis, standard test method), and clear fuel consumption rates (in kg/h or Nm³/h) per ton of steam output for each fuel type supported. Measurement methods and correction factors must also be disclosed for transparency.
A boiler without efficiency guarantees is a gamble. A boiler with clear consumption benchmarks is a strategic asset.
Thermal efficiency and fuel consumption guarantees are essential for ensuring economic performance and fuel cost predictability in industrial steam boilers.True
Clear efficiency metrics help buyers project operating costs and compare suppliers on a total lifecycle value basis—not just upfront pricing.
Key Points to Clarify on Boiler Efficiency and Fuel Use
1. What Is the Guaranteed Thermal Efficiency and Test Standard?
| Efficiency Type | Typical Range | Testing Protocol |
|---|---|---|
| Gross efficiency (HHV) | 84–89% | ASME PTC 4, ISO 23145 |
| Net efficiency (LHV) | 88–92% | Fuel-specific basis |
| Part-load efficiency | 78–86% @ 50–60% load | Measured during factory or site trials |
| Stack loss method | Verified via flue gas O₂, CO, temp | ±1% tolerance |
| Direct calorific method | Used for HFO/gas blends | Fuel input vs steam output |
Ask:
Do you guarantee thermal efficiency at full and partial loads?
Are your guarantees based on HHV or LHV?
Is third-party witnessed testing included in the agreement?
2. What Is the Specific Fuel Consumption (SFC) per Ton of Steam?
| Fuel Type | Expected SFC Range | Factors Affecting It |
|---|---|---|
| Light Fuel Oil (LFO) | 60–68 liters/ton | Efficiency, heat content |
| Heavy Fuel Oil (HFO) | 63–70 kg/ton | Viscosity, preheating |
| Natural Gas | 105–120 Nm³/ton | Burner tuning, O₂ control |
| Biodiesel blend (e.g., B20) | 62–70 liters/ton | Heating value, density |
Ask:
Are SFC values corrected to 100°C feedwater and 1 bar steam outlet?
How does the system compensate for changes in fuel CV or humidity?
Are these values field-tested or lab-simulated?
3. Is Efficiency Tunable and Maintainable Over Time?
| Efficiency Factor | Control Method |
|---|---|
| Excess O₂ level | O₂ trim controller with flue gas sensor |
| Burner modulation | PID-controlled based on load |
| Soot/blowdown frequency | Timed or DP-triggered optimization |
| Stack temperature | Monitored for heat loss alerting |
| Water TDS | Conductivity-based blowdown control |
Ask:
Do you provide digital dashboards showing live efficiency?
Can burner tuning be adjusted remotely post-installation?
Is efficiency guaranteed after 12–24 months of runtime?
4. What Conditions Are Assumed for the Guarantee?
| Condition | Standard Reference |
|---|---|
| Ambient air temp | 20–25°C |
| Feedwater temp | 80–105°C |
| Fuel CV | LFO: ~42 MJ/kg, HFO: ~40 MJ/kg |
| Boiler load | Typically 100%, sometimes at 75% |
| Steam pressure | 10–17 bar(g) for process boilers |
Ask:
Are correction factors applied if site conditions vary?
Can performance be guaranteed across load turndown (e.g., 40–100%)?
Are guarantees subject to maintenance or O&M conditions?
Example: 10 TPH LFO Boiler Efficiency Guarantee
Steam Output: 10 tons/hour
Fuel: Light fuel oil (LFO) with 42.5 MJ/kg HHV
Guaranteed Thermal Efficiency: 88.3% HHV at 100% load
Specific Fuel Consumption (SFC): 65.3 liters/ton steam @ 105°C feedwater, 10 bar outlet
| Operating Point | Fuel Used (L/hr) | Steam Output (TPH) | Efficiency (%) |
|---|---|---|---|
| 100% load | 653 L/hr | 10.0 | 88.3% |
| 75% load | 515 L/hr | 7.5 | 86.2% |
| 50% load | 374 L/hr | 5.0 | 84.0% |
Validation: Efficiency tested using ASME PTC 4.1 methodology, witnessed by third-party auditor
Correction Conditions: ±1.5% adjustment per 5°C deviation in ambient air temp or feedwater temp
Summary
Fuel cost is the largest lifetime operating expense of any industrial boiler. Without a clear, guaranteed thermal efficiency and fuel consumption benchmark, you’re navigating blind. Ask for lab-proven numbers, runtime logs, and contractual assurances. Don’t buy a boiler—buy a fuel economy machine that runs on proof, not promises. Choose high-efficiency combustion. Choose predictable costs. Choose performance you can measure in every drop or cubic meter.
What Standards and Certifications (ASME, ISO, CE) Do Your Boilers Comply With?
When purchasing an industrial steam boiler, no factor is more crucial to safety, legality, and quality assurance than compliance with recognized engineering standards and international certifications. Whether the unit is installed in Europe, Asia, the Americas, or Africa, it must meet the design, fabrication, inspection, and quality protocols accepted by regional regulators, insurers, and safety inspectors. ASME (for pressure integrity), CE (for European market acceptance), and ISO (for quality and safety management) are not optional—they are operational necessities.
Buyers must confirm which certifications and standards the supplier adheres to, especially the ASME “S” or “U” stamps for pressure parts, CE PED modules (H, H1, B+D) for European compliance, and ISO 9001, 14001, or 45001 for quality, environmental, and safety systems. These certificates should be valid, third-party audited, and cover the full boiler manufacturing process—from design to inspection.
Without proven compliance, your boiler investment may fail commissioning or legal scrutiny.
Industrial steam boilers must comply with recognized standards like ASME, CE, and ISO to ensure safe operation, legal conformity, and performance verification.True
Pressure equipment must meet international design, welding, and inspection standards to be accepted by regulators and to operate safely under real process conditions.
Key Boiler Certifications and Standards to Demand From Your Supplier
1. ASME Certification – Required for Pressure Vessel Integrity and Global Trade
| ASME Code Section | Scope | Applies To |
|---|---|---|
| ASME Section I (“S” Stamp) | Power boilers (≥15 psi) | Steam drums, water walls, headers |
| ASME Section VIII (“U” Stamp) | Unfired pressure vessels | Economizers, deaerators, preheaters |
| ASME Section IX | Welding qualifications | WPS, PQR, welder WQTs |
| ASME Section V | Nondestructive Examination (NDE) | RT, UT, PT, MT for pressure part welds |
Ask:
Is your boiler stamped with ASME “S” or “U” nameplates?
Can we audit your welding traceability and RT coverage?
Are hydrotest results documented under ASME PTC protocols?
2. CE Marking – Mandatory for Boilers Installed in the EU or PED-Regulated Zones
| Directive | Certification Module | Scope |
|---|---|---|
| PED 2014/68/EU | Module H, H1, B+D | Pressure vessel design and fabrication |
| EMC Directive | Electromagnetic safety | PLCs, control cabinets |
| Machinery Directive | Moving parts safety | Valves, dampers, burner drives |
Ask:
Which notified body issued your CE PED certification (e.g., TÜV, DNV)?
Do all pressure-retaining parts carry CE markings?
Is a CE Technical File provided at final delivery?
3. ISO Management Systems – Ensuring Fabrication and Audit Readiness
| ISO Standard | Purpose | Applicability |
|---|---|---|
| ISO 9001 | Quality management | Covers design, procurement, inspection |
| ISO 14001 | Environmental controls | Minimizes waste, manages emissions |
| ISO 45001 | Occupational health & safety | Governs workshop safety practices |
| ISO 50001 (optional) | Energy efficiency system | Energy-intensive OEMs only |
Ask:
Are ISO audits conducted by accredited bodies (e.g., SGS, BSI)?
Are subcontractors held to the same ISO standards?
Is your ISO certification valid and renewed?
4. Material and Welding Certifications
| Standard | Relevance | Supplier Output |
|---|---|---|
| EN 10204 3.1/3.2 | Material test certificates | Each component with traceable heat number |
| EN 12952 / EN 12953 | European boiler codes | For fire-tube and water-tube designs |
| WPS/PQR/WQT under ASME IX | Weld qualification | For all load-bearing welds on pressure parts |
Ask:
Will we receive full MTCs for all pressure-retaining materials?
Are welds radiographed or ultrasonically tested per code?
Do you submit an Inspection Test Plan (ITP) before fabrication?
5. Compliance Documentation and Data Book
| Document | Contents |
|---|---|
| Final QA Dossier | WPS, PQR, RT/UT reports, nameplate photos, hydrotest records |
| CE Declaration of Conformity | Design code, PED module, NB certificate |
| FAT report | Burner test, safety trip simulation, controls verification |
| ITP and QCP | Hold points, acceptance criteria, inspector logs |
Ask:
Can we receive a digital, searchable data book?
Are FATs documented with videos or signed logs?
Do you offer third-party witness testing?
Case Example: Certified 15 TPH Steam Boiler for EU Market
Specifications:
CE PED Module H1 via TÜV Nord
ASME “S” stamped steam drum and headers
Welding under ASME IX with 100% RT of critical joints
ISO 9001 + ISO 14001 + ISO 45001 for factory management
FAT witnessed by buyer and third-party inspector
Delivered Documents:
1,200-page digital data book
CE Declaration of Conformity (signed)
ASME Certificates of Authorization
MTCs for SA-516 Gr.70 and SA-213 T22 coils
RT films and weld maps for all critical zones
Summary
Certifications are not just paperwork—they are your boiler’s passport to safe, compliant operation in regulated markets. Never accept verbal assurances—demand stamped nameplates, signed declarations, and traceable inspection records that prove the unit meets ASME, CE, and ISO standards. In high-pressure systems, documentation isn’t optional—it’s protection. Choose certified integrity. Choose quality with credentials. Choose a supplier whose boiler is built—and certified—to perform.
Can Your System Support Different Fuels or Switch Between Multiple Energy Sources?
As industrial energy prices fluctuate and emissions regulations evolve, steam boiler operators are increasingly turning to fuel flexibility as a strategic advantage. Whether to hedge fuel supply risk, reduce CO₂ intensity, or comply with fuel-switching mandates during seasonal load adjustments, the ability to run on multiple fuels—such as natural gas, LPG, light fuel oil (LFO), heavy fuel oil (HFO), biodiesel, or biomass—is a critical capability. Even better is the ability to switch between them automatically or manually without expensive downtime or complex retrofits.
Buyers must ask whether the boiler can handle more than one fuel type, how switching is controlled, what preheating or feed adaptations are required, and how combustion efficiency is maintained during fuel changeover. Fuel system compatibility should be backed by case references, burner technical datasheets, and combustion tuning protocols.
Fuel flexibility isn’t a nice-to-have—it’s future-proofing your boiler against cost volatility and regulatory shifts.
Industrial boilers with multi-fuel support offer greater operational flexibility, energy security, and long-term cost control.True
Being able to burn different fuels or switch between them allows plant operators to adapt to fuel pricing, availability, and environmental mandates with minimal disruption.
Key Aspects of Multi-Fuel Boiler System Design and Evaluation
1. Which Fuels Can the Boiler System Support?
| Fuel Type | Design Implications | Application |
|---|---|---|
| Light fuel oil (LFO) | Standard pressure-jet burner | Common in food, pharma |
| Heavy fuel oil (HFO) | Requires preheating, filtration | Refineries, shipping |
| Natural gas | Requires precise air/fuel ratio control | Urban or pipeline-connected plants |
| LPG/Propane | High BTU content, explosion risk | Remote or off-grid use |
| Biodiesel (B20–B100) | Viscosity and flow modifications | Green manufacturing |
| Biogas or syngas | Low calorific value handling | Waste-to-energy plants |
Ask:
Is the burner designed for multi-fuel injection or single-fuel retrofit?
What CV and viscosity ranges can the system handle?
Is there a history of biodiesel or low-carbon fuel success?
2. Can the System Switch Between Fuels Automatically or Seamlessly?
| Switch Type | Method | Use Case |
|---|---|---|
| Manual switch-over | Operator-controlled valve/fuel selector | Low-frequency transitions |
| Semi-automatic | Pre-set sequence with operator acknowledgment | Fuel price response |
| Fully automatic | PLC-based logic and flame control | Standby or primary fuel outage protection |
Ask:
How long does a cold or hot switch take between fuels?
Are purging and flame sensing systems shared across fuels?
Can different fuels be assigned load priorities (e.g., auto switch if primary fails)?
3. What Burner and Combustion Control Adaptations Are Required?
| Component | Design Requirement | Dual-Fuel Feature |
|---|---|---|
| Burner | Multi-nozzle, air-staged or rotary cup | Handles LFO+HFO or oil+gas |
| Flame detection | Infrared/UV detection compatibility | Must work across flame types |
| Combustion control | O₂ trim, PID tuning per fuel | Fuel-specific tuning profiles |
| Fuel pumps/valves | Heat-traced for viscous fuels | Auto-sequenced by logic controller |
Ask:
Is the burner supplied as dual-fuel from OEM or third-party adapted?
Can air/fuel curves be tuned remotely for each fuel?
Are different ignition systems required for each fuel type?
4. What Auxiliary Systems Must Be Considered for Each Fuel?
| Subsystem | Customization for Fuel Type |
|---|---|
| Fuel feed lines | Stainless steel for biodiesel; preheaters for HFO |
| Filtration | Fine particulate filters for bioliquids |
| Tank heating | Steam or electric tracing for heavy oils |
| Exhaust handling | Flue gas treatment may vary with sulfur content |
| Emissions control | Different NOₓ, SO₂ levels per fuel require tuning or injection rate change |
Ask:
Can all auxiliaries (tanks, pumps, heaters) handle both fuel types?
Are emissions guarantees maintained across all fuels?
Is the CEMS system calibrated for each fuel’s emission profile?
Real-World Example: Dual-Fuel 12 TPH Boiler (LFO + Natural Gas)
Specifications:
Burner: Dual-fuel pressure atomizing burner (LFO + NG)
Switch Mode: Automatic, with programmable logic controller (PLC)
Fuel Transfer Time: ≤30 seconds hot changeover, ≤2 minutes cold
Emissions:
LFO: NOₓ ≤145 mg/Nm³, CO ≤40 mg/Nm³
NG: NOₓ ≤95 mg/Nm³, CO ≤20 mg/Nm³
Features:
Heat-traced LFO line with duplex filter
O₂ trim with dual PID settings for LFO and NG
Real-time fuel analytics with consumption tracking
CEMS auto-calibrated per fuel stream
92% net efficiency (LHV basis) on both fuels with modulating burner
Operator Feedback:
“Switching between fuels helped us avoid natural gas curtailment penalties.”
“No flame loss during fuel changeover even under 70% load.”
“Burner tuning was pre-loaded for both fuels—just select and run.”
Summary
Multi-fuel capability isn’t just a technical feature—it’s your operational leverage. Ask for burner specs, fuel switching logic, and efficiency/emissions guarantees for each fuel type. In today’s volatile energy market, a boiler that can pivot fuels without penalty is the difference between fixed cost and fuel freedom. Choose flexible combustion. Choose dual-fuel intelligence. Choose a boiler built for any fuel—and every future.
How Do You Ensure Emissions Compliance (NOₓ, SOₓ, CO₂) in Your Boiler Design?
As global and regional emissions regulations become more stringent, emissions compliance has become one of the most critical criteria when selecting an industrial steam boiler. Whether for NOₓ, SOₓ, CO₂, or particulate matter (PM), your boiler must meet specific limits defined by environmental authorities—often tied to permits, audits, or ESG performance reporting. Failure to comply can lead to penalties, shutdowns, or loss of operating licenses.
Buyers must ask how the supplier ensures that their boiler design complies with regional or international emission limits for NOₓ (nitrogen oxides), SOₓ (sulfur oxides), and CO₂ (carbon dioxide), and what technologies (low-NOₓ burners, FGR, SNCR, SCR, limestone injection, CEMS) are integrated or offered as options. They must also request guaranteed emissions values and real performance data across fuel types and load conditions.
A boiler that meets efficiency targets but fails emissions is still a failure.
Emissions compliance technologies—such as low-NOₓ burners, flue gas treatment systems, and real-time monitoring—are essential for legal operation and environmental responsibility in industrial steam boilers.True
Design-stage emissions engineering prevents costly retrofits and enables safe, compliant operation under evolving regulatory frameworks.
Key Emissions and Design Features to Discuss With Boiler Suppliers
1. What Are the Guaranteed Emissions Levels (mg/Nm³ or ppm)?
| Emission Type | Typical Limits | Compliance Target |
|---|---|---|
| NOₓ (as NO₂) | ≤100–150 mg/Nm³ @ 3–6% O₂ | Europe, India, ASEAN |
| SO₂ | ≤50–150 mg/Nm³ | Fuel sulfur content + mitigation |
| CO | ≤30–50 mg/Nm³ | Combustion tuning, excess air control |
| CO₂ | Not directly limited (yet) | Tracked for ESG reporting, ETS |
| PM (dust) | ≤10–30 mg/Nm³ | Required for CE, EU, ULE standards |
Ask:
Are these values guaranteed under specific load/fuel conditions?
Are emissions verified by third-party CEMS or manual testing?
Are NOₓ/SOₓ levels modulated by load or fixed per fuel curve?
2. What NOₓ Control Technologies Are Used in the Design?
| Technology | Mechanism | Effectiveness |
|---|---|---|
| Low-NOₓ burner | Flame shaping, air staging | 30–60% NOₓ reduction |
| Flue gas recirculation (FGR) | Recirculates cooled flue gas to burner | Up to 20% NOₓ reduction |
| Overfire air (OFA) | Introduces secondary air post-combustion | Up to 40% NOₓ reduction |
| SNCR (Selective Non-Catalytic Reduction) | Urea/ammonia injected at 850–1050°C | 50–70% reduction |
| SCR (Selective Catalytic Reduction) | Catalyst + ammonia at 300–400°C | 85–95% NOₓ reduction |
Ask:
What is the base NOₓ output with burner-only control?
Is SCR or SNCR offered as an integrated solution or optional add-on?
Can your system meet ultra-low NOₓ (e.g., <50 mg/Nm³) standards?
3. How Is SO₂ Controlled—Especially for Oil or High-Sulfur Fuels?
| Control Method | Application | SO₂ Reduction |
|---|---|---|
| Low-sulfur fuel use | LFO, treated HFO | First line of defense |
| Limestone injection | In-furnace desulfurization | 50–70% SO₂ reduction |
| Dry sorbent injection | Post-combustion scrubbing | 60–80% |
| Wet scrubber (FGD) | Chemical flue gas treatment | 90–99% |
| Dual-fuel switching | Switch to gas as backup | Zero SO₂ emissions in gas mode |
Ask:
Is sulfur content in fuel automatically compensated in dosing?
Can SO₂ reduction be retrofitted if local norms change?
Are dust/acid mist emissions after desulfurization also handled?
4. What Provisions Are Made for CO₂ Monitoring and Reporting?
| CO₂ Strategy | Purpose | Integration Level |
|---|---|---|
| Efficiency optimization | Reduce CO₂/ton steam | Via O₂ trim, burner tuning |
| CEMS monitoring | Required in EU, India, ETS | Real-time data with cloud logging |
| Biomass/blended fuels | Reduce net emissions | Up to 30% co-firing typically supported |
| Carbon capture readiness | Stack isolation for future retrofit | Optional flue conditioning section |
Ask:
Is CO₂ tracked or logged via CEMS or inferred from O₂/fuel data?
Do you provide tools for emissions inventory calculation?
Is the boiler “CO₂ capture ready” for future decarbonization?
5. Are Continuous Emissions Monitoring Systems (CEMS) Included?
| Monitored Gases | Typical Setup | Function |
|---|---|---|
| NOₓ, SO₂, CO, O₂ | CEMS stack probe + analyzer | Regulatory proof, trend tracking |
| Calibration system | Auto zero/span | Accuracy assurance |
| Data interface | PLC/SCADA or cloud dashboard | Local and remote access |
Ask:
Is CEMS hardware included or optional?
Are CEMS readings used for fuel-air adjustment (closed loop)?
Do you support EN 14181 (Europe) or EPA 40 CFR Part 60 (US)?
Example: Emissions-Engineered 15 TPH Oil-Fired Boiler
Fuel: LFO + backup HFO (1.8% sulfur)
Control Features:
Low-NOₓ burner with FGR (base NOₓ ≤135 mg/Nm³)
Limestone injection for SO₂ under HFO use
O₂ trim with closed-loop modulation (3.2% excess air)
Stack-integrated CEMS (NOₓ, SO₂, CO, CO₂, O₂)
CO₂ emissions logged hourly and exported as CSV
Emissions Performance:
| Parameter | LFO Mode | HFO Mode |
|---|---|---|
| NOₓ | 124 mg/Nm³ | 138 mg/Nm³ |
| SO₂ | <20 mg/Nm³ | 88 mg/Nm³ |
| CO | 27 mg/Nm³ | 33 mg/Nm³ |
| CO₂ | ~95 kg/GJ | ~101 kg/GJ |
Summary
Emission control is engineering—not luck. Ask your boiler supplier to show you the technologies, tuning logic, and guarantees that keep NOₓ, SOₓ, and CO₂ within legal limits—even across different fuels and loads. Don’t just aim for heat—aim for clean, compliant combustion that satisfies inspectors and stakeholders alike. Choose precision-engineered emissions control. Choose performance that passes the audit. Choose a boiler that breathes cleanly—by design.
What After-Sales Services, Spare Parts Support, and Maintenance Plans Are Included?
Purchasing an industrial steam boiler is a long-term investment, not just in equipment, but in the services, systems, and support that keep it running. Once the flame is lit, your real challenge begins: keeping the boiler operating efficiently, safely, and within emissions and uptime targets for years—sometimes decades. That’s where after-sales services, spare parts logistics, and proactive maintenance planning make all the difference between predictable uptime and costly disruptions.
Buyers must ask what specific after-sales support the supplier includes in the purchase—such as on-site inspections, remote diagnostics, spare parts kits, and preventive maintenance schedules—and whether they offer service contracts (basic, extended, full lifecycle). Also confirm spare parts delivery SLAs, digital support tools, and emergency response timelines.
If you’re buying a boiler, you’re also buying a partnership. Make sure it’s built to last.
After-sales service, spare parts support, and structured maintenance plans are essential for the safe, efficient, and continuous operation of industrial steam boilers.True
Proactive support minimizes downtime, ensures emissions compliance, and extends equipment lifespan—key factors for lifecycle cost control and safety assurance.
Key After-Sales Service Areas to Confirm With Your Boiler Supplier
1. What Is Included in the Standard After-Sales Support Package?
| Service Area | Standard Inclusions |
|---|---|
| Commissioning support | On-site engineer, burner tuning, SCADA test |
| Training | Initial operator and maintenance training |
| Inspection | 1-year checkup or follow-up visit |
| Hotline access | Technical support (often business hours) |
| Documentation | Full QA dossier, spare parts list, wiring diagrams |
Ask:
Are support visits included in the warranty period?
Is commissioning performed by in-house engineers or contractors?
Can you provide remote support post-handover?
2. What Spare Parts Strategy and Inventory Are Offered?
| Part Type | Availability Expectation |
|---|---|
| Critical spares (burner, sensors, actuators) | On-site or <48 hours delivery |
| Wear parts (gaskets, filters, igniters) | Annual or quarterly kits |
| Long-lead items (PLC, fans, refractory) | 4–10 weeks with planning |
| Digital parts catalogue | QR or serial traceable |
Ask:
Is a 1- or 2-year spare parts kit provided at handover?
Do you have regional spare parts stock?
Can spare parts be auto-replenished based on usage data?
3. What Maintenance Plans Are Offered Post-Commissioning?
| Plan Level | Inclusions | Best Use Case |
|---|---|---|
| Basic plan | Hotline, annual check | Low-duty systems |
| Extended plan | Quarterly tuning, O₂ trim, parts discounts | Medium-load plants |
| Full lifecycle | 24/7 support, CEMS monitoring, KPIs | Continuous-process industry |
Ask:
Are performance KPIs (efficiency, uptime) included in the plan?
Do you offer burner-only or control-only support packages?
Is there a digital maintenance dashboard?
4. What Response Times and Emergency Support Are Guaranteed?
| Fault Type | Recommended SLA |
|---|---|
| Major fault/shutdown | Engineer on-site in ≤48 hrs |
| Remote diagnosis | Response in ≤2 hrs |
| Spare parts dispatch | In-stock parts shipped same day |
| CEMS/emissions issue | Within 24–72 hrs (audit risk) |
Ask:
Do you provide SLAs in writing as part of your service contract?
What is your actual response time performance history?
Are support staff based regionally or at HQ?
5. Is There Ongoing Support for Controls, Efficiency, and Emissions?
| Support Area | Typical Inclusions |
|---|---|
| Remote tuning | Adjust burner curve, O₂/CO trim |
| Efficiency tracking | Dashboard or monthly reports |
| Emissions reporting | NOₓ, SO₂, CO trend logs |
| Upgrade advisory | Alerts for parts nearing obsolescence |
Ask:
Can we upgrade burner logic or PLC remotely?
Is remote access encrypted and secure?
Are emissions alerts linked to SCADA or cloud tools?
Sample Boiler Support Plan Snapshot – 10 TPH LFO Unit
Standard Package (included):
Commissioning + 5 days O&M training
1-year technical hotline (business hours)
Digital QA book and maintenance manual
Recommended 2-year spare parts list
Optional Maintenance Add-on:
| Service | Frequency |
|---|---|
| Burner tuning + O₂ trim | Quarterly |
| Refractory inspection | Semi-annual |
| CEMS calibration | Annual |
| Operator refresher training | Annually |
Response Time Performance:
Remote support: 92% of issues solved in <4 hours
Engineer dispatch: 95% within 48 hrs
Parts delivery: 90% of stocked spares in <72 hrs
Summary
Boiler uptime is engineered not just through metallurgy—but through service. When evaluating suppliers, demand clarity on spare parts logistics, SLA-backed support, and structured maintenance planning. Don’t buy a system that works only until the first fault—choose a boiler backed by a team built for the long haul. Choose predictable support. Choose reliable steam. Choose service as powerful as the flame.
🔍 Conclusion
Asking the right technical, regulatory, and service-related questions helps you identify a supplier that not only delivers quality equipment but also supports operational efficiency, safety, and compliance. A trusted industrial steam boiler partner will offer customized engineering, responsive support, and full lifecycle value to ensure your system performs as promised.
📞 Contact Us
💡 Need assistance evaluating steam boiler suppliers? Our team provides technical audits, supplier vetting, and bid evaluation services for industrial steam projects of all sizes.
🔹 Let us help you select a steam boiler supplier who delivers performance, reliability, and results. ♨️🏭✅
FAQ
What certifications and quality standards does your boiler meet?
Ensure the supplier complies with:
ASME Boiler & Pressure Vessel Code
ISO 9001 / ISO 14001
CE or PED for international projects
Local safety and emissions regulations
These standards verify product reliability, safety, and eligibility for global installations.
What are the steam capacity, pressure, and efficiency ratings?
Ask for:
Max steam output (TPH)
Operating pressure and temperature
Thermal efficiency (aim for ≥85%)
Whether it includes economizers or condensing systems for efficiency gains
This helps ensure the boiler matches your process requirements and energy goals.
What fuels are supported, and can the boiler be dual-fuel or future-ready?
Clarify fuel compatibility:
Natural gas, oil, coal, biomass, LPG, or dual-fuel capability
Fuel-switching options in case of price or supply fluctuations
Emissions compliance with low-NOx, sulfur, or PM controls
Fuel flexibility enhances long-term operational and financial adaptability.
What customization options and control systems are available?
Ask whether the boiler can be tailored for:
Specific plant space constraints
Automation levels (PLC/SCADA integration)
Remote monitoring or IoT-enabled diagnostics
Redundancy features (backup burners, dual feedwater pumps)
What after-sales service and spare parts support do you offer?
Confirm the supplier provides:
On-site commissioning and training
Spare parts availability for 10–15+ years
Planned maintenance contracts
24/7 technical assistance or remote service platforms
Performance guarantees or SLAs (Service Level Agreements)
References
ASME Boiler Code Certification Guide – https://www.asme.org
Steam Boiler Efficiency Benchmarks – DOE – https://www.energy.gov
Fuel Type Compatibility in Industrial Boilers – https://www.epa.gov
ISO Certified Boiler Manufacturer Listings – https://www.iso.org
Vendor Evaluation and Selection Criteria – IEA Reports – https://www.iea.org
Smart Boiler Monitoring and Control Solutions – https://www.automation.com
Boiler Maintenance and Lifecycle Planning Tools – https://www.sciencedirect.com
Customer Feedback and Supplier Ratings – https://www.trustpilot.com
Boiler Customization Best Practices – https://www.researchgate.net
Boiler Parts and Service Logistics Guidelines – https://www.bioenergyconsult.com

Wade Zhang
Key Questions to Ask Potential Industrial Steam Boiler Suppliers Read More »


")

-scaled.jpg)