Industrial buyers often begin a boiler project with a straightforward question: How much does a coal-fired boiler cost?
The short answer is that there is no reliable universal price per TPH for an industrial coal-fired boiler. Capacity is an important starting point, but it does not define the equipment that must ultimately be designed and supplied.
A 20 TPH boiler producing moderate-pressure saturated steam can have a very different configuration from a 20 TPH boiler requiring superheated steam, a difficult design coal, extensive fuel and ash handling, stricter emission controls, or additional certification and inspection.
There is another reason published prices vary so widely: “boiler price” does not always describe the same scope. One quotation may cover primarily the boiler and combustion equipment, while another may include fans, coal handling, ash handling, flue-gas treatment, water treatment, controls, freight, or erection services.
So the more useful question is not:
“What is the price per TPH?”
It is:
“What does an industrial coal-fired boiler cost under a defined technical specification and supply scope?”
This guide focuses on the initial purchase cost of industrial coal-fired boiler equipment and the scope behind a manufacturer’s quotation. It does not estimate the total capital investment required to build a utility-scale coal-fired power plant.
What Does an Industrial Coal-Fired Boiler Typically Cost?
Industrial coal-fired boilers are engineered-to-order equipment, so capacity alone does not support a defensible universal purchase-price range.
That does not mean buyers have no way to establish a budget. It means that any useful budget figure must first be tied to a defined basis.
At minimum, a meaningful price reference should identify:
steam capacity;
steam pressure and temperature;
design coal;
combustion configuration;
emission requirements;
applicable manufacturing code;
equipment supply scope;
currency and reference year;
manufacturing origin;
delivery basis such as EXW, FOB, or CIF; and
whether installation is included or excluded.
Without this information, two prices may appear comparable while actually representing very different equipment packages.
Why We Do Not Publish a Generic “2026 Price per TPH” Table
There are published industrial-boiler cost data, but much of the authoritative information was developed for a specific period, geography, or project-cost basis.
For example, the U.S. Environmental Protection Agency published detailed industrial-boiler cost studies that distinguish equipment cost, direct installation cost, and indirect capital cost. These documents remain useful for understanding how boiler-project costs are structured, but the detailed cost tables use a June 1978 cost basis. They should not be relabeled as current commercial boiler quotations.
A later peer-reviewed study by Han, Shen, and Zhang examined the fixed and operating costs of industrial-boiler alternatives in China using period- and location-specific economic conditions. That study is useful for understanding industrial-boiler economics in its original analytical context, but it is not a current global price list for new coal-fired boiler purchases.
For this reason, this guide does not convert historical engineering data, marketplace listings, or unrelated project costs into an artificial “current market price” table.
A price that looks precise but does not disclose its scope is often less useful than a broader quotation based on an actual project specification.
Separates equipment purchase from installed project cost
The practical conclusion is simple:
A current project-specific budget should come from a defined design basis and supply boundary, not from a universal USD-per-TPH formula.
What Does a Coal-Fired Boiler Price Actually Include?
Before comparing quotations, buyers should establish each proposal’s battery limits, or supply boundary.
Even established engineering cost methodologies separate the boiler itself from coal handling, ash handling, water treatment, installation, and other project costs rather than treating them as one interchangeable number.
The boiler itself and the complete boiler project are not automatically the same scope.
Core Boiler Equipment
Depending on boiler type and contract definition, the manufacturer’s core supply can include:
pressure parts;
steam and mud drums where applicable;
furnace and heating surfaces;
combustion equipment;
supporting steel structure;
standard valves and fittings;
local instrumentation; and
specified boiler accessories.
The exact boundary should always be confirmed in the supplier’s technical proposal.
Extended Boiler-System Supply
A broader manufacturer package may additionally cover:
economizer;
air preheater;
ID and FD fans;
boiler feedwater equipment;
coal feeding and conveying;
fuel-preparation equipment where required;
bottom-ash and fly-ash handling;
particulate-control equipment;
SO₂ or NOₓ control systems where required;
PLC and instrumentation;
water treatment;
ductwork and chimney-related equipment; and
commissioning or erection services.
None of these items should be assumed to be included simply because two suppliers describe their boilers using the same nominal steam capacity.
A Practical Price-Scope Checklist
Item
What the Buyer Should Confirm
Boiler pressure parts
Exact pressure-part boundary
Combustion equipment
Type and included mechanical scope
Economizer / air preheater
Included, optional, or excluded
ID / FD fans
Quantity, specification, motors, and controls
Feedwater equipment
Supplier or owner scope
Coal feeding / conveying
Equipment boundary and storage interface
Ash handling
Bottom ash, fly ash, and storage boundary
Particulate / SO₂ / NOₓ control
Required system and supplier responsibility
PLC / DCS interface
Control scope and plant interface
Water treatment
Supplier or owner scope
Freight
Delivery term and destination
Installation
Included, supervised, or owner-contracted
Civil works
Separate or included contractually
A price comparison becomes meaningful only when the technical specification, equipment boundary, and commercial basis are aligned.
What Factors Actually Affect the Purchase Price?
For budgeting purposes, the useful question is how each requirement changes what the manufacturer has to design and supply—not how to design the complete boiler plant.
Steam Capacity
Higher steam output generally requires greater furnace capacity, heat-transfer surface, pressure-part capacity, structural support, and auxiliary-system capacity.
However, cost does not scale in a perfectly linear relationship with TPH. Different systems within the boiler package scale differently, and project-specific auxiliaries can change independently of the nominal steam capacity.
Taishan Group’s published project portfolio illustrates this limitation. It includes a 20 TPH coal-fired steam boiler for a textile plant in Pakistan, separate 2 × 20 t/h fluidized-bed boiler EPC projects in Vietnam, and a 12 TPH anthracite-fired boiler for a paper producer.
These projects cannot be treated as interchangeable products simply because some of their nominal capacities are similar.
Two boilers with the same TPH but different steam conditions may require different pressure-part designs and equipment configurations.
Higher design pressure or temperature can affect:
pressure-part dimensions;
material selection;
welding requirements;
examination and testing;
superheater configuration where applicable; and
inspection and certification scope.
For projects manufactured to the ASME Boiler and Pressure Vessel Code, Section I addresses the construction of power boilers, while related BPVC sections cover areas such as materials, nondestructive examination, and welding qualifications.
The relevant pricing point is not that one code universally adds a fixed premium. Rather:
Boilers built under different code, inspection, certification, and project-specification requirements should not automatically be assumed to have identical manufacturing scope or cost.
Coal Characteristics
“Coal” is not a complete fuel specification.
Relevant properties include:
heating value;
moisture;
ash;
sulfur;
volatile matter; and
ash characteristics relevant to the selected combustion system.
The U.S. EPA’s AP-42 combustion guidance maintains separate technical sections for bituminous and subbituminous coal, anthracite, and lignite, reflecting meaningful differences in fuel and combustion behavior.
From a purchase-price perspective, coal properties can affect:
furnace configuration;
fuel preparation and feeding;
combustion-air systems;
wear protection;
ash-removal capacity; and
flue-gas treatment.
A quotation developed for one design coal therefore should not automatically be treated as valid for a materially different coal.
Chain-grate, fluidized-bed, and circulating fluidized-bed boilers do not share identical mechanical arrangements.
Different technologies may require different:
furnace structures;
fuel feeding;
primary and secondary air systems;
refractory;
solids handling;
ash-removal systems; and
controls.
This does not justify applying a universal cost multiplier to one technology versus another.
The combustion system should first be selected according to the fuel, capacity, operating conditions, and project requirements. Price should then be compared between technically equivalent proposals.
Emission Requirements
Emission requirements can materially change the equipment included in a boiler quotation.
In the United States, for example, EPA regulations for industrial, commercial, and institutional boilers differ by source classification and other regulatory criteria. EPA’s major-source boiler requirements address pollutants including mercury, hydrogen chloride, particulate matter, and carbon monoxide for covered sources, while area-source boilers are governed under a separate regulatory framework.
International projects may be subject to very different emission limits.
Therefore:
There is no universal emission-control package that should automatically be added to every coal-fired boiler quotation.
The manufacturer needs to know the actual project location and permitted emission limits before defining whether particulate, SO₂, NOₓ, monitoring, or other control systems are required.
A basic local control package and a highly integrated boiler plant connected to an existing DCS are not equivalent scopes.
Requirements may include:
PLC architecture;
combustion and safety interlocks;
motor control;
field instrumentation;
variable-frequency drives;
alarms and protection;
data logging; and
communication with the plant DCS.
For price comparison, these requirements should be listed explicitly rather than summarized as “automatic control included.”
Why Are Coal-Fired Boiler Prices Online So Different?
Large differences between published boiler prices do not necessarily mean that one supplier is dramatically cheaper than another.
Often, the prices simply describe different equipment or commercial scopes.
Equipment-Only vs. Complete Boiler-System Price
A relatively low published figure may represent the core boiler package.
Another quotation may include:
boiler + combustion system + fans + fuel handling + ash handling + environmental controls + water system + automation.
Those two figures are not answering the same commercial question.
Standard Configuration vs. Engineered-to-Order Design
A standard configuration for commonly used coal and conventional industrial steam conditions is not equivalent to a project engineered around:
unusual or variable fuel;
higher steam parameters;
demanding emission limits;
special certification;
additional inspection;
extensive auxiliaries; or
unusual site requirements.
The more project conditions deviate from the manufacturer’s standard design basis, the less useful a generic online listing becomes.
EXW, FOB, and CIF Are Different Commercial Bases
International quotations also need to be compared using the same delivery basis.
Under Incoterms® 2020, EXW, FOB, and CIF allocate transport obligations, costs, and risks differently.
In simplified terms:
EXW places the goods at the buyer’s disposal at the agreed location;
FOB includes delivery on board the nominated vessel at the agreed port of shipment;
CIF additionally requires the seller to arrange specified carriage and insurance to the named destination port.
For example, USD 500,000 EXW and USD 500,000 CIF do not represent the same commercial offer, even if the equipment itself is identical.
The amount above is purely illustrative and is not a coal-fired boiler price benchmark.
Marketplace Listing vs. Engineering Quotation
A marketplace or public product listing may represent:
a base model;
an indicative lead-generation figure;
equipment-only supply;
a broad capacity series; or
a configuration that does not satisfy the buyer’s actual coal and emission requirements.
For engineered industrial equipment, a public listing should therefore be treated as an initial reference—not as evidence of what a specific project should cost.
Historical Cost Data vs. Current Commercial Pricing
Historical engineering studies can be valuable for understanding cost structure, but their monetary values should remain tied to their original year and geography.
For example:
the detailed EPA industrial-boiler cost study uses a 1978 cost basis;
the Han, Shen, and Zhang study analyzed industrial-boiler economics under period- and location-specific Chinese conditions.
Neither source should be relabeled as a current global boiler quotation.
Material costs, labor, certification, logistics, environmental requirements, exchange rates, and project specifications all change over time.
Boiler Purchase Price vs. Total Installed Cost
The manufacturer’s boiler quotation is not automatically the total investment required to bring the steam plant into operation.
The broader project can include:
foundations and civil construction;
boiler-house structures;
on-site erection;
steam, water, and other interconnecting piping;
electrical distribution;
fuel-storage infrastructure;
site coal conveying;
water and utility connections;
erection equipment;
local permits and inspections;
import duties and taxes; and
systems supplied by the owner or EPC contractor.
This distinction also appears in established engineering-cost methodologies, which separate equipment cost from installation and other capital-cost categories.
So when one quotation appears substantially higher than another, the first question should not necessarily be:
“Why is this boiler more expensive?”
It should be:
“Are these quotations based on the same technical conditions and the same supply boundary?”
This guide deliberately does not apply a generic multiplier between boiler purchase price and installed project cost because that relationship varies too much with site conditions, country, project scope, and contracting strategy.
What Information Is Needed for a Meaningful Budgetary Boiler Price?
A buyer does not need to finish detailed engineering before requesting an initial quotation.
But an inquiry such as:
“Please quote a 20 TPH coal-fired boiler.”
still leaves several major design and scope variables undefined.
Providing the following information allows a manufacturer to develop a much more meaningful budgetary proposal.
Technical Information
Requirement
Information to Provide
Steam capacity
TPH or kg/h
Working / design pressure
bar or MPa
Steam condition
Saturated or superheated
Steam temperature
°C where applicable
Feedwater temperature
If available
Fuel
Primary and backup fuel
Coal analysis
Heating value, moisture, ash, sulfur, volatile matter, and available ash data
Emission limits
Applicable project limits
Operating profile
Continuous, variable load, or other requirements
Applicable code
ASME, local code, or project specification
Scope and Commercial Information
The buyer should also identify, where possible:
coal feeding and handling requirements;
ash-handling scope;
particulate-control requirements;
SO₂ / NOₓ requirements;
water-treatment scope;
automation requirements;
project destination;
requested delivery term;
installation or erection-supervision requirements; and
third-party inspection or certification requirements.
This moves the discussion from a generic capacity inquiry toward a defined:
That is the foundation of a useful budget quotation.
A Low Purchase Price Does Not Automatically Mean a Low-Cost Boiler
Purchase price is only the initial capital decision.
Over the operating life of a coal-fired boiler, economics can also be affected by fuel consumption, auxiliary electricity, maintenance, refractory and wear parts, labor, water treatment, ash handling, and environmental-system operation.
These are total-cost-of-ownership questions, not purchase-price questions, so they should not be mixed into a basic equipment-price comparison.
A more useful procurement sequence is:
First compare technically equivalent purchase scopes; then evaluate the long-term economics of the shortlisted alternatives.
How much does an industrial coal-fired boiler cost?
There is no reliable universal price based on TPH alone.
A meaningful purchase-price estimate requires the boiler capacity and steam conditions, design coal, combustion configuration, emission requirements, manufacturing and certification requirements, equipment scope, destination, and commercial delivery basis.
Published historical cost studies can provide engineering context, but their figures should not be treated as current commercial quotations unless the year, geography, technical basis, and scope are comparable.
How much does a 10 TPH coal-fired boiler cost?
A 10 TPH rating alone is insufficient for a responsible price estimate.
For example, a boiler producing relatively moderate-pressure saturated steam can require a different equipment package from a 10 TPH boiler requiring superheated steam, more extensive fuel preparation, stricter emission-control equipment, or a broader auxiliary-system scope.
A meaningful budget therefore requires more than capacity.
Does boiler capacity determine the price?
Capacity is one of the major price drivers, but it does not determine the final quotation by itself.
Steam pressure and temperature, coal properties, combustion configuration, emissions requirements, manufacturing code, automation, auxiliary systems, and contractual supply scope can all affect the equipment that must be supplied.
Is installation included in a coal-fired boiler price?
Not necessarily.
Some quotations cover primarily equipment supply. Others may include erection supervision, installation services, or a broader turnkey or EPC scope.
The installation boundary should therefore be stated explicitly in the technical and commercial proposal.
Why do two manufacturers quote different prices for the same TPH?
The two proposals may not actually be technically or commercially equivalent.
Compare at least:
steam parameters;
design coal;
combustion configuration;
manufacturing code and certification;
emission-control scope;
auxiliaries;
automation;
delivery term; and
installation boundary.
Only after these conditions are aligned does a direct price comparison become meaningful.
Can a manufacturer quote a boiler from capacity alone?
Capacity is enough to start a preliminary discussion, but usually not enough to establish an accurate project quotation.
Providing steam conditions, coal analysis, emission limits, project destination, and required supply scope allows the manufacturer to prepare a substantially more useful budgetary proposal.
Conclusion
There is no responsible universal answer to “How much does an industrial coal-fired boiler cost?” based on TPH alone.
That is not because boiler pricing is unknowable. It is because the price only becomes meaningful when the technical specification and commercial scope behind it are defined.
Before comparing suppliers, establish three things:
Are the boilers designed for the same steam conditions and design coal?
Do the quotations include the same auxiliary and environmental systems?
Are the delivery terms and contractual supply boundaries comparable?
Once these conditions are aligned, price becomes a useful procurement metric instead of a potentially misleading number.
For a project-specific budgetary quotation, provide your required steam capacity, pressure and temperature, available coal analysis, applicable emission limits, project destination, and expected supply scope.
References
U.S. Environmental Protection Agency — Capital and Operating Costs for Industrial Boilers
Historical engineering cost study covering industrial-boiler equipment, installation, and capital-cost categories. The detailed monetary data use a 1978 cost basis and are not treated here as current commercial prices.
U.S. Environmental Protection Agency — Cost Equations for Industrial Boilers
Documents industrial-boiler costing methodology and the separation of equipment, installation, and indirect capital costs.
U.S. Environmental Protection Agency — AP-42, Chapter 1: External Combustion Sources
Technical combustion resource covering bituminous/subbituminous coal, anthracite, lignite, and other external-combustion fuels.
ASME — 2025 ASME Boiler and Pressure Vessel Code
Official information on the ASME BPVC, including Section I requirements for power boilers and related code sections covering materials, examination, and welding qualifications.
Taishan Group — Industrial Boiler Project Cases
Published industrial-boiler project references covering different capacities, combustion configurations, industries, and project scopes.
Waste heat recovery boilers sit at one of the most financially sensitive points in any process plant — they’re converting exhaust heat that would otherwise vanish up a stack into usable steam or hot water, which means every percentage point of lost efficiency is money burned twice. Yet in practice, WHRB maintenance gets deprioritized in favor of the prime mover or the downstream process. The result is predictable: fouled convection banks quietly choke heat transfer, acid condensate eats through tube walls at 0.5–2.0 mm per year in neglected dewpoint zones, and what should be a sub-one-day annual outage record turns into 3–7 unplanned shutdown days that nobody budgeted for. Thermal efficiency that should sit between 85% and 92% on a well-kept unit slides 3–8 points lower, and the losses compound across every operating hour.
The best practices for routine WHRB maintenance cover five core areas: controlling flue gas acid dewpoint above 130–160°C to prevent cold-end corrosion, maintaining boiler water pH at 10.5–11.5 with dissolved oxygen below 0.007 mg/L, executing soot blowing on a schedule that prevents fin tube fouling from raising pressure drop by 20–40%, performing annual internal inspections per ASME Section I or EN 12952, and managing blowdown to keep drum TDS within 200–500 ppm.
What most maintenance programs miss isn’t the big inspections — those get scheduled, eventually. It’s the slow, accumulating damage from skipped water chemistry checks, irregular soot blowing intervals stretched by production pressure, and dewpoint excursions that go unnoticed for weeks because nobody installed the right thermocouple in the right location. Each of those gaps looks minor in isolation. Together, they define whether your WHRB is an asset or a liability.
Establishing a WHRB Maintenance Schedule: Daily, Weekly, Monthly, and Annual Tasks
A maintenance schedule is only useful if people actually follow it — and if the intervals match the real degradation rates of the equipment, not just whatever the OEM manual suggests for “typical” service. Waste heat recovery boilers vary enormously in duty: a WHRB sitting downstream of a cement kiln sees a very different fouling rate than one recovering heat from a gas engine exhaust. So treat what follows as a framework you calibrate to your plant, not a one-size prescription.
Daily Operator Rounds
Every shift, the operator should walk the boiler with purpose, not just glance at the DCS screen from the control room. Drum water level is the first number to check — deviation beyond ±25 mm from the normal operating level is a leading indicator of feedwater control valve drift, a sticking level transmitter, or a developing tube leak. Steam pressure and flue gas inlet/outlet temperatures tell you whether the heat source has changed or whether the convection bank is fouling; a flue gas outlet temperature creeping up 15–20°C over two weeks with no change in load almost always means soot buildup on the fin tubes. Log feedwater flow rate and blowdown volume every shift. These aren’t formalities — a sudden drop in feedwater flow at steady load points to a partially blocked strainer or pump cavitation before it becomes a trip.
Blowdown logs also close the water chemistry loop between shifts. If the operator doing bottom blowdown every 8–12 hours isn’t recording it, the next shift has no baseline.
Weekly Tasks
Soot blower operation deserves more attention than most plants give it. Confirm that each blower completes its full travel cycle — a blower that stalls mid-stroke leaves a shadow zone where fouling accelerates, and within a few months you can see a 20–40% increase in flue gas pressure drop across the convection bank. Check the chemical dosing pump stroke rates and compare against the setpoints; phosphate or oxygen scavenger pumps drift, especially in hot utility rooms, and nobody notices until the next water sample comes back wrong.
Walk the casing panels and expansion joints. Hot spots on casing steel — discoloration, paint blistering — are early signs of refractory failure or gas bypass. Catching a failed expansion joint seal early costs a few hours of caulking; missing it costs a full refractory repair during an unplanned outage. Test the low-water cutoff device by slowly lowering the drum level manually while watching for the trip response. Do this weekly, log the result, and sign it. Regulators in most jurisdictions want that record.
Monthly Tasks
Pull a full water sample to the laboratory — not just a field pH strip. You need pH, conductivity, dissolved oxygen, silica, iron, and hardness. Drum water pH should sit in the 10.5–11.5 band; dissolved oxygen below 0.007 mg/L. Silica matters particularly for high-pressure units where silica carryover into steam causes turbine blade deposits. Iron levels rising month-on-month usually indicate either oxygen pitting in the feedwater system or flow-accelerated corrosion in economizer tubes.
Lubricate circulating pump bearings per the manufacturer’s interval — typically every 500–1,000 operating hours, though this depends on bearing type and ambient temperature. Check the relief valve visually for seat weeping or corrosion buildup that could cause it to stick open or fail to reseat cleanly.
Annual Shutdown Inspection
Task
Frequency
Responsible Party
Acceptance Criterion
Documentation
Internal drum inspection
Annual
Certified inspector + plant engineer
No cracking, pitting, or deposit buildup >1 mm
Inspection report, photo record
Tube UT thickness measurement (erosion zones)
Annual
NDT technician
Remaining wall ≥ design minimum per ASME B31.1 or EN 12952
UT scan report with zone map
Refractory lining assessment
Annual
Refractory specialist
No spalling, cracking, or hot-face erosion >10% thickness
Inspection checklist
Hydrostatic leak test
Every 3–5 years or per local code
Plant engineer + insurer
No leaks at 1.25–1.5× MAWP held for 30 min
Pressure test certificate
Safety valve set pressure verification
Annual
Certified valve technician
Set pressure within ±3% of stamped value; matches current operating permit
Calibration certificate
Expansion joint and casing full inspection
Annual
Plant maintenance crew
No cracking, bypass gaps, or insulation voids
Written checklist
Chemical treatment system audit
Annual
Water treatment specialist
Dosing rates, chemical stock, and program aligned with current feedwater quality
Treatment audit report
The hydrostatic test interval — every 3–5 years — depends on jurisdiction. Some insurance underwriters and local boiler inspection authorities in Southeast Asia and the Middle East require it more frequently for units operating above 2.5 MPa. Confirm against your current operating permit, not just the ASME or EN standard, because local regulations can be stricter.
Neglecting annual tube ultrasonic thickness surveys on high-erosion zones of a WHRB can allow wall thinning to progress undetected until a tube failure causes an unplanned outage lasting 3–7 days, compared to less than 1 day for well-maintained units.True
Erosion rates in high-velocity flue gas zones are well-documented in ASME and EN inspection frameworks; UT surveys are the primary non-invasive method for tracking wall thickness reduction before failure threshold is reached. The outage duration range reflects published industry data on WHRB forced outages caused by deferred maintenance.
In practice, most plants that run into chronic tube failures aren’t missing the annual shutdown — they’re doing visual inspections only and skipping the UT survey because it takes an extra day and costs a few thousand dollars. That’s the wrong trade. If your CMMS doesn’t have these tasks built in with assigned ownership and a mandatory sign-off field, the schedule exists only on paper.
Boiler Water Chemistry Control: Feedwater Treatment, Drum Water Quality, and Blowdown Management
Of all the variables that determine how long a waste heat recovery boiler lasts, water chemistry is probably the one most underestimated by plant operators — and the most expensive to get wrong. Mechanical wear you can see. Scale buildup you can’t, at least not until you’re pulling tube samples or chasing an unexplained steam temperature deviation.
Here’s the physics that matters: a scale deposit of just 0.3 mm — thinner than a credit card — can raise tube wall temperature by 50–100°C above the design value. That range depends on the deposit composition (calcium carbonate scale is bad; silica-rich scale is worse, with thermal conductivity roughly 5–10× lower than calcium-based deposits) and the local heat flux. At elevated wall temperatures, creep mechanisms accelerate, oxide layer spalling becomes a real risk, and what should have been a 20-year tube is now a 7-year tube. You don’t always get a visible failure warning. Sometimes the first sign is a pinhole leak during a load swing.
Feedwater Quality Targets You Actually Have to Hit
Drum-type WHRBs are not forgiving on feedwater. Targets worth treating as hard limits:
Hardness: below 0.03 mg/L as CaCO₃. Even trace hardness will precipitate on tube walls under the high heat flux in the evaporator section.
Dissolved oxygen: below 0.007 mg/L. This is the deaerator’s job, and it needs verification — not assumption.
Iron: below 0.05 mg/L. Corrosion product iron from upstream piping is a sneaky contributor to deposit formation, especially in economizer tubes where temperatures are cooler and magnetite can settle.
Feedwater pH: 8.5–9.5. Drum water pH: 10.5–11.5.
A 0.3 mm scale deposit on a WHRB evaporator tube can increase tube wall temperature by 50–100°C above design, accelerating creep and oxidation failure.True
This is consistent with heat transfer engineering principles — scale acts as insulation, forcing the tube wall to absorb heat that would normally transfer to the water side. The exact temperature rise depends on deposit thermal conductivity and local heat flux, with silica-rich scales at the worse end of the range.
Chemical Dosing Programs: Tied to Flow, Not to Habit
Oxygen scavengers are non-negotiable. For lower-pressure units (below roughly 40 bar), sodium sulfite is common and cost-effective. For higher-pressure applications, sodium sulfite can break down into sulfur dioxide and contribute to acid corrosion in the steam circuit, so catalyzed sodium bisulfite or hydrazine alternatives — carbohydrazide, diethylhydroxylamine — become the standard choice. Dosing rates must be proportional to feedwater flow and adjusted based on real-time conductivity readings, not a fixed weekly pump setting. I’ve seen plants where the dosing pump rate hadn’t been touched in two years despite a 30% increase in production throughput. Predictable outcome.
Scale inhibitors and alkalinity builders round out the program. Anti-foam agents are worth including if your process produces contaminated condensate returns — common in food processing or chemical plant waste heat applications where trace organics find their way back to the boiler.
Blowdown: Balance Is Everything
Continuous surface blowdown controls dissolved solids and silica at the drum waterline, where concentration is highest. For most drum-type WHRBs, target TDS in the drum water runs 200–500 ppm, with the actual limit depending on operating pressure — higher pressure units require tighter control because silica volatility increases sharply above roughly 100 bar.
Bottom blowdown is a different function: it removes sludge and suspended solids that settle at the drum bottom. Every 8–24 hours is typical, with frequency driven by feedwater hardness and iron loading. A plant running on high-TDS well water or river water makeup needs more frequent bottom blowdowns than one running on high-quality demineralized water.
Both directions of error cost money. Over-blowdown wastes thermal energy — you’re dumping hot water that had to be heated — and drives up makeup water consumption and chemical costs. The energy loss from excessive blowdown is usually invisible on a daily basis but adds up to a meaningful efficiency penalty over a year, often 1–3% of total heat input depending on blowdown rate and operating pressure. Under-blowdown causes scale buildup, risks caustic embrittlement in zones where concentrated caustic contacts stressed steel, and can cause carryover — dissolved or entrained solids contaminating the steam or process heat circuit downstream.
Deaerator Performance: The Step Most Plants Skip
The deaerator is where dissolved oxygen is supposed to be stripped before feedwater enters the boiler. In practice, deaerator performance degrades quietly. Tray fouling, vent valve drift, and spray nozzle erosion all reduce stripping efficiency — and dissolved oxygen spikes during startup or rapid load swings are a leading cause of pitting corrosion in economizer tubes, which are the coldest surface in the system and the first place oxygen attack shows up.
Verify deaerator outlet dissolved oxygen at least weekly with an inline analyzer, not just during commissioning. During plant startup after a cold shutdown, give the deaerator enough time to reach stable operating temperature before routing feedwater to the boiler. Rushing startup to meet production pressure is one of the more reliable ways to pit an economizer.
The flue gas side is where most WHRB maintenance battles are actually fought. Water chemistry gets more attention in the manuals, but in cement kiln recovery boilers, steel EAF off-gas units, and waste incineration WHRBs, gas-side fouling is what kills availability and drives unplanned outages. Understanding the mechanism — not just the checklist — determines whether your interventions actually work.
How Fouling Builds Up in Convection Banks
Particulate ash, condensed sulfates, and carbonaceous residue accumulate on fin tube and bare tube surfaces through a combination of inertial impaction and thermophoretic deposition. The leading rows of each tube bank take the worst of it. Fin tubes are especially vulnerable because the fins create local low-velocity zones where fine particles settle and bond, particularly when flue gas temperatures are high enough to partially sinter ash onto the surface.
Left unmanaged, this deposit layer degrades the overall heat transfer coefficient by roughly 15–30% and raises flue gas-side pressure drop by 20–40% — and both effects can develop within five or six months in a high-dust application. The pressure drop increase is often the first thing operators notice: induced draft fan current creeps up, and eventually you’re running the fan harder just to push gas through a half-blocked bank.
Soot Blower Selection Is Not Generic
Three types see regular use in WHRBs, and choosing the wrong one wastes money or simply doesn’t clean.
Rotary rake blowers work well for horizontal tube banks with moderate ash loads — typical in gas turbine exhaust or diesel engine WHRBs where dust burden is relatively low and deposits stay loose. They’re mechanically simple and cheap to maintain.
Retractable long-lance blowers are the right answer for deep tube bundles in cement or steel WHRBs, where you need steam or air penetration well into the bank. The lance travels into the flue gas duct during operation and retracts when done, which protects the lance tip from continuous heat exposure. At flue gas temperatures above roughly 650–750°C, you need a water-cooled lance housing or you’ll be replacing tips constantly.
Acoustic cleaners suit dry, low-cohesion ash — fly ash from certain biomass or coal-fired processes — where deposits haven’t sintered. They’re low-maintenance and avoid steam consumption, but they genuinely don’t work on sticky, sulfate-bonded deposits. Specifying acoustic cleaners on a cement kiln WHRB because they’re cheaper is a mistake that shows up in six months.
Blowing interval depends entirely on duty. Cement kiln WHRBs typically require soot blowing every 4–8 hours. A clean gas turbine exhaust WHRB can often run 12–24 hours between cycles. The right interval should be confirmed during commissioning by trending pressure differential across each tube bank — not copied from a generic O&M template.
Acid Dewpoint: The Cold-End Corrosion You Can’t See Until It’s Too Late
Any process with sulfur in the fuel or feedstock — combustion of heavy oil, co-processing in cement kilns, RDF blends in waste incineration — generates SO₃ in the flue gas. SO₃ combines with moisture to form sulfuric acid vapor, which condenses on tube surfaces once local metal temperature drops below the acid dewpoint. Depending on SO₃ concentration, that dewpoint sits somewhere between 130°C and 160°C.
Flue gas exit temperature at the cold-end economizer should be maintained at least 15–25°C above the calculated acid dewpoint to prevent condensation corrosion on carbon steel tube surfaces.True
This margin accounts for local temperature non-uniformity across the tube bundle and transient load swings; tighter margins routinely result in concentrated acid attack on economizer tube rows, confirmed by plant inspection records in sulfur-bearing flue gas applications.
The economizer cold end needs adequate insulation on the casing and, in some installations, air preheating of combustion or dilution air to keep metal wall temperatures above the threshold. Carbon steel corrodes at 0.5–2.0 mm per year in condensation zones if this is neglected — and that’s a range that depends heavily on actual SO₃ concentration and duty cycle. Some plants get five years before a tube fails; others see pinhole leaks within eighteen months. The difference is usually whether anyone was actually monitoring flue gas exit temperature under turndown conditions, when exit temperatures drop and risk spikes.
Ash Hopper Management: The Detail That Causes Erosion
Plugged hoppers are underestimated. When ash bridges in a hopper and doesn’t clear, the tube bank above it effectively sits in a pool of recirculating ash-laden gas. Erosion rates on leading tube rows increase sharply — velocity-squared sensitivity means even a modest local flow disturbance accelerates wear dramatically.
Hopper inspection and clearing should run at least every 8–12 hours in high-ash applications, and every shift is better. Vibrating pads or aerators on hopper walls help, but they don’t substitute for someone actually confirming ash is flowing. A thermocouple at the hopper discharge is worth fitting if you’re dealing with sintering ash — rising temperature there is an early warning of blockage.
Chloride Attack in Waste and Biomass WHRBs
WHRBs on municipal solid waste incineration or biomass gasification duty face a different threat: HCl in the flue gas. Above roughly 10 ppm HCl partial pressure, standard carbon steel and even 304-grade stainless will suffer aggressive corrosion, particularly in the 350–550°C metal temperature zone where alkali chloride condensation is most active.
For these applications, tube selection matters enormously. TP310S offers reasonable chloride resistance in moderate-duty zones. For high-concentration HCl environments or superheater tubes exposed to both high temperature and chloride, Inconel 625 cladding is the realistic answer — expensive upfront, but the alternative is tube replacements every two to three years. Tube thickness checks in these zones should run on 6-month intervals using ultrasonic measurement, not annual visual inspection. By the time you see external wastage, you may have lost a third of the wall thickness already.
Mechanical and Structural Inspection: Tubes, Drums, Headers, Refractory, and Expansion Systems
Physical degradation in a WHRB rarely announces itself before it becomes serious. A tube that’s been thinning for two years at a bend section won’t give you much warning — the first sign is often a rupture during peak load, followed by an unplanned shutdown that runs three to seven days if you’re unlucky with parts availability. Catching that tube at the annual inspection, when wall thickness has dropped below the ASME PG-27 calculated minimum but the unit is still serviceable, is the entire point of structured mechanical inspection.
Tube Inspection: Where to Look and What to Measure
During every annual shutdown, every accessible tube surface should get a visual pass — not a walk-by glance, but a close inspection with a torch and mirror for external scale deposits, pitting, surface blistering, and weld seam cracking. Pay particular attention to the first two or three tube rows in the flue gas flow path, which take the highest particle impact loading in cement, steel, and waste-to-energy WHRBs. Bend sections are consistently the worst spots for wall thinning; flow turbulence and erosion combine there in a way that’s hard to predict from process data alone.
Ultrasonic thickness testing (UT) should be carried out at all erosion-prone locations — first tube rows, bends, immediately downstream of any flow disturbance such as a baffle edge or sootblower nozzle. Establish your minimum acceptable wall thickness from the design pressure calculation per ASME PG-27 (or EN 12952-3 if that’s your code basis), and hold those numbers in a spreadsheet with the original design thickness. Once you’re trending readings, you can project a thinning rate and estimate remaining useful life. In practice, a tube thinning at 0.1–0.3 mm per year in a moderate-dust application might have eight to twelve years of service life remaining; one in a high-erosion cement clinker cooler WHRB might be down to two or three years. You need the data to know which situation you’re in.
Drum and Header Condition
Internal drum inspection deserves more attention than it typically gets. The waterline zone is where oxygen pitting tends to concentrate — even with good feedwater chemistry, any lapse in dissolved oxygen control leaves its mark here. Look for pitting at and just below the normal waterline, and probe suspicious areas with a depth gauge. Ligament cracking between tube holes is a more serious finding; magnetic particle testing (MT) or liquid penetrant testing (PT) will pick up surface cracks that are invisible to the naked eye, particularly in older units that have accumulated significant thermal cycling. While you’re inside the drum, confirm that separators, demisters, and downcomers are properly seated and undamaged. A displaced demister causes carryover; carryover causes steam-side deposits and superheater problems that trace back to a loose component nobody checked.
Headers need similar scrutiny, especially at ligaments and at stub tube welds, which are common crack initiation sites in units that see frequent load cycling.
Refractory and Insulation Integrity
Refractory failures in the inlet gas duct are easy to overlook because the damage is often internal. Cracks and spalled lining allow two failure modes simultaneously: hot gas bypass that skews temperature distribution across the tube bank, and cold air infiltration that drops local flue gas temperature below the acid dewpoint. Roughly a 5% air infiltration rate at the inlet translates to a 2–3% reduction in thermal output and meaningfully elevates cold-end corrosion risk — which, if the gas contains SO₂ from sulfur-bearing fuels or waste streams, can drive tube wall loss of 0.5–2.0 mm per year in the affected zone. During shutdown, probe the lining systematically with a hammer; a hollow sound indicates debonding. Any section that moves or breaks free under light pressure needs to be replaced before restart, not patched with castable and hoped for.
Expansion Joints, Casing Seams, and Gas Leakage
Thermal cycling is hard on compensator bellows and casing seam welds. Over years of operation, fatigue cracks develop along welds and at the convolutions of expansion joints, and the early sign is almost always ash staining or paint discoloration on the outside of the casing — fine particulate finds its way through gaps that are too small to see directly. A smoke pencil test during operation, where access allows, will confirm active gas leakage paths. Don’t underestimate leakage: besides the efficiency loss, outward leakage means hot combustion gas contacting structural steel or insulation jacketing, which is a fire and structural degradation risk in some configurations.
Support Structures and Tube Hangers
Check that all tube hanger rods are within their designed vertical travel limits and that no tube is bearing against a baffle or support plate due to differential thermal expansion. This is one of those inspection points that gets skipped because it looks fine during cold shutdown — but during operation, tubes grow significantly, and a hanger that’s bottomed out or a tube that’s wedged against a support plate will develop fretting corrosion and eventually fatigue cracking at the contact point. It’s a slow-developing problem that typically takes several cycles to become visible, so trending hanger positions against original design drawings is worth the effort.
Trending ultrasonic wall thickness readings over multiple inspection cycles allows remaining tube life to be projected with reasonable accuracy, enabling planned replacement rather than reactive repair after tube failure.True
UT trending is a standard fitness-for-service methodology per API 579 / ASME FFS-1 and EN 12952. Wall thinning rate projection from sequential measurements is well-established practice in pressure vessel inspection.
Every measurement, every visual finding, every hanger position reading goes into a documented inspection record — not a folder that no one opens until the next shutdown, but a trending database that engineers actually review when planning the following year’s maintenance window. That’s the difference between knowing your WHRB’s condition and just hoping it holds together until the next scheduled outage.
Safety Valve, Instrumentation, and Control System Calibration for Regulatory Compliance
This is the area where maintenance teams most often cut corners — and where the consequences show up not as gradual efficiency loss but as sudden shutdowns, failed insurance inspections, or worse. Getting the chemistry right and keeping the tubes clean matters enormously, but if your safety systems aren’t calibrated and tested, you’re operating a pressure vessel on assumptions.
Safety Relief Valve Testing
Lift-test every safety relief valve at its nameplate set pressure on a 12-month interval, no exceptions. In practice, many plants tie this to their annual statutory inspection to minimize downtime, which is fine as long as the interval doesn’t creep past 14 months. What you’re checking: that the valve opens at the correct pressure, reseats cleanly without weeping, and that set pressure hasn’t drifted beyond ±3% of the nameplate value. Drift beyond that threshold is grounds for immediate replacement or recalibration — not a “monitor it” situation.
Full disassembly and bench testing every 3–5 years is required under ASME Section I and most equivalent national pressure vessel codes. During bench testing, check the disc, nozzle seat, and spring for corrosion or wear. On WHRBs that handle flue gas with sulfur compounds, condensate can wick back through the discharge piping and corrode the valve internals from the outlet side — something you won’t catch without taking the valve apart.
One thing that gets missed surprisingly often: discharge piping support. Reaction forces during a full-lift event are substantial, and if the discharge pipe isn’t independently supported, those forces transfer directly into the valve body, distorting the seat alignment. I’ve seen valves that failed their bench test purely because a previous lift event had bent the outlet flange slightly. Check pipe hangers every time the valve comes off.
Pressure and Temperature Transmitter Calibration
Drum pressure transmitters drive feedwater control loops and safety trip logic simultaneously. Drift in these instruments — and they do drift, especially in high-vibration environments near induced draft fans — causes two distinct problems: feedwater flow miscalculation that affects drum level stability, and nuisance trips or, worse, a trip threshold that’s quietly shifted above where it should be.
Loop calibration check every 6 months using a certified reference instrument (a calibrated deadweight tester for pressure, a precision RTD simulator for temperature) is the standard most insurance inspectors expect to see documented. Acceptable drift tolerance is ±0.25% of full scale. Anything beyond that, recalibrate or replace the transmitter before the next shift starts.
Water Level Instruments: The Single-Point Failure Risk
A single failed or unchecked water level instrument is the leading cause of low-water boiler damage events in industrial WHRB operation.True
Low-water conditions resulting from level instrument failure or miscalibration are consistently cited in boiler incident reports across ASME, HSE, and TÜV databases as the primary cause of tube overheating and catastrophic drum failure.
Cross-check magnetic float gauges, differential pressure level transmitters, and direct gauge glass readings against each other at least monthly. These three systems use different physical principles, so if two agree and one doesn’t, you know which one to distrust. Don’t average them — investigate the outlier. A misreading of even 50 mm at low-load conditions can put you dangerously close to uncovering the generating tubes.
Flue Gas Analyzer Calibration
O₂, CO, SO₂, and NOx analyzers require zero and span calibration against certified reference gas quarterly. On WHRBs in cement or steel applications where dust loading is high, the sampling probe and conditioning system need cleaning at least as often — a plugged filter on the sample line causes the analyzer to read artificially low O₂, which drives the combustion controller toward a richer mixture and elevated CO. Your emissions report looks fine; your actual stack conditions are not.
Control System Function Testing
Once a year, simulate every critical trip scenario on the DCS or PLC: high drum pressure, low water level, high flue gas temperature, and feedwater pump failure. Critically, verify that the hardwired interlock chains — the relay logic that operates independently of software — actually function without the control layer active. Software bugs, firmware updates, and configuration changes can silently disable a software trip while leaving the hardwired backup intact, or vice versa. You need to know which layer caught it and why.
Log every calibration result, every trip test, and every as-found/as-left value in a traceable instrument maintenance record. ASME CSD-1, EN 12952-11, and most national jurisdictions require this documentation for pressure vessel certification renewal. An undocumented calibration, in the eyes of an insurance inspector, is a calibration that didn’t happen.
Managing WHRB Startup, Shutdown, and Standby Conditions to Prevent Accelerated Degradation
Steady-state operation is actually the easy part. The damage that shortens a waste heat recovery boiler’s life disproportionately accumulates during startups, shutdowns, and layup periods — phases that often get the least engineering attention, especially at plants where the WHRB is treated as an auxiliary system rather than a primary pressure vessel.
Cold Startup: Why Heating Rate Discipline Matters More Here Than on Conventional Boilers
The standard guidance — limit drum and header heating rates to 50–80°C per hour — exists for all fire-tube and water-tube boilers, but it is genuinely more critical for WHRBs. Here is why: many WHRBs use large-diameter drums (1,200–1,800 mm range is common in cement and steel plant installations) to accommodate the relatively low-pressure, high-volume steam conditions typical of waste heat applications. A thick-wall large-diameter drum develops a steeper through-wall temperature gradient during rapid heating than a smaller drum would. That gradient drives differential thermal expansion between the drum shell and the tube-to-drum ligaments — exactly where fatigue cracking initiates.
The inlet header situation is similar. When hot flue gas hits a cold convection bank, the tubes nearest the inlet heat much faster than the header itself. Push the ramp rate past about 80°C/hour and you are loading those tube-to-header welds in bending, repeatedly, every startup cycle. On a high-pressure WHRB above 10 MPa, fatigue cycle counting against the design life limit is not optional — it should be logged every single startup, with peak ramp rates recorded. A plant running two process cycles per day on a cement line, for example, can accumulate hundreds of thermal cycles per year. That adds up faster than most maintenance planners expect.
In practice, controlling startup rate on a WHRB means throttling the process gas bypass damper carefully during the initial heat-soak phase, not just opening it up and waiting for the drum pressure to rise.
Wet Layup Versus Dry Layup: Getting the Threshold Right
For outages under about 30 days, wet layup is the right call. Fill the drum completely with deaerated, chemically treated water — pH held at 10.5–11.0, oxygen scavenger dosed to maintain residual — and keep it there under slight positive pressure with a nitrogen blanket on the steam drum. The chemistry keeps the internal surfaces passive. It is straightforward and cheap to maintain.
Beyond 30 days, wet layup becomes a liability. Any chemistry drift, a small leak past a drain valve, or inadequate deaeration during initial fill will leave oxygenated water sitting against tube walls and drum internals for weeks. Oxygen pitting under those conditions can reach measurable depth within a single extended outage. Dry layup with a nitrogen blanket plus desiccant trays in the drum and headers is required. Target less than 40% relative humidity inside the pressure parts. Check the desiccant at roughly two-week intervals — silica gel trays in a large drum can saturate faster than expected in humid climates.
Dry layup with nitrogen blanketing effectively prevents oxygen pitting in WHRB internals during outages exceeding 30 daysTrue
Nitrogen blanketing eliminates oxygen contact with wetted metal surfaces, and maintaining less than 40% RH with desiccant suppresses electrochemical corrosion mechanisms that require a liquid water film. Both ASME and European EN 12952 guidance support this approach for extended shutdown preservation.
Oxygen Scavenger Pre-Dosing Before Startup
This step gets skipped more often than it should. When the feedwater system is filled or topped up ahead of startup, dissolved oxygen enters the drum and tubes. Without a scavenger already active in the water, that oxygen contacts bare metal surfaces during the fill-and-heat phase — a period when the boiler is not yet generating steam to carry it off.
The corrective is straightforward: inject an elevated dose of sodium sulfite (for lower-pressure systems, typically below 6 MPa) or DEHA at 30–60 minutes before the feedwater pump is commissioned. “Elevated” means roughly 2–3× the normal continuous dosing rate, depending on your system volume and fill water oxygen content. Skip this a few times and you will find pitting starting inside the economizer tubes — usually in the lowest-flow sections where the water sits longest.
Shutdown Cooling, Venting, and Post-Upset Response
On shutdown, vent steam slowly through the air vent while the system cools. It sounds almost too basic to mention, but failing to maintain a positive pressure inside the drum during cooldown can cause vacuum formation in thin-wall economizer tubes, particularly in natural circulation WHRBs where the drum drains by gravity as the system cools. A collapsed economizer tube is an expensive lesson.
After any process upset that drove flue gas temperatures more than 50°C above the design maximum inlet temperature — a kiln upset in cement, a furnace breakthrough in steel, a combustion excursion in a waste incinerator — do not return the WHRB to service without a targeted UT thickness inspection of the first two tube rows in the convection bank and the inlet header. Those components absorbed the thermal shock directly. In my experience, plants that skip this step discover the damage three or four months later when a tube fails mid-shift, at which point the repair cost and lost production are multiples of what a day of UT work would have cost.
Log every startup and shutdown. Record the actual peak ramp rates, not just the target. On high-pressure units, that log is not busywork — it is your evidence when an insurer or regulatory body asks about fatigue life management, and it is the data your engineering team needs to make an informed decision about when to schedule an early internal inspection.
Spare Parts Strategy, Vendor Support, and When to Schedule Major Overhauls
Procurement managers often treat spare parts for a waste heat recovery boiler as an afterthought — something to sort out after the first failure. That approach reliably produces the worst possible outcome: a multi-week outage waiting on OEM lead times while the upstream process either idles or vents heat to atmosphere. Getting the inventory right before you need it is where the real cost savings live.
Critical On-Site Inventory: What You Cannot Afford to Wait For
A complete set of safety valve internals for every valve size installed on the unit is non-negotiable. Safety valves are wear items. The seats and discs erode, especially in units handling dirty or wet steam, and a valve that fails bench test during an insurance inspection will ground your boiler until it’s repaired. Carrying the internals on-site means you repair, re-test, and re-install within a day rather than waiting six to twelve weeks for an OEM shipment.
Feedwater pump mechanical seal kits sit in the same category. A seal failure on your only running feedwater pump is an emergency shutdown event. Seal kits are compact, relatively inexpensive, and have a shelf life measured in years when stored dry — there is no rational argument for not having two or three sets per pump model on the shelf.
For tube bundles, the rule of thumb most experienced boiler engineers use is a minimum of 20 replacement tubes per bundle in the highest-erosion row — typically the first convection pass row facing the raw flue gas inlet. In cement clinker cooler WHRBs or steel EAF exhaust applications, I’ve seen that row lose measurable wall thickness within 18 to 24 months. The tube material spec matters here: if your OEM used SA-210 Gr. A1 for that row, stock SA-210 Gr. A1, not a generic carbon steel substitute, because welding procedure qualifications are tied to base metal specification.
Drum level and pressure transmitters deserve a dedicated shelf position. These are the instruments that your DCS trusts for every critical interlock. Keep at least one spare transmitter for each critical measurement point, and verify the model and range before you order — a transmitter with the wrong pressure range or output signal will cause more problems than no spare at all.
Chemical dosing pump diaphragms and check valves are consumables, but they fail at the worst times — usually when water chemistry is already stressed. Stock a full repair kit per pump, and rotate them on a calendar basis rather than waiting for visible failure.
Consumable Spares and Defined Shelf Life
Refractory castable and ceramic fiber blanket materials have a practical shelf life of roughly two to three years in sealed, dry storage. Beyond that, castable can pre-hydrate and lose strength; ceramic fiber can absorb moisture and compress permanently. Date your stock and rotate it.
Expansion joint bellows elements need physical inspection at five years regardless of how good they look visually. Fatigue cracking in the convolutions often initiates internally and is invisible until the bellow fails during a thermal transient. The cost of replacing a bellows on a planned basis is a fraction of the emergency repair cost after a hot gas bypass.
Soot blower nozzle assemblies should be replaced when bore erosion reaches roughly 15% diameter increase over nominal. Past that threshold, blowing coverage drops and steam consumption increases — you’re spending more and cleaning less.
Major Overhaul Planning: Timing, Scope, and Budget
Plan a major overhaul every five to seven years, depending on flue gas dust loading and operating hours per year. A unit running 8,000 hours per year in a high-dust cement application will reach its overhaul threshold faster than one running 4,000 hours in a relatively clean gas turbine exhaust application.
A properly scoped major overhaul includes: full tube bundle ultrasonic thickness survey (every tube, every row — not sampling), refractory relining of the gas inlet section and any hopper transition zones that see direct impingement, drum internal replacement of worn baffles and steam-water separators, bench testing of all safety valves, and control system firmware updates with re-validation of all critical interlocks.
Budget 4–8% of original WHRB capital cost per overhaul. Where you fall in that range depends primarily on refractory scope and tube replacement volume found during the UT survey. If you’re consistently landing at the high end, look at whether the original design matched the actual flue gas conditions — sustained overhaul costs above 4% of capital per year, on a routine annual basis, usually indicate either deferred maintenance compounding or a design mismatch with the process source.
Well-maintained WHRBs typically incur routine maintenance costs of 1.5–2.5% of original capital cost per yearTrue
This range is consistent with industry benchmarks for industrial waste heat recovery boilers operating within their design envelope, with proper water treatment and scheduled inspection programs. Units exceeding 4% annually typically reflect deferred maintenance cycles or chronic flue gas condition mismatch.
OEM Versus Third-Party Service
During the warranty period, use OEM service for any pressure part repairs. Material traceability documentation — mill certificates, welding procedure qualifications, post-weld heat treatment records — is tied to the OEM’s quality system, and third-party work on pressure parts during warranty can void coverage outright.
After warranty expiry, qualified third-party boiler service contractors holding an ASME R-stamp (or the national equivalent in your jurisdiction) are entirely acceptable for tube replacement, refractory work, and instrumentation calibration. The R-stamp means the contractor operates under a documented quality program with authorized inspection oversight — that’s the threshold to require, not just a reference list.
Remote Plant Considerations
For plants operating in locations more than four to six hours from a major industrial supply hub, a digital spare parts catalogue is worth the administrative effort to build. It should include OEM part numbers, material specifications, dimensional drawings where available, and an approved alternative supplier list with lead time estimates. Local procurement staff can then source equivalent components without needing to escalate to the OEM for every item — which matters enormously when the OEM’s standard lead time runs eight to twenty-four weeks for non-stock items, as is common for pressure parts on customized WHRB configurations.
Frequently Asked Questions About Waste Heat Recovery Boiler Maintenance
How often should a WHRB be inspected internally?
Annual internal inspection is the baseline under ASME Section I, EN 12952, and most national equivalents. That means every drum, every accessible header, and a representative sample of tube bores — not just a visual walk-around of the casing. For high-dust applications like cement kiln off-gas or electric arc furnace flue gas, that annual cadence is often insufficient at critical erosion zones. In practice, plants handling flue gas with particulate loadings above roughly 20 g/Nm³ should add semi-annual tube wall thickness surveys using ultrasonic testing at known impingement points — typically the first two rows of the convection bank and any bend zones where gas velocity exceeds design intent. Hydrostatic pressure testing follows a slower rhythm: every 3–5 years at 1.25–1.5× MAWP, though insurers and local regulatory bodies sometimes push for the shorter end of that range after any tube leak event.
What causes most WHRB tube failures?
Two mechanisms account for roughly 60–80% of all tube failures between them. Scale buildup from inadequate feedwater treatment — calcium carbonate, silica deposits, magnetite layer disruption — reduces heat transfer and drives localized tube wall overheating, responsible for somewhere around 30–40% of failures depending on the water source quality. External erosion from high-velocity dust-laden flue gas accounts for a similar share, particularly where gas distribution across the tube bundle is uneven. Acid dewpoint corrosion is the third major contributor at roughly 15–20%, concentrated at the cold-end surfaces where flue gas drops below the acid dewpoint. The frustrating part is that all three are preventable. They show up on plants where chemistry logs aren’t kept consistently or where soot blowing was deferred because production pressure made it inconvenient.
Can soot blowing run while the WHRB is at full load?
Yes, for most modern installations. Retractable steam soot blowers and acoustic cleaners are both designed for online operation without load reduction or flue gas isolation. The acoustic systems in particular have no moving parts in the gas path, which makes them attractive for continuous duty. The exception is older fixed-lance or manual insertion systems — those typically need at least a partial load reduction, and in some configurations a brief gas bypass, to allow safe access. If your plant is still running manual lancing on a convection bank that sees more than 3–4 g/Nm³ particulate, it’s worth a capital conversation about automated systems. The cleaning frequency matters as much as the method: fouled fin tubes can see flue gas pressure drop increase 20–40% and heat transfer coefficient fall 15–30% within six months of neglected cleaning, and recovering from that state takes far more aggressive intervention than staying ahead of it.
What chemicals go into a WHRB feedwater treatment program?
The short answer: oxygen scavengers, scale inhibitors, and alkalinity builders — but the specific products depend heavily on operating pressure and local supply.
Parameter
Low-Pressure (4 MPa)
Oxygen scavenger
Sodium sulfite | Catalyzed DEHA or hydrazine alternative
Scale inhibitor
Phosphate or polymer blend | All-polymer or coordinated phosphate
Alkalinity control
Caustic soda (NaOH) | Amine-based (e.g., morpholine, cyclohexylamine)
Target drum pH
10.5–11.5 | 9.8–10.5 (volatile treatment at very high pressure)
Sodium sulfite works fine for lower-pressure drum-type WHRBs and is usually the cheapest option where it’s locally available, but it decomposes above roughly 4 MPa and generates sulfates that worsen TDS load. Dissolved oxygen should stay below 0.007 mg/L regardless of scavenger choice — that target is achievable with a properly operating deaerator before chemistry becomes the backstop.
Drum water dissolved oxygen below 0.007 mg/L is achievable with a well-operated thermal deaerator even before chemical oxygen scavengers are added.True
A correctly sized and vented deaerator operating at full load typically reduces dissolved oxygen to 0.005–0.02 mg/L mechanically; chemical scavengers then provide the residual reduction to the target level. Both elements are necessary for reliable pitting corrosion prevention.
How do I know if we need a major overhaul or just routine work?
A few clear thresholds signal that routine maintenance has crossed into overhaul territory. Heat output down more than 5% at constant flue gas inlet conditions, with water chemistry confirmed clean, usually means gas-side fouling or tube degradation is beyond what blowing and chemical treatment can recover. Flue gas pressure drop 25% or more above the clean design value points the same direction. Tube UT readings below 80% of original nominal wall thickness at any measured point trigger mandatory replacement under most pressure vessel codes — not a judgment call. Two or more unplanned tube leak events within 12 months is the operational version of that same signal. Any one of these alone warrants a serious engineering review. Two or more together and you’re scheduling an outage, not debating it.
What flue gas exit temperature prevents acid dewpoint corrosion?
It depends on SO₃ concentration, which varies with fuel sulfur content and excess air. For typical sulfur-bearing process gases with 5–20 ppm SO₃, keeping the flue gas exit temperature at least 20–30°C above the calculated acid dewpoint — usually somewhere in the 130–160°C range — provides adequate margin. Above 30 ppm SO₃ the dewpoint rises and that margin may need to expand further; get a corrosion specialist involved rather than extrapolating linearly. Plants burning waste-derived fuels with chlorine content add HCl dewpoint considerations on top of the sulfuric acid calculation, which is a different and nastier problem.
How is WHRB maintenance different from a conventional fired boiler?
The water side is broadly similar — chemistry targets, blowdown logic, and inspection intervals follow the same codes. The gas side is where the operational difference is stark. In a fired boiler, the operator controls fuel quality, combustion air, and burner load directly. In a WHRB, the flue gas is a byproduct of an upstream process — a rotary kiln, an EAF, a turbine exhaust — and its temperature, composition, and dust loading fluctuate with production decisions made by someone else in the plant. That dependency shapes everything: startup and shutdown thermal gradients are harder to manage because they’re tied to process availability rather than boiler demand, soot blowing schedules must respond to upstream process swings rather than a fixed calendar, and acid dewpoint risk changes with every shift in feedstock or fuel. Experienced WHRB operators learn to read upstream process data — kiln feed rate, furnace charge weight, gas turbine load — as leading indicators of what the boiler is about to see.
There is no standard number of boilers in a power plant.
Total plant capacity in MW does not, by itself, tell you how many boilers a plant has.
In a conventional steam power station built around individual generating units, each unit commonly has its own main boiler supplying steam to its steam turbine. A single-unit station may therefore have one main boiler, while a station made up of several generating units may contain several.
Industrial combined heat and power (CHP) plants, combined-cycle plants, and waste-to-energy facilities can use different steam-generation arrangements.
The key point is:
Plant MW ≠ Boiler Count
To understand the boiler count of a specific power plant, first look at how the station is divided into generating units or process lines and how steam is produced within them.
Power Station vs. Generating Unit: The Distinction That Matters
A power station is the entire facility. It may contain one generating unit or several units commissioned during different development stages.
A generating unit is an individual power-producing train within that station.
For a conventional steam power plant, the basic energy-conversion path can be simplified as:
Boiler → Steam Turbine → Generator
The boiler produces high-pressure, high-temperature steam, the turbine converts the steam’s thermal energy into mechanical energy, and the generator converts that mechanical energy into electricity. This basic arrangement is reflected in Mitsubishi Power’s conventional steam power plant systems.
This distinction explains why a 1,000 MW power station could theoretically consist of:
1 × 1,000 MW generating unit
2 × 500 MW generating units
4 × 250 MW generating units
All three arrangements total 1,000 MW, but their equipment configurations can be very different.
Therefore, instead of asking only:
“How many boilers does a 1,000 MW plant have?”
it is more useful to ask:
“How many generating units make up the station, and how is steam generated for those units?”
A Large Generating Unit Does Not Automatically Mean Multiple Boilers
A common misconception is that high electrical output must be divided among several smaller boilers.
Kozienice Unit 11 in Poland provides a useful counterexample. The 1,075 MW coal-fired generating unit was supplied with core equipment including a coal-fired boiler, steam turbine, and generator.
The example shows that:
A generating unit exceeding 1,000 MW does not automatically require several smaller main boilers simply because of its electrical output.
This is why a shortcut such as:
Plant MW ÷ assumed boiler MW = boiler count
is not a reliable way to infer actual power-station configuration.
Why Some Large Power Stations Have Many Boilers
Large stations can also be built around many individual generating units.
That gives the station 13 generating units, commissioned across multiple development stages.
Vindhyachal illustrates an important distinction: a large station may reach its total MW through the combined capacity of many separate generating units rather than through one very large unit.
A station expanded over several construction phases can therefore have more boiler-turbine trains than another station with a similar total capacity built around fewer, larger units.
How Different Power Plants Organize Steam Generation
Not every power plant follows the same steam-generation architecture.
Plant arrangement
What mainly drives equipment count
Key point
Conventional single-unit steam plant
Generating-unit arrangement
One generating unit may use one main boiler
Multi-unit steam power station
Number of generating units
One station can contain several boiler-turbine trains
Industrial CHP / captive power
Steam-system architecture
Multiple boilers may supply a shared power-and-process steam system
Combined-cycle power plant
Gas-turbine exhaust trains
Individual gas turbines commonly discharge through their associated HRSGs
Waste-to-energy plant
Number of combustion lines
Individual waste-processing lines may have their own boilers
These are common configuration patterns rather than universal design rules. Actual arrangements remain project-specific.
Industrial CHP: Multiple Boilers Can Serve One Steam Network
Industrial CHP plants often supply steam for process duties as well as electricity generation. Their steam systems may therefore include multiple boilers feeding a shared steam network rather than one dedicated boiler for each turbine.
For a Thai Beverage project, the boiler island includes:
2 × 30 TPH spent-grain-fired biomass boilers
1 × 9 MW backpressure steam turbine-generator system
This demonstrates why:
“One steam turbine always means one boiler”
is not a universal rule.
Industrial CHP systems can combine multiple steam sources within one power-and-process steam system. Detailed boiler capacity, redundancy, and steam-balance requirements, however, are separate engineering questions.
Combined-Cycle Plants: HRSG Count Follows the Gas-Turbine Arrangement
Combined-cycle power plants follow a different steam-generation logic.
Instead of producing all steam in a conventional directly fired utility boiler, an HRSG (heat recovery steam generator) recovers heat from gas-turbine exhaust and uses it to produce steam for the steam cycle. Mitsubishi Power’s HRSG overview describes this role within gas turbine combined-cycle systems.
For boiler-count purposes, the important point is that HRSGs are normally associated with gas-turbine exhaust trains.
A concrete example is the Sultan Ibrahim Power Plant in Malaysia. GE Vernova identifies the project as having two HRSGs installed behind two 9HA.02 gas turbines.
This directly supports the relevant configuration principle:
In a combined-cycle plant, HRSG count is commonly linked to the number and arrangement of gas-turbine exhaust trains—not simply to total station MW.
The overall steam-turbine arrangement is a separate part of the combined-cycle configuration and does not need to be inferred from HRSG count alone.
Waste-to-Energy Plants: Boiler Count Can Follow Combustion Lines
Waste-to-energy facilities introduce another equipment-count pattern.
Many WTE plants are divided into individual combustion lines, with each line incorporating its own combustion equipment and steam boiler.
According to MARTIN’s official project information, the modernization of the Prague-Malešice waste-to-energy plant covers four combustion lines and the replacement of four corresponding grate-and-boiler systems.
In this type of facility, total electrical MW alone would not reveal the boiler count. The number of waste-processing or combustion lines is more directly relevant.
Why Similar-Sized Power Plants Can Have Different Boiler Counts
Several factors explain why two power stations with similar output may have different numbers of boilers.
Generating-Unit Size
One station may use a few large generating units, while another uses more numerous smaller units.
Construction and Expansion History
Large stations are often developed in stages. New generating units may be installed years after the original plant enters service.
Vindhyachal is a clear example: its present capacity was built through multiple groups of generating units commissioned over successive development stages.
Steam-System Architecture
Utility generating units and industrial CHP systems may organize steam differently. Industrial facilities, in particular, can use shared steam networks serving both turbines and process users.
Power-Generation Technology
Conventional fired steam plants, combined-cycle plants, and waste-to-energy facilities produce steam through different equipment arrangements. Their boiler counts therefore cannot always be interpreted in the same way.
What Boiler Count Does Not Tell You
Knowing that a station has one, four, or ten boilers provides limited information by itself.
Boiler count does not tell you boiler size.
One large utility boiler can serve a high-capacity generating unit, while several smaller boilers may supply an industrial steam system.
Boiler count does not tell you plant output.
Electrical output depends on the generating-unit configuration and complete thermodynamic cycle.
Boiler count does not tell you efficiency.
Efficiency depends on steam conditions, fuel, technology, cycle design, heat recovery, and operating conditions—not simply the number of boilers.
Multiple boilers do not automatically mean standby capacity.
Four boilers could belong to four generating units, four process lines, or another plant arrangement. The actual operating philosophy must be verified from the project design.
Boilers within one station may not be identical.
Plants expanded over time or designed for different duties can contain units of different capacities or technologies.
Boiler count should therefore be treated as a configuration characteristic, not as a shortcut for judging plant capacity or performance.
How to Read “This Power Plant Has X Boilers” Correctly
When a project description, tender, or technical document gives a boiler count, check four pieces of context:
Does the quoted MW refer to the entire station or one generating unit?
How many generating units or process lines does the facility contain?
Are the steam generators conventional fired boilers, HRSGs, WTE boilers, or industrial CHP boilers?
Are the steam systems dedicated to individual units or integrated through a shared steam network?
With this information, a statement such as “the plant has four boilers” becomes a meaningful engineering description rather than an isolated number.
Boiler Count vs. Boiler Sizing
Boiler count and boiler sizing are related, but they answer different questions.
Boiler count describes how steam-generation equipment is distributed across generating units, process lines, or steam systems.
Boiler sizing determines how much steam each individual boiler must produce and at what pressure and temperature.
Once the overall plant configuration is defined, individual boiler capacities can be evaluated through steam-balance and unit-specific calculations.
If your actual question is how much steam each power plant boiler should produce, see:
There is no universal number. A single-unit conventional steam plant may have one main boiler, while a multi-unit station may contain several. CHP, combined-cycle, and waste-to-energy facilities can follow different arrangements.
Can a large power plant have only one main boiler?
Yes. Large electrical output does not automatically require multiple main boilers. Kozienice Unit 11 in Poland is a 1,075 MW generating unit whose core power-generation equipment includes a coal-fired boiler, steam turbine, and generator.
Does every steam turbine need its own boiler?
Not always. Dedicated utility generating units commonly use their own main boilers, but industrial CHP systems can use multiple boilers supplying a shared steam network. Combined-cycle plants follow a different arrangement using HRSGs associated with gas-turbine exhaust.
Can two 1,000 MW power stations have different numbers of boilers?
Yes. One station could consist of one large generating unit, while another could be divided into two or more units. Total station MW alone therefore cannot determine boiler count.
Are extra boilers always standby boilers?
No. Multiple boilers may represent multiple generating units, industrial steam sources, HRSG trains, or waste-combustion lines. The actual plant configuration must be checked before identifying any boiler as standby equipment.
Conclusion
There is no single answer to “How many boilers does a power plant have?”
The key distinction is between the power station as a whole and the individual generating units or process lines within it.
A large conventional generating unit may use one main boiler. A multi-unit station may contain many boiler-turbine trains. An industrial CHP system can use several boilers within one steam network. A combined-cycle plant may use multiple HRSGs associated with its gas-turbine exhaust trains, while a waste-to-energy facility may organize boilers around individual combustion lines.
That is why:
Total plant MW alone should not be used to infer boiler count.
For a specific station, the more useful follow-up question is:
How is the plant divided into generating units or process lines, and how is steam generated within them?
Once that configuration is understood, the required capacity of each individual boiler can be evaluated separately.
Planning a power or CHP project? Taishan Group’s engineering team can review your steam-generation requirements and help evaluate a suitable boiler solution for your application.

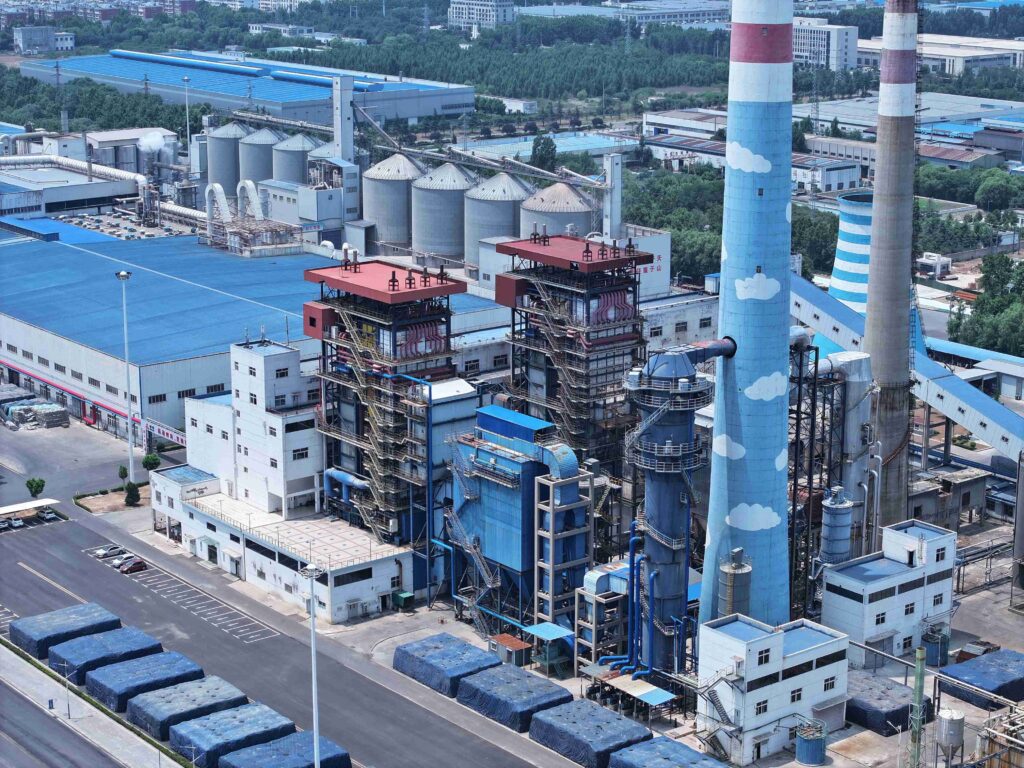
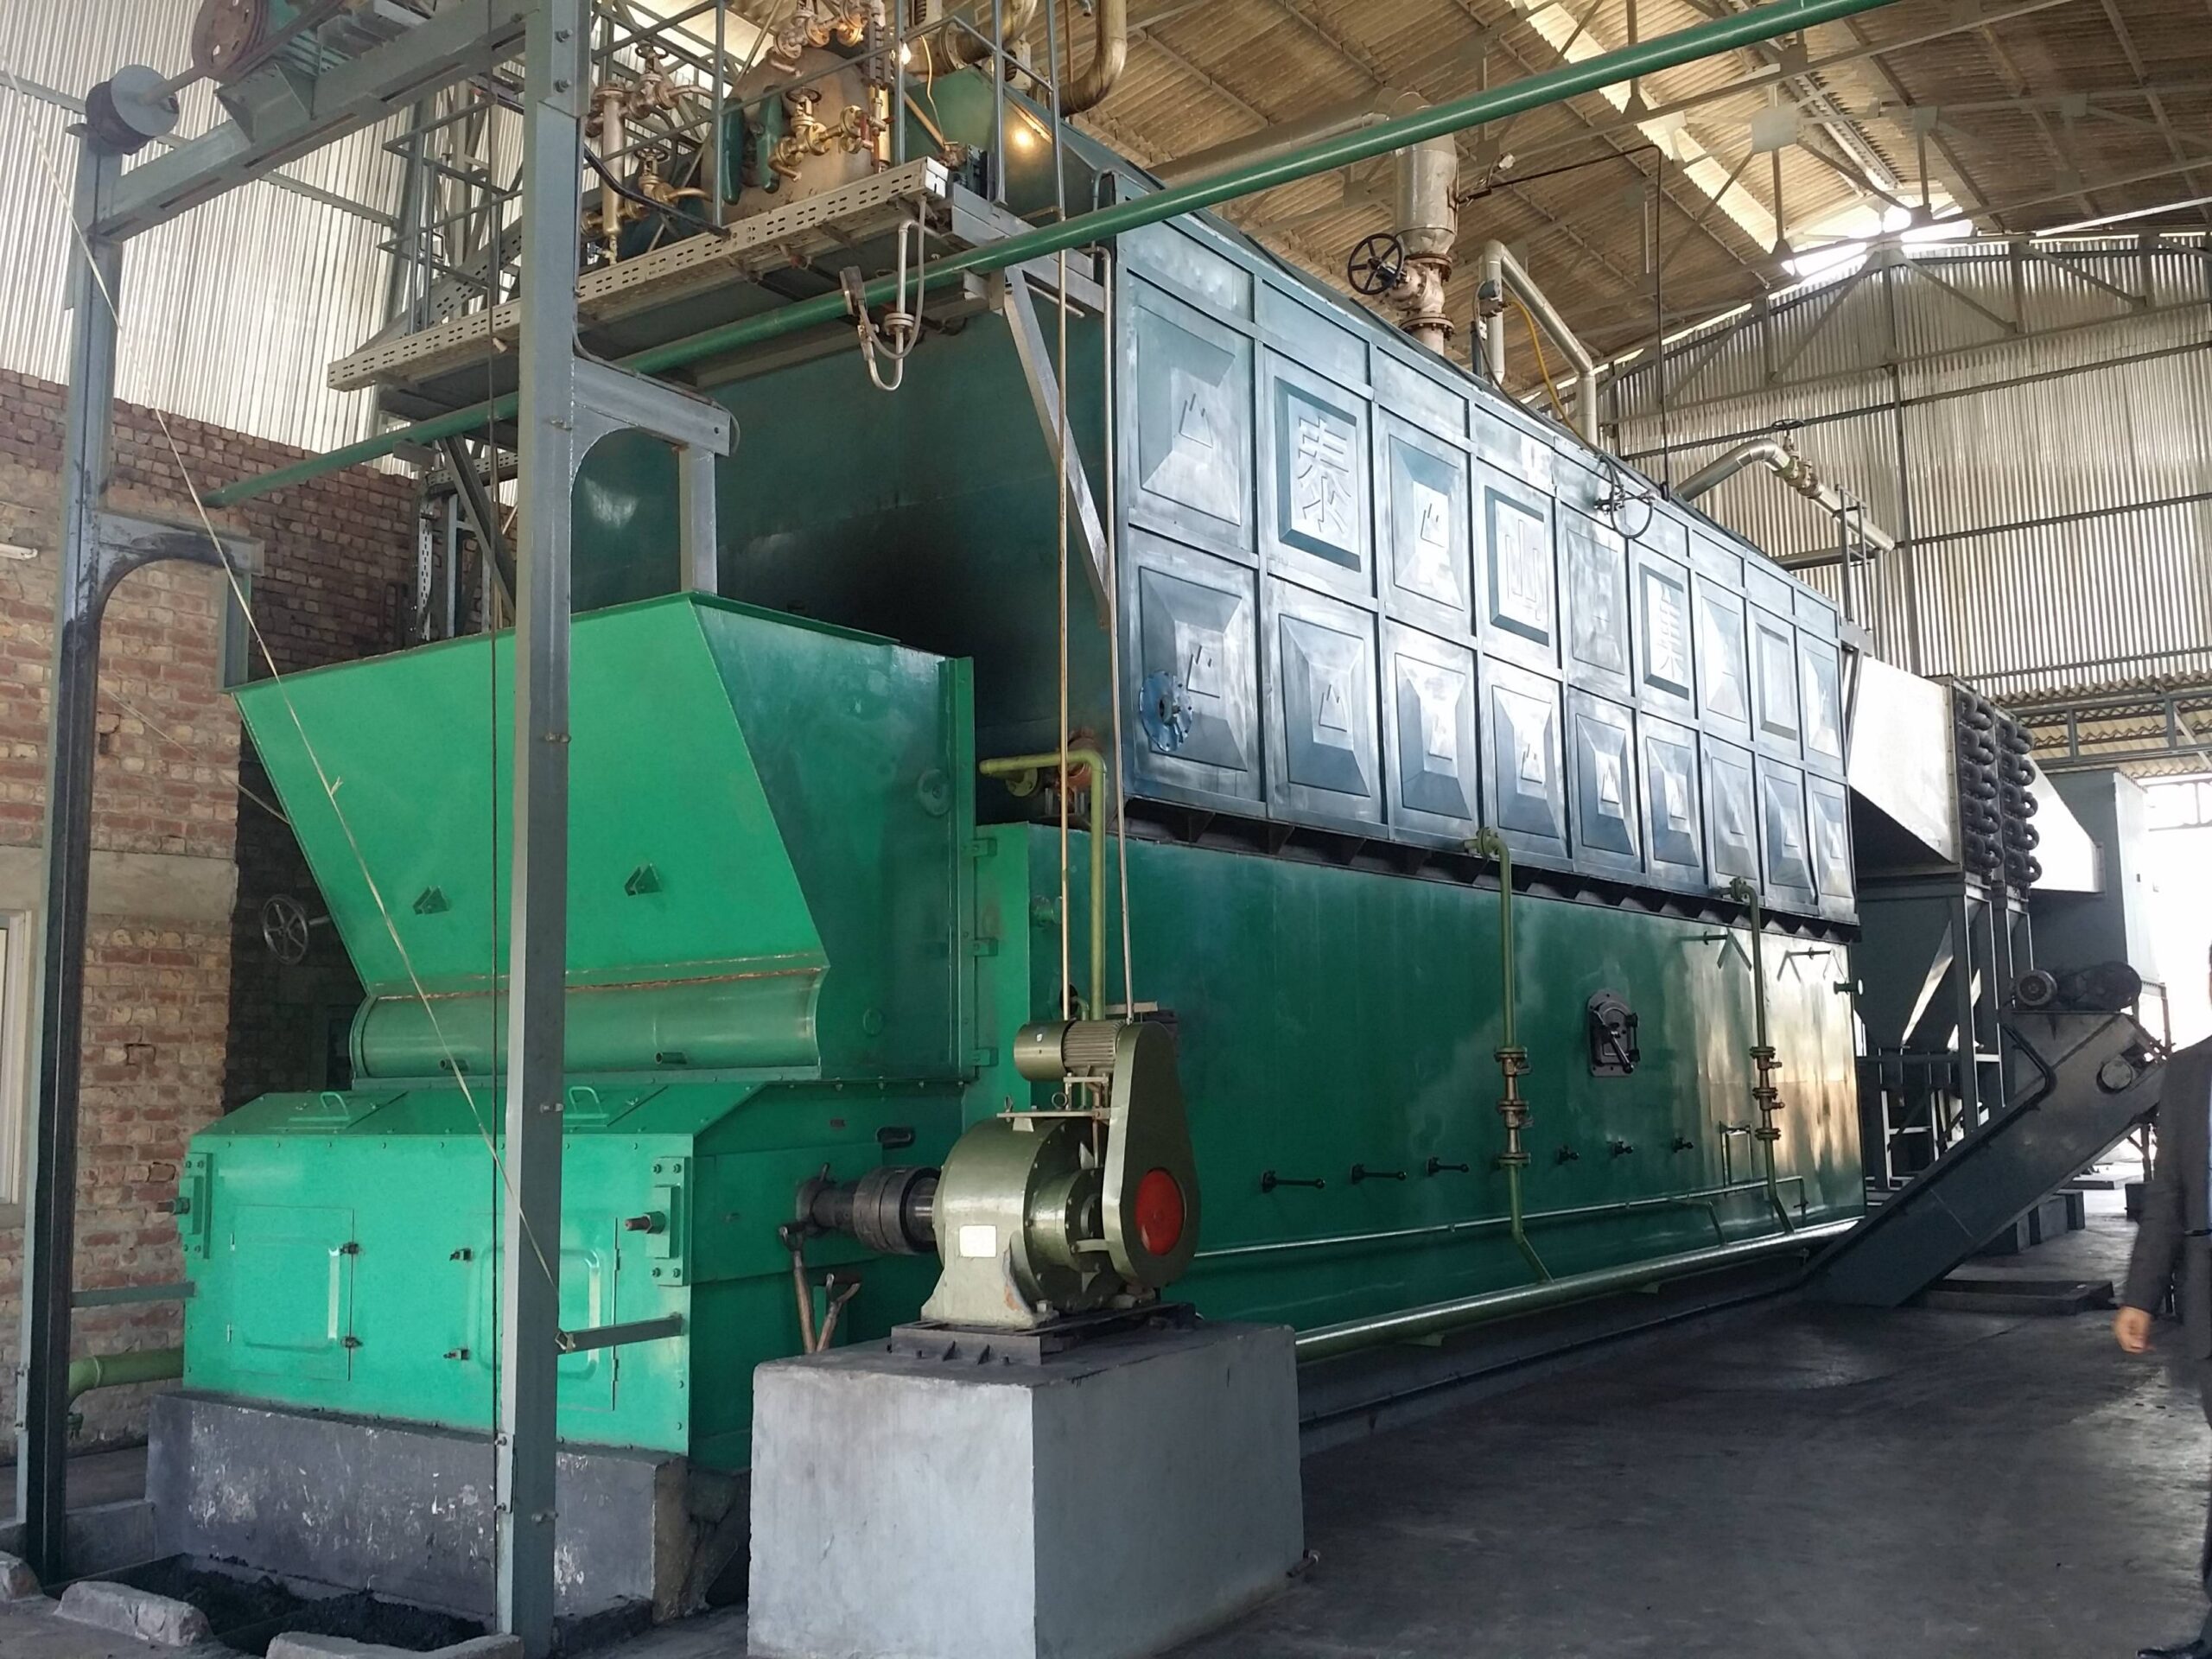
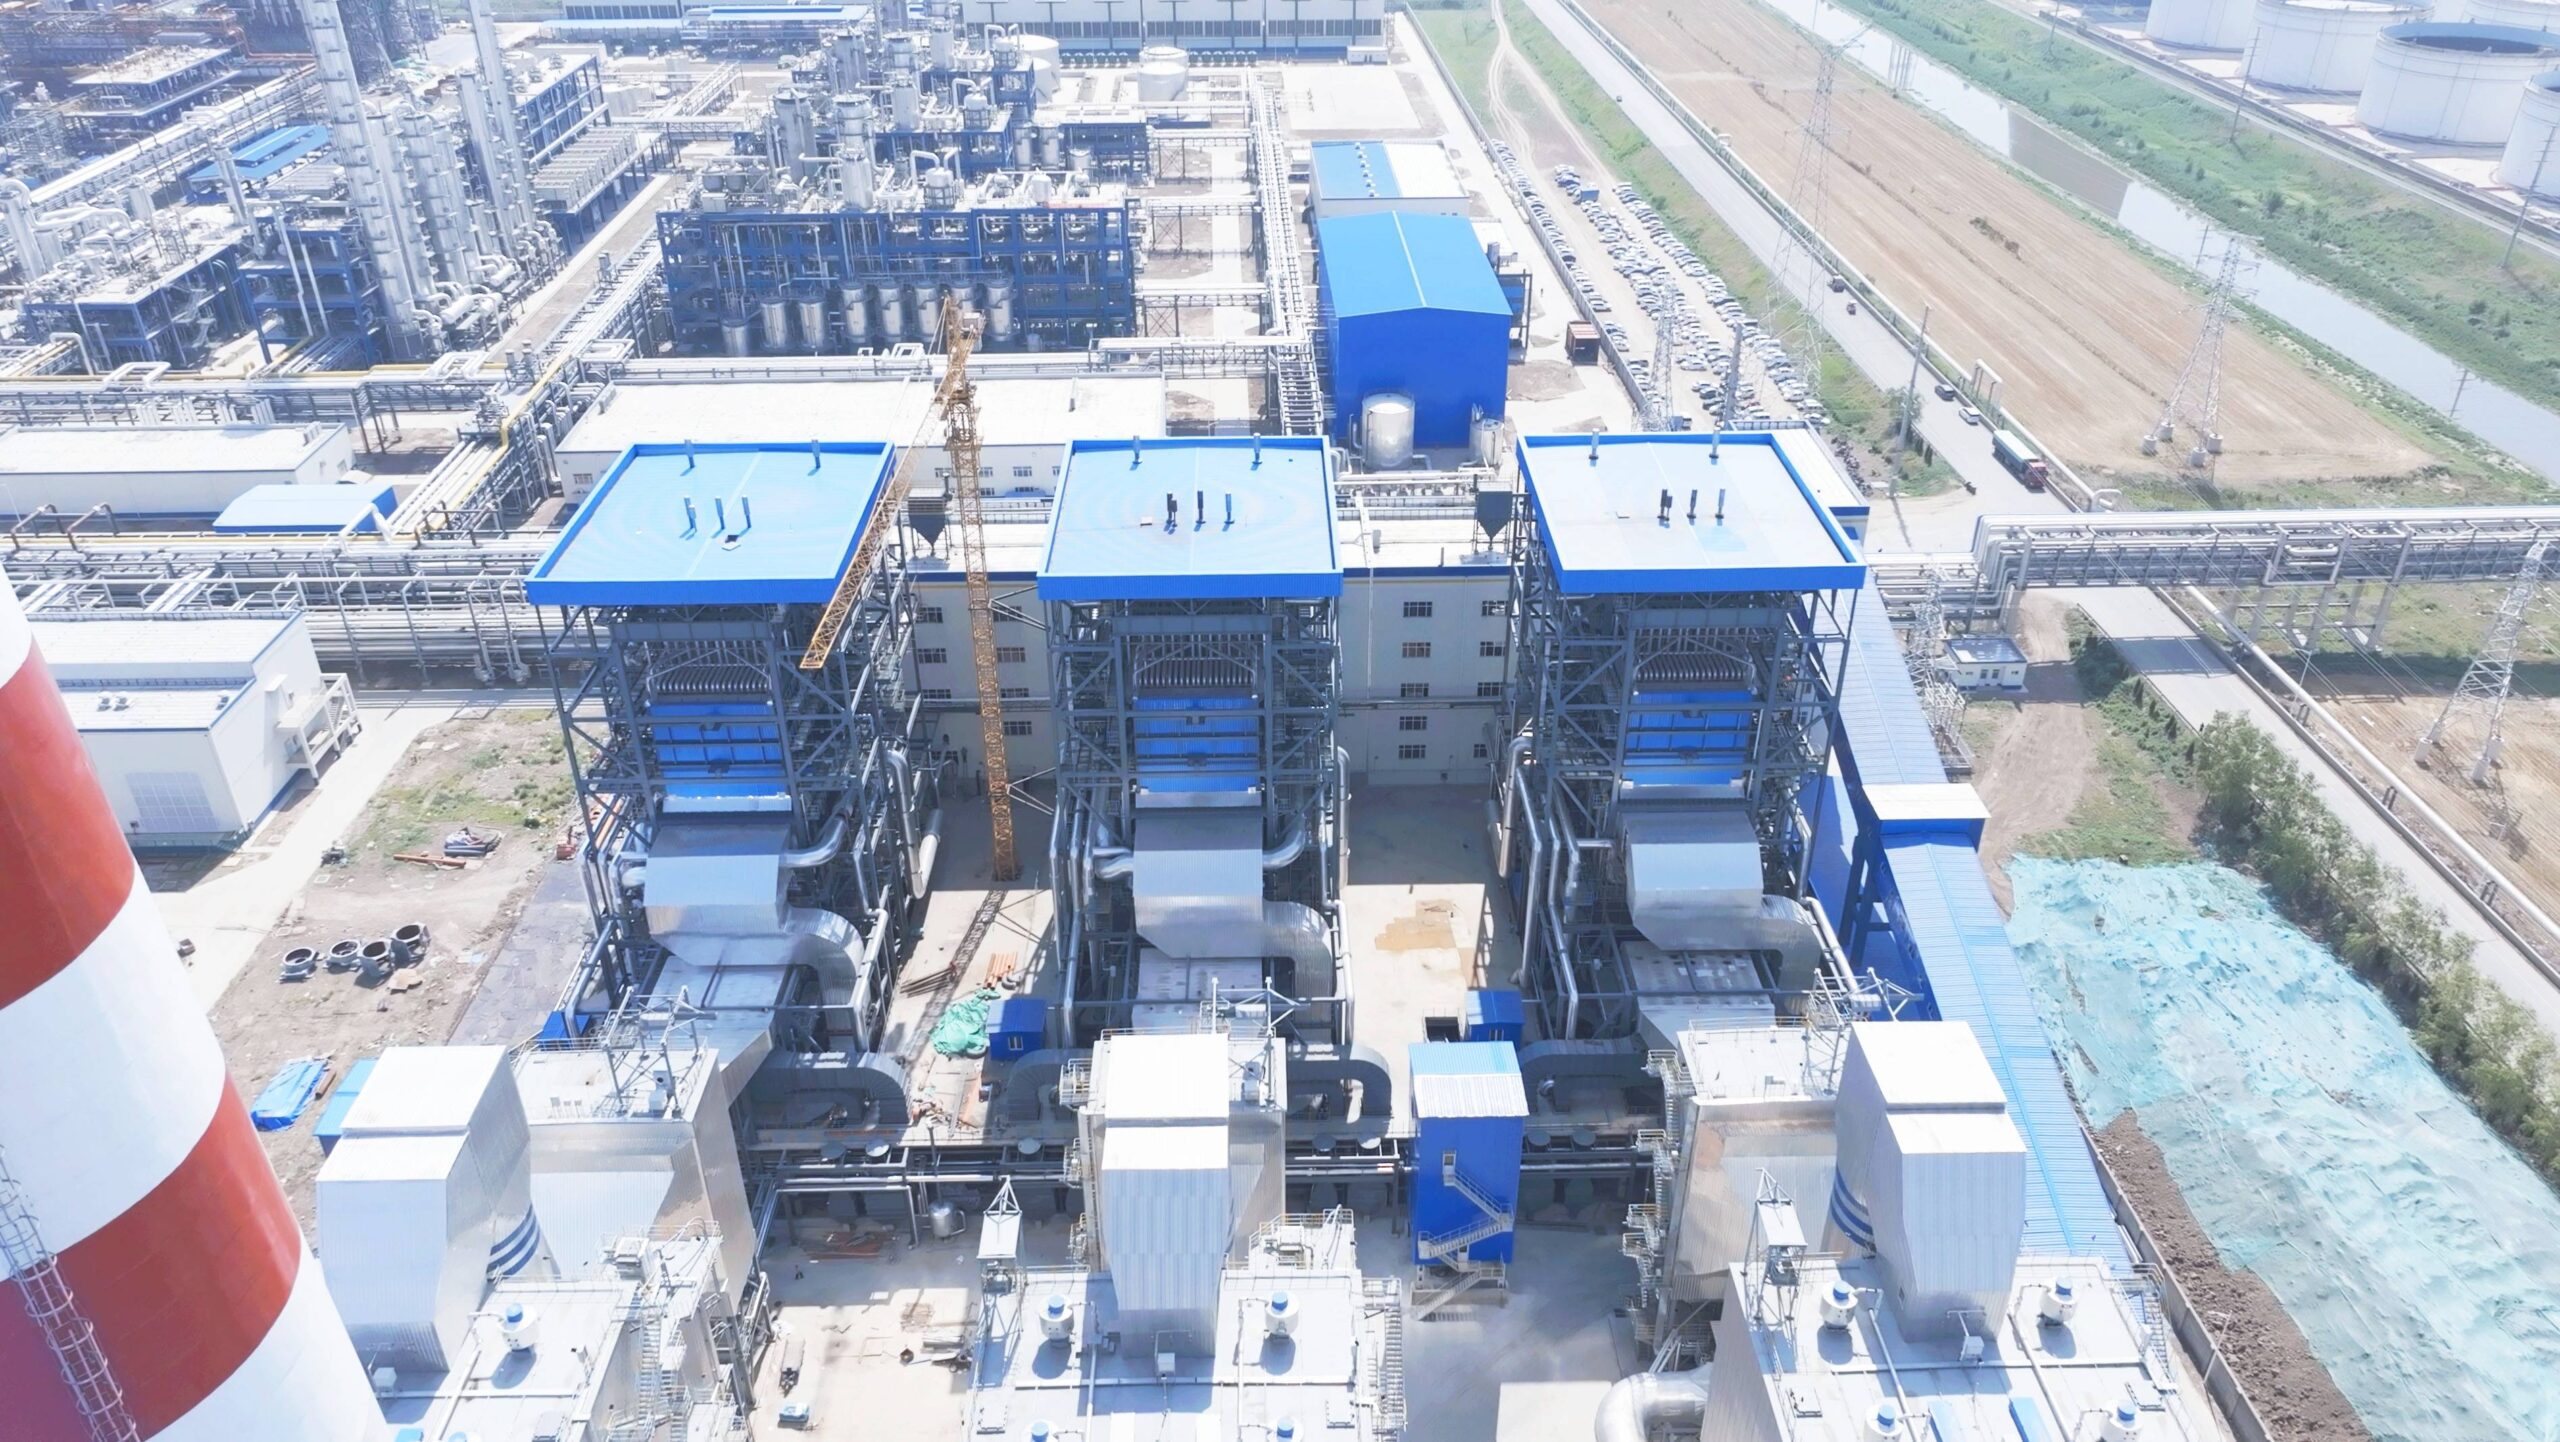
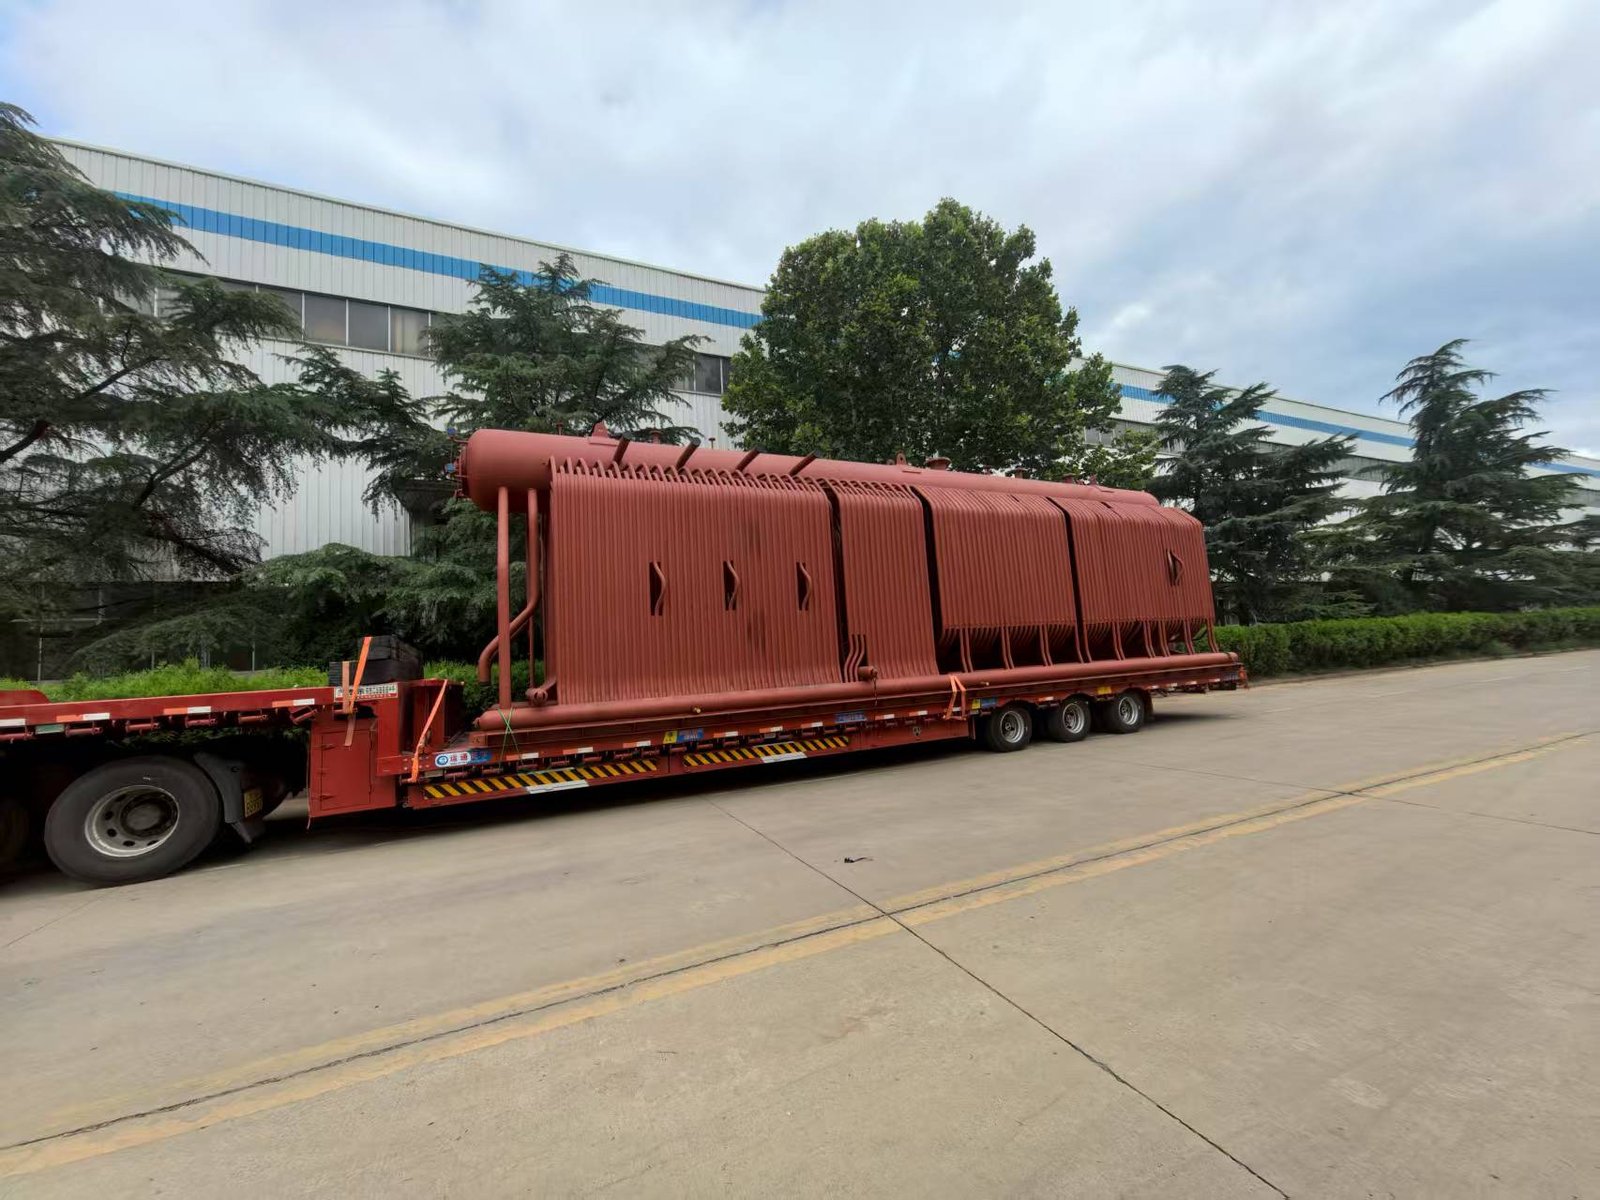
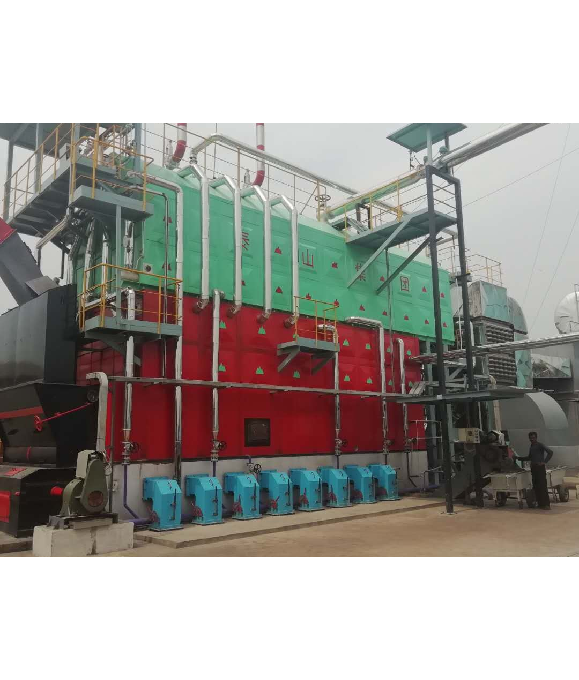 Coal-fired boiler SZL