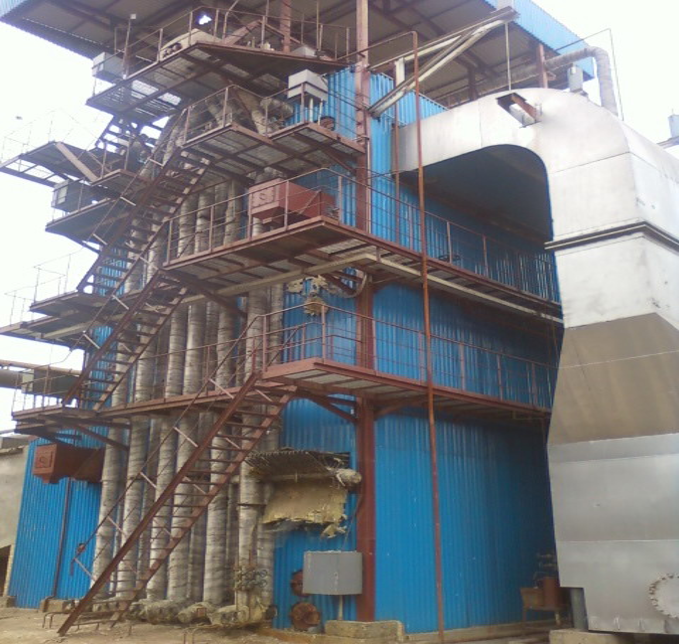
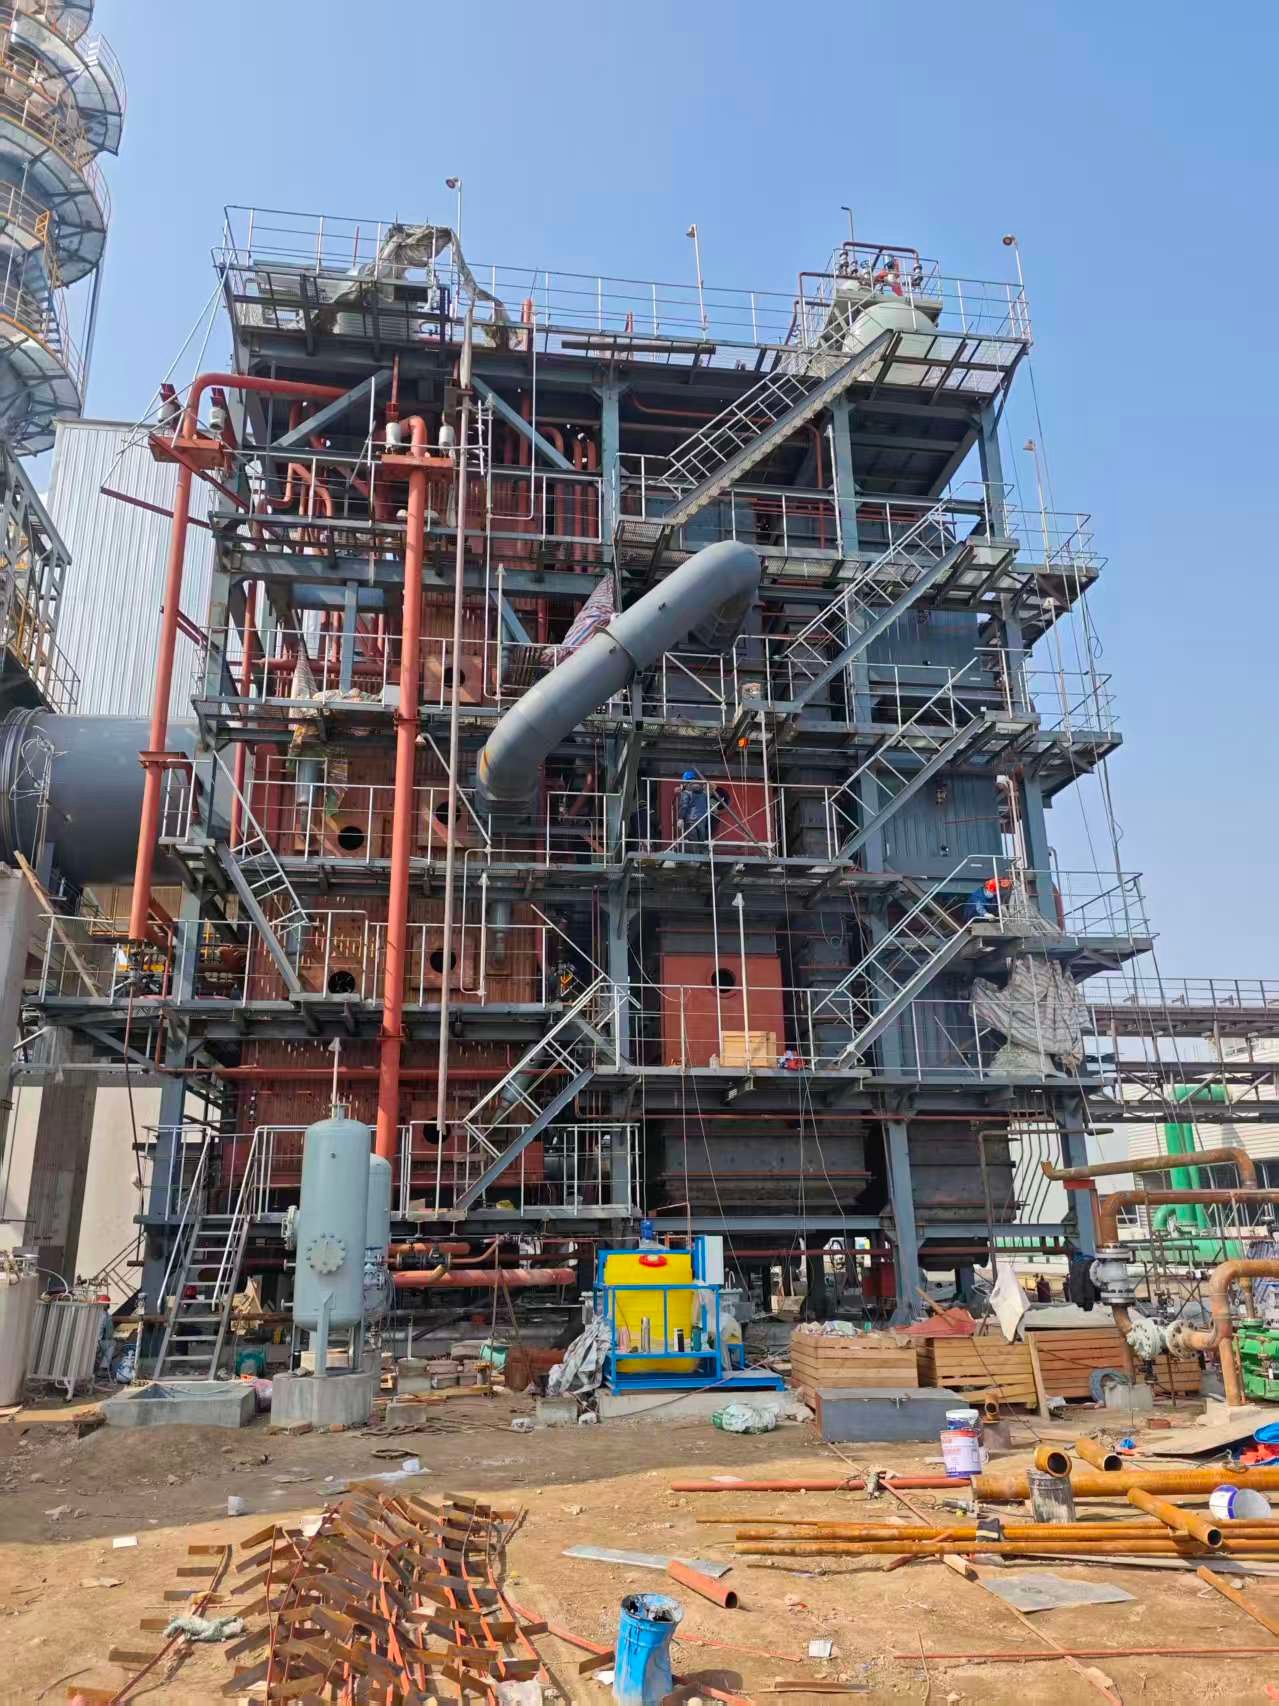
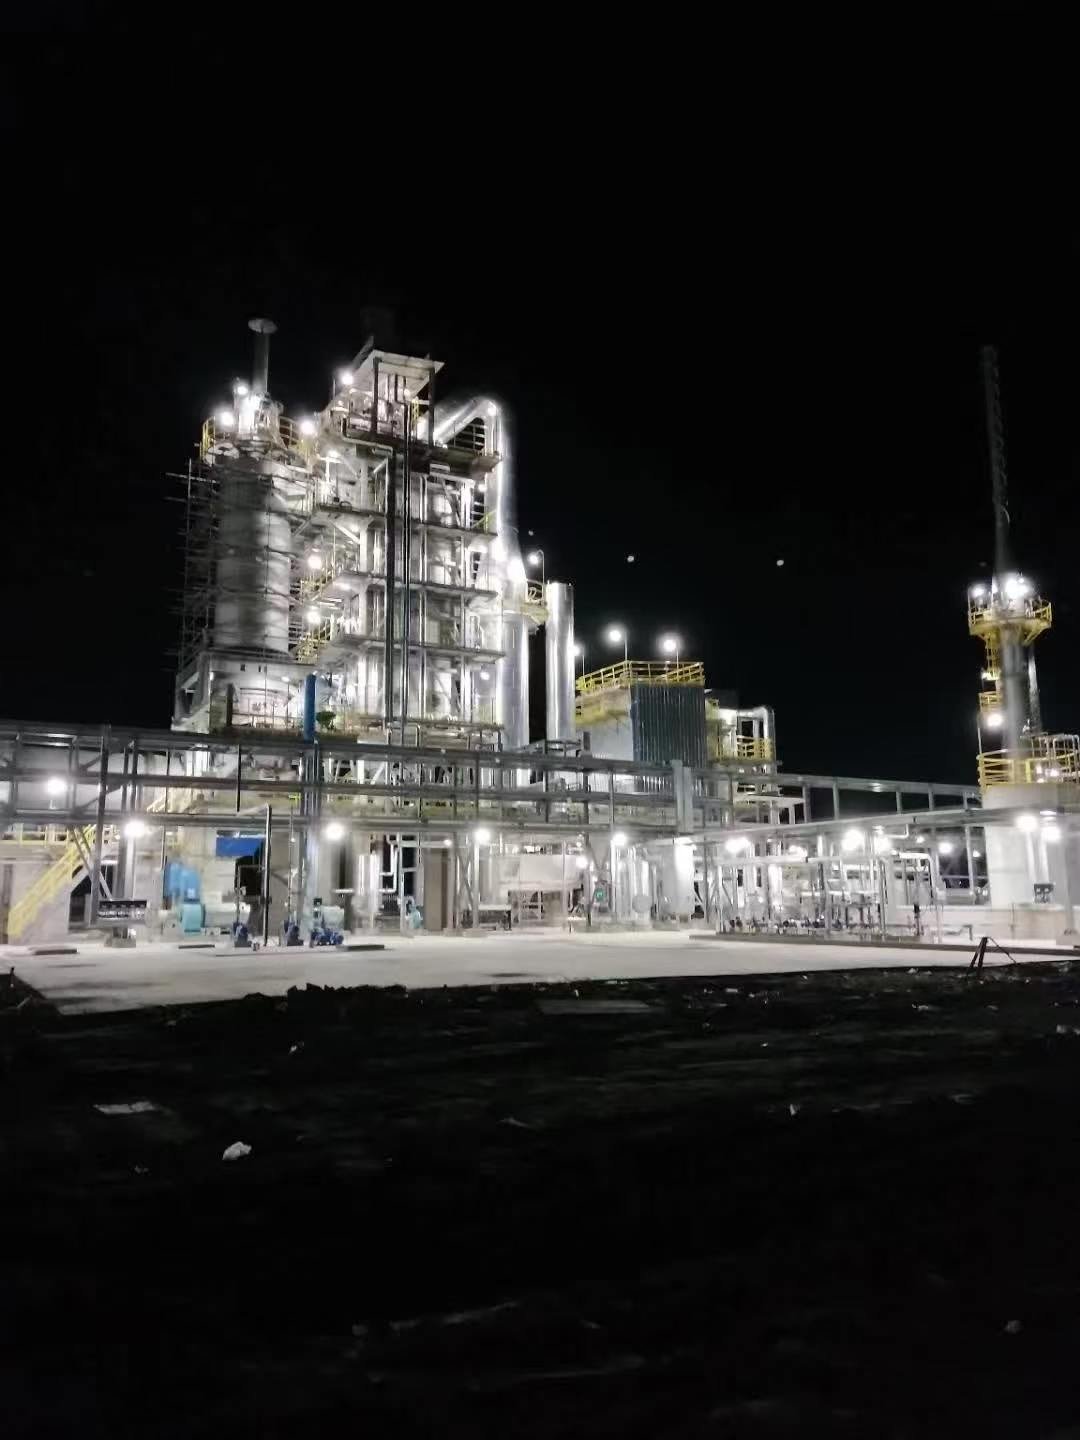
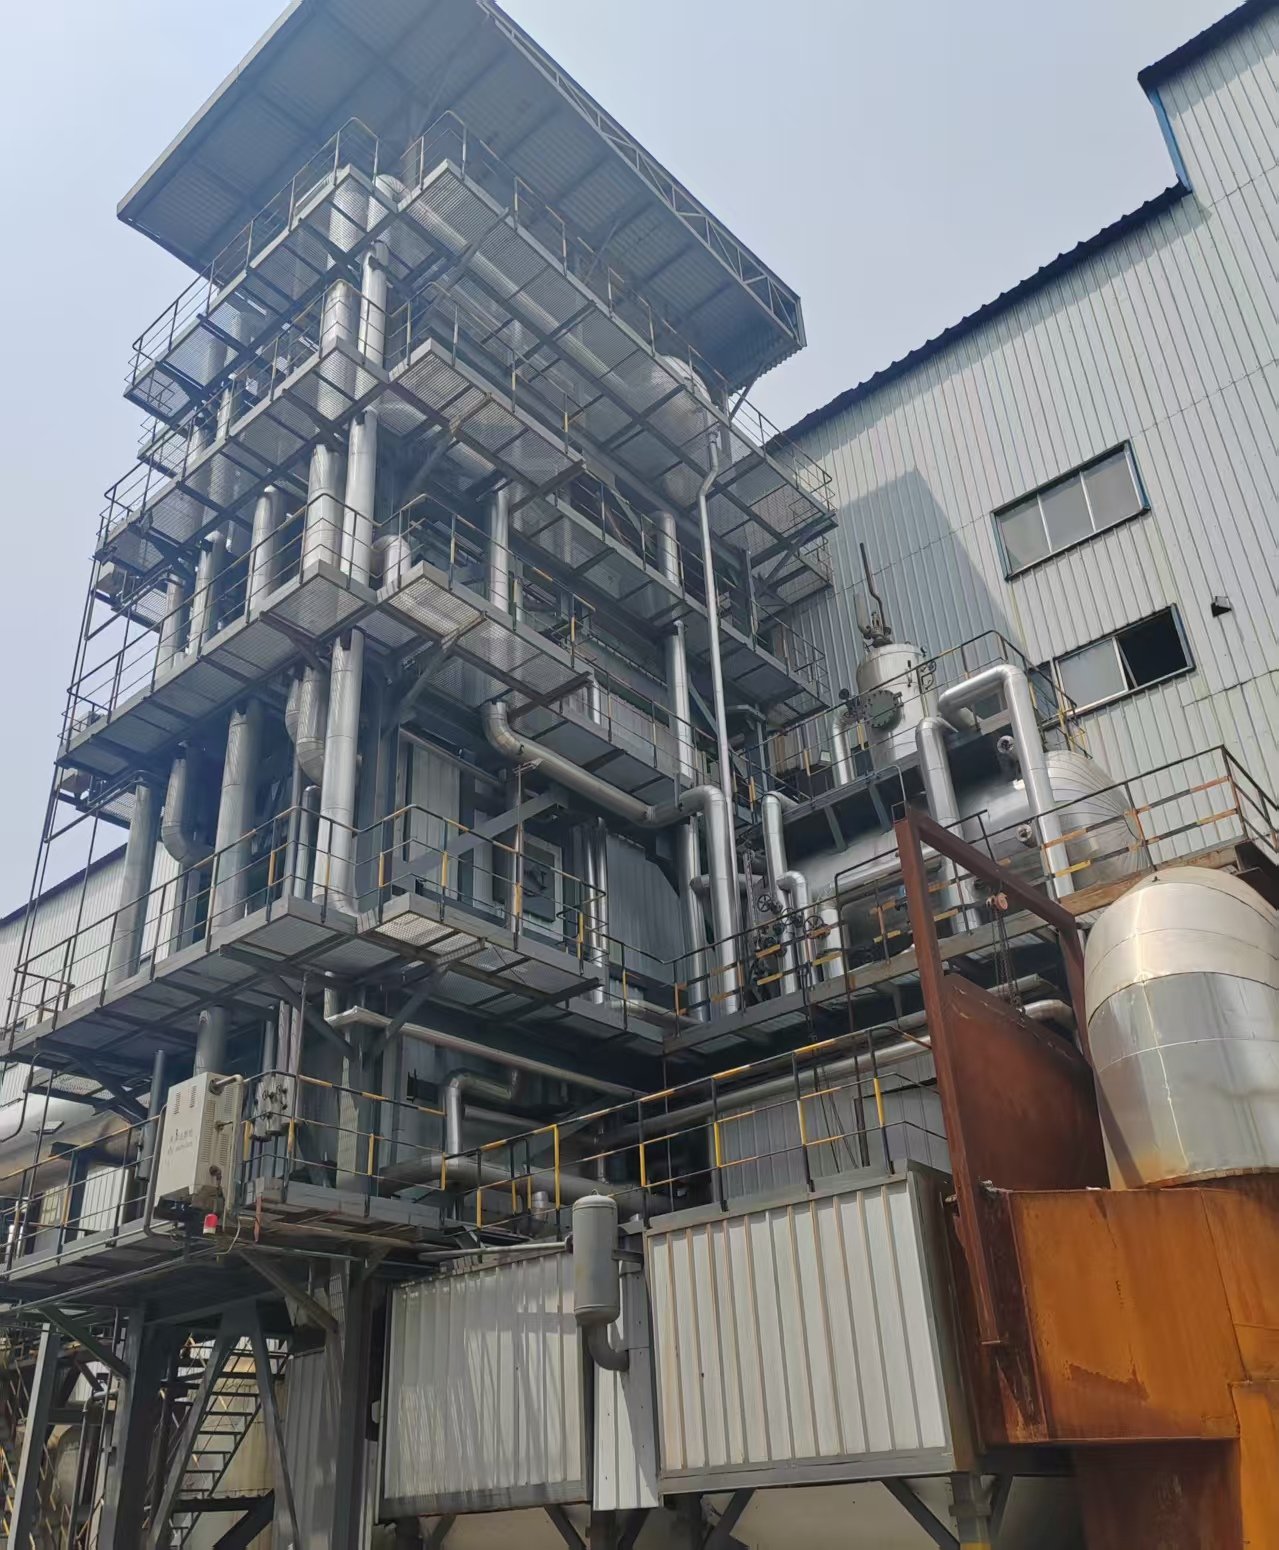
Industrial Boiler Guide: How They Work, Types & Key Specifications
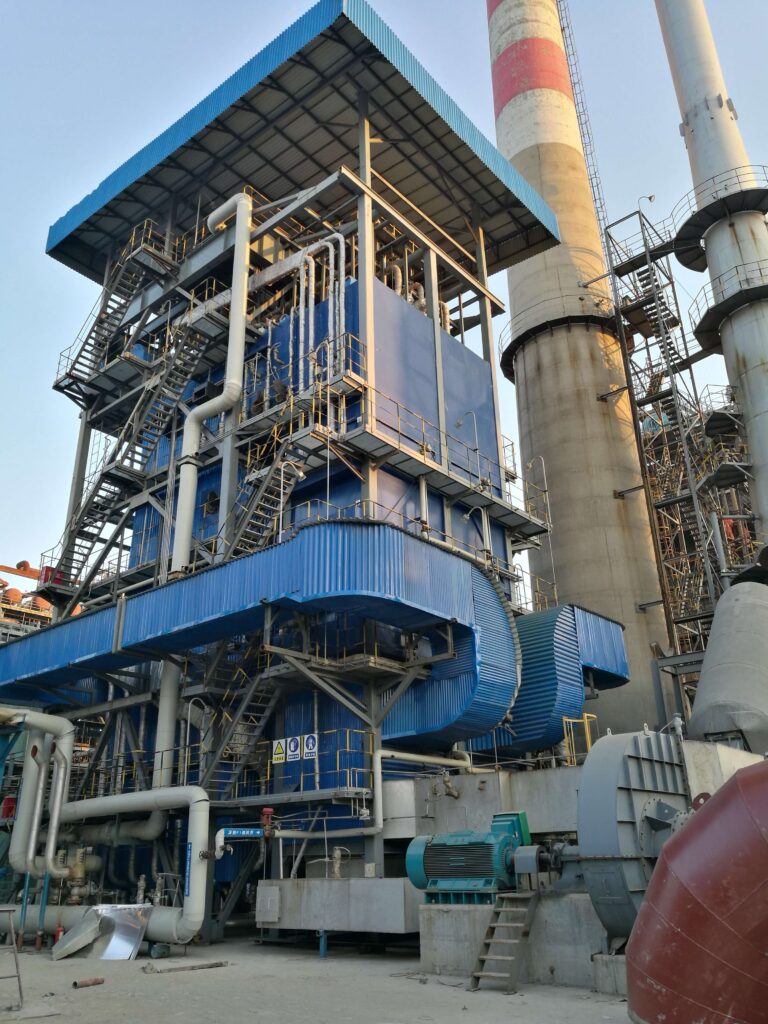
An industrial boiler is not a single equipment type. It is a broad category of thermal equipment used to produce steam or hot water for industrial processes, heating, combined heat and power (CHP), power generation, and other thermal duties.
This distinction matters because common boiler names often describe different aspects of the same system. A water-tube boiler describes the pressure-part arrangement. A biomass boiler identifies the heat source. A CFB boiler describes a combustion technology. A steam boiler describes the thermal output.
One boiler can therefore belong to several categories at the same time. For example, a boiler may be a biomass-fired, grate-fired, water-tube steam boiler.
Understanding industrial boilers through these overlapping dimensions is more useful than treating every boiler name as a separate and competing “type.”
This guide explains what industrial boilers are, how they work, the main ways they are classified, what they are used for, and which specifications ultimately define a real boiler project.
What Is an Industrial Boiler?
A Practical Engineering Definition
An industrial boiler is a thermal system that transfers energy from combustion, electricity, or recovered heat into water to produce steam or hot water for useful industrial service.
At its simplest, the energy path is:
Energy Source → Heat Transfer → Steam or Hot Water → Industrial Duty
Depending on the application, the boiler may produce:
- Saturated steam for process heating and general plant steam service;
- Superheated steam for applications requiring steam above saturation temperature, including many turbine and power-generation duties;
- Hot water for process heating, central heating, district heating, and industrial hot-water systems.
The U.S. Department of Energy’s Improving Steam System Performance: A Sourcebook for Industry treats the boiler as part of a wider steam system that includes generation, distribution, end-use equipment, and condensate recovery. It also distinguishes different boiler configurations rather than treating industrial boilers as one uniform design.
Several common assumptions should therefore be avoided.
Not every industrial boiler uses a conventional burner. Gas- and oil-fired boilers typically do, but solid fuels can be burned on grates, through stoker systems, or in fluidized beds. Electric boilers do not require fuel combustion, while waste-heat boilers may generate steam from hot exhaust or process gases.
Not every steam boiler uses a conventional steam drum either. Drum-type water-tube boilers use drums for circulation and steam-water separation, while once-through steam generators use a different flow arrangement. Babcock & Wilcox’s Steam: Its Generation and Use distinguishes conventional drum systems from once-through steam generation without a fixed steam-water separation point.
And not every industrial boiler produces steam. Hot-water boilers serve industrial and district-heating applications where circulating heated water is the required energy carrier.
Boiler Unit vs. Complete Boiler System
The term boiler can also describe different equipment boundaries.
At the narrowest level, the boiler pressure parts contain water or steam and absorb heat. Depending on the design, these may include tubes, headers, drums, shells, and other pressure-containing components.
A packaged boiler may integrate additional equipment such as:
- the firing or heating system;
- controls and instrumentation;
- fans;
- heat-recovery surfaces;
- selected auxiliary equipment.
A broader boiler island can extend further to include:
- fuel storage and handling;
- boiler feedwater equipment;
- water treatment and deaeration;
- flue-gas handling;
- emissions-control equipment;
- ash or residue handling;
- stack systems;
- electrical and control systems;
- other plant auxiliaries.
This distinction is commercially important.
Two suppliers can quote the same nominal boiler capacity while offering very different equipment scopes. A comparison based only on TPH or MW can therefore be misleading unless the supply boundary is also defined.
For a more detailed explanation of equipment boundaries, see What’s Included in an Industrial Boiler Package?.

How Does an Industrial Boiler Work?
Industrial boilers use different fuels, heating methods, and pressure-part arrangements, but their fundamental purpose is the same: transfer energy into water and deliver useful steam or hot water to an industrial load.
A technology-neutral explanation is more accurate than assuming every boiler consists of a burner feeding a conventional combustion chamber.
Step 1 — Energy Enters the Boiler System
The energy source may include:
- natural gas;
- fuel oil;
- coal;
- biomass;
- electricity;
- recoverable heat from another industrial process.
The way energy enters the boiler depends on the technology.
Gas- and oil-fired boilers normally use burners that meter fuel and combustion air.
Solid fuels require different fuel-preparation and firing systems. The U.S. Department of Energy’s Guide to Low-Emission Boiler and Combustion Equipment Selection describes stoker systems for solid fuels such as coal and biomass, as well as pulverized-fuel and fluidized-bed combustion technologies.
Fluidized-bed boilers use upward-flowing combustion air to maintain fuel and bed material in a fluidized state. Circulating fluidized bed systems additionally circulate entrained solids through the furnace and solids-separation system.
Electric boilers convert electrical energy into heat without a combustion process.
Waste-heat boilers use energy contained in another hot stream. The DOE Steam System Sourcebook notes that waste heat recovery boilers can use heat from manufacturing processes or other sources that would otherwise be discarded to generate steam.
Step 2 — Heat Is Transferred Through Heating Surfaces
Once thermal energy is available, it must be transferred to the water or steam.
In combustion boilers, this typically involves a combination of:
- radiation from the furnace and flame;
- convection as hot gases flow across heating surfaces;
- conduction through the metal separating the gas side from the water or steam side.
The relative contribution of these mechanisms changes through different sections of the boiler.
This also explains why combustion technology and pressure-part configuration are separate design dimensions.
A grate or fluidized bed describes how the fuel is burned.
Fire-tube and water-tube describe how the hot gas, water, steam, and heating surfaces are arranged.
Step 3 — Water Becomes Hot Water or Steam
The working fluid absorbs the transferred heat.
In a hot-water boiler, water is heated to the required supply temperature while remaining liquid under the system’s operating conditions.
In a steam boiler, water reaches saturation conditions and vaporizes. Because saturation temperature is linked to pressure, steam pressure and temperature cannot be considered independently.
Where superheated steam is required, the generated steam receives additional heat after evaporation, increasing its temperature above the saturation temperature corresponding to that pressure.
The DOE Steam System Sourcebook defines superheaters as heating surfaces that add energy to steam so that its temperature rises above saturation temperature at the specified pressure.
The exact circulation and steam-separation arrangement depends on boiler design. Drum boilers and once-through boilers should therefore not be described as though they operate identically.
Step 4 — Steam or Hot Water Delivers Useful Energy
The generated steam or hot water then transfers energy to the industrial process.
Steam can be distributed through piping to:
- heat exchangers;
- dryers;
- cookers;
- evaporators;
- reactors;
- sterilization equipment;
- other process loads.
One reason steam is so widely used is its ability to transfer substantial heat during condensation. The DOE’s Improving Process Heating System Performance explains that much of the heat content of steam is stored as latent heat, enabling large quantities of thermal energy to be transferred at relatively constant temperature.
Hot water performs a similar energy-transport function where steam is unnecessary.
For CHP and power-generation applications, steam may instead pass through a turbine, converting part of its energy into mechanical work and electricity.
Step 5 — Controls, Exhaust Management, and Heat Recovery Complete the System
A complete boiler installation must also manage:
- pressure;
- temperature;
- water level and flow;
- fuel and combustion conditions where applicable;
- exhaust-gas conditions;
- applicable emissions requirements.
Residual heat can sometimes be recovered through economizers or other heat-recovery surfaces. Condensate return and blowdown heat recovery can also form part of a wider steam-system energy strategy.
The appropriate heat-recovery configuration is determined by the actual heat source, steam or water duty, operating temperatures, corrosion limits, and plant operating conditions.
What Are the Main Types of Industrial Boilers?
Industrial boilers can be classified in several overlapping ways.
This is why lists that place “water-tube,” “biomass,” “CFB,” “electric,” and “steam boiler” at the same classification level can be confusing. Each term may describe a different characteristic.
By Pressure-Part Configuration
Fire-Tube Boilers
In a fire-tube boiler, hot combustion gases pass through tubes surrounded by water inside a shell.
Fire-tube designs are widely associated with packaged process-steam and hot-water service where a relatively compact configuration is appropriate.
The term fire-tube describes the gas/water arrangement. It does not identify the fuel.
A fire-tube boiler may, for example, use natural gas, fuel oil, or another suitable heat source depending on its design.
Water-Tube Boilers
In a water-tube boiler, water and steam flow inside tubes heated externally by hot gases.
Water-tube construction offers greater flexibility for larger capacities and more demanding steam conditions. The DOE Steam System Sourcebook notes that water-tube boilers are used where higher steam pressures are required and can produce both saturated and superheated steam.
They are used across process industries, industrial utilities, CHP systems, and power-generation applications.
Water-tube pressure parts can also be combined with different combustion systems, including burners, stokers, pulverized-fuel systems, and fluidized beds.
Once-Through Boilers
In a once-through steam generator, feedwater moves progressively through the heating surfaces and is converted into steam without relying on a conventional steam drum as the central steam-water separation device during normal once-through operation.
Once-through should therefore be understood as another pressure-part and circulation arrangement—not as a fuel category.
Fire-Tube vs. Water-Tube: Basic Comparison
| Factor | Fire-Tube Boiler | Water-Tube Boiler |
|---|---|---|
| Basic flow arrangement | Hot gases flow inside tubes | Water/steam flows inside tubes |
| General construction | Shell-based | Tube/header arrangement; drum or once-through designs |
| Common role | Packaged industrial steam and hot-water service | Industrial and power duties, including more demanding steam conditions |
| Configuration | Generally more straightforward | Greater flexibility for large or demanding applications |
| Selection basis | Required project conditions | Required project conditions |
This comparison is directional rather than absolute.
Capacity, pressure, temperature, fuel, operating profile, installation conditions, and applicable codes determine which configuration is appropriate. A simple claim that one design is always “better” than the other is not technically useful.
For a deeper comparison of boiler configurations, see What Are the Three Main Types of Boilers?.
By Fuel or Heat Source
A second classification answers another question:
Where does the heat come from?
Common terms include:
- gas-fired boiler;
- oil-fired boiler;
- coal-fired boiler;
- biomass-fired boiler;
- electric boiler;
- waste-heat boiler.
These terms do not automatically determine the pressure-part arrangement.
For example:
- a gas-fired boiler can be fire-tube or water-tube;
- a biomass boiler can use a grate or fluidized-bed combustion system;
- a coal boiler can use stoker, pulverized-fuel, or fluidized-bed firing;
- a waste-heat boiler can be engineered around the temperature, flow, chemistry, and pressure-drop limits of the source gas.
DOE boiler-selection guidance similarly treats fuel, boiler type, firing method, operating load, environmental constraints, and site requirements as interacting design factors.
By Combustion Technology
Combustion technology describes how a combustible fuel is introduced and burned.
Burner-Fired
Burners are commonly used for gaseous and liquid fuels.
They control the introduction and mixing of fuel and combustion air and are also used with certain pulverized-fuel systems.
Grate or Stoker-Fired
In grate- or stoker-fired boilers, solid fuel is introduced onto a grate where combustion takes place.
The complete firing system can include:
- fuel feeding;
- grate movement or support;
- primary combustion air;
- overfire air;
- ash discharge.
DOE describes modern stoker systems as integrated fuel-admission, grate, air-distribution, and ash-discharge systems used with many solid fuels.
Fluidized-Bed and CFB
Fluidized-bed combustion uses upward-flowing air to suspend and mix fuel with bed material.
Circulating fluidized bed, or CFB, technology additionally recirculates solids as part of the combustion and heat-transfer process.
CFB can be suitable for a range of coal, biomass, and other solid-fuel applications. Fuel characteristics, required output, environmental requirements, load profile, and project economics determine whether it is appropriate for a particular plant.
Pulverized-Fuel Firing
Pulverized-fuel systems use finely ground solid fuel carried into the furnace with combustion air.
This approach is particularly associated with larger pulverized-coal steam-generation applications.
By Thermal Output
Boilers can also be classified by what they deliver.
Steam Boilers
Steam boilers produce saturated or, where required, superheated steam for:
- process heating;
- plant utilities;
- CHP;
- power generation.
Hot-Water Boilers
Hot-water boilers supply heated circulating water for:
- industrial thermal processes;
- central heating;
- district heating;
- other hot-water duties.
Why One Boiler Can Belong to Several Categories
The categories overlap rather than exclude one another.
| Example | Heat Source | Combustion Technology | Pressure-Part Configuration | Output |
|---|---|---|---|---|
| Gas-fired package boiler | Natural gas | Burner-fired | Fire-tube or water-tube | Steam or hot water |
| Biomass grate boiler | Biomass | Grate-fired | Commonly water-tube in larger industrial configurations | Steam or hot water |
| Coal-fired CFB boiler | Coal | Fluidized-bed | Water-tube | Steam or hot water |
| Waste-heat boiler | Recovered industrial heat | No primary firing necessarily required | Project-specific | Steam or hot water |
| Electric boiler | Electricity | No combustion | Project-specific | Steam or hot water |
The key point is simple:
“Biomass boiler,” “water-tube boiler,” “CFB boiler,” and “steam boiler” are not mutually exclusive terms.
They answer different engineering questions.
What Are Industrial Boilers Used For?
Industrial boiler applications are easier to understand by looking first at what thermal function the boiler performs, rather than assigning one boiler technology to a particular industry.
Process Steam
Process steam transfers thermal energy from the boiler house to production equipment.
Typical functions include:
- heating;
- drying;
- cooking;
- washing and cleaning;
- sterilization;
- evaporation;
- process heat exchange.
This is why steam systems are found in food and beverage, textiles, pulp and paper, chemicals, pharmaceuticals, refining, and many other industries.
The required steam pressure, temperature, capacity, purity, and load profile can vary significantly even within the same industry. An industry name alone is therefore not enough to define the boiler.
For a more detailed industry-level overview, see Industrial Boiler Applications by Industry.
Industrial Hot Water and Heating
Processes that do not require steam may use hot water instead.
Industrial hot-water boilers can serve:
- process hot-water systems;
- plant heating;
- district-heating networks;
- central heating;
- other circulating-water thermal loads.
CHP and Power Generation
Steam can also generate mechanical work and electricity.
In CHP systems, steam passes through a turbine to generate power while useful thermal energy remains available for industrial or heating requirements.
The U.S. Department of Energy’s Combined Heat and Power Technology Fact Sheet: Steam Turbines covers industrial steam-turbine CHP applications, including configurations in which useful steam remains available after power generation.
A back-pressure steam turbine is particularly relevant where turbine exhaust steam continues to serve an industrial steam system rather than being fully condensed solely for power generation.
Waste-Heat Recovery
Many industrial processes discharge hot gases containing recoverable thermal energy.
Potential sources include:
- furnace exhaust;
- gas-turbine exhaust;
- high-temperature process gases;
- other industrial exhaust streams.
The DOE Steam System Sourcebook identifies waste-heat recovery boilers as systems that use otherwise discarded heat to generate steam.
Actual recovery performance must be determined from the source-gas temperature, flow, composition, allowable pressure drop, minimum outlet temperature, and required steam or hot-water duty. Applying one universal efficiency-improvement percentage across unrelated projects would not provide a sound engineering basis.
What Specifications Define an Industrial Boiler?
An industrial boiler cannot be properly specified by capacity alone.
DOE boiler-selection guidance identifies factors including fuel, heating load and load variation, pressure and temperature requirements, environmental constraints, site conditions, and regulatory requirements.
For a real industrial project, seven groups of information are especially important.
1. Capacity and Required Thermal Duty
Boiler capacity may be expressed in:
- kg/h of steam;
- t/h or TPH;
- lb/h;
- MW of thermal output.
Capacity tells the supplier how much useful output the system must provide.
It does not reveal:
- fuel;
- pressure;
- steam temperature;
- load pattern;
- firing technology;
- emissions-control requirements;
- supply scope.
A 20 TPH natural-gas package boiler and a 20 TPH biomass-fired water-tube boiler can therefore be very different systems even though their nominal steam outputs are the same.
The required capacity should ultimately come from the plant’s actual steam or thermal load rather than from nameplate capacity alone. For a detailed capacity methodology, see the Industrial Steam Boiler Sizing Guide.
2. Pressure and Temperature
Pressure and temperature are closely linked in steam systems.
For saturated steam, saturation temperature is determined by pressure.
For superheated steam, the project must specify both the required pressure and final steam temperature because additional superheating duty and heating surfaces are required.
For hot-water systems, important conditions usually include:
- supply-water temperature;
- return-water temperature;
- operating pressure;
- required circulation flow.
Pressure and temperature influence:
- pressure-part design;
- heating-surface arrangement;
- material selection;
- downstream equipment compatibility;
- applicable code requirements.
For engineering and quotation purposes, actual design conditions are more useful than broad labels such as “low-pressure” or “high-pressure.”
For further background, see Industrial Boiler Temperature Ranges Explained.
3. Fuel or Heat Source
Fuel can fundamentally change the boiler system.
For gaseous and liquid fuels, relevant information may include composition, heating value, supply pressure, and—for liquid fuels—properties affecting pumping and atomization.
Solid fuels usually require more detailed characterization.
For coal and biomass, relevant properties can include:
- heating value;
- moisture;
- ash content and characteristics;
- particle size and physical form;
- variability between fuel batches.
DOE notes that solid-fuel preparation and handling methods depend strongly on particle size and fuel characteristics.
These properties can influence:
- furnace design;
- combustion technology;
- fuel feeding;
- ash handling;
- fouling and slagging behavior;
- downstream flue-gas treatment.
This is why a description such as “biomass boiler” is not a complete design basis. Rice husks, wood chips, bagasse, palm residues, spent grain, and other biomass fuels can impose substantially different combustion and handling requirements.
4. Load Profile and Operating Mode
Nameplate output is only one part of the duty.
A project should also define:
- normal operating load;
- peak load;
- minimum expected demand;
- frequency of load changes;
- operating hours;
- continuous or intermittent service;
- redundancy requirements.
Two factories with the same peak steam demand can require different boiler configurations if one operates continuously near base load while the other experiences frequent process swings.
The load profile influences equipment selection, control strategy, operating flexibility, and decisions about single- versus multiple-boiler arrangements.
5. Water, Site, and Utility Conditions
The boiler must operate within the conditions of the actual plant.
Important water-side information includes:
- feedwater quality;
- feedwater temperature;
- condensate return;
- make-up water characteristics;
- return-water conditions for hot-water systems.
Site information can include:
- ambient temperature;
- altitude;
- indoor or outdoor installation;
- available footprint and height;
- transportation and lifting constraints.
Available utilities may include:
- electrical supply;
- fuel infrastructure;
- raw and treated water;
- instrument air;
- other plant services.
These factors can change fan selection, auxiliary systems, layout, insulation, controls, and installation requirements even when the nominal boiler rating remains unchanged.
6. Emissions, Codes, and Local Requirements
Environmental and regulatory requirements should be identified early in the project.
Emission limits vary according to:
- fuel;
- boiler category;
- plant type;
- jurisdiction;
- local permitting requirements.
Different pollutants also require different control strategies. Particulate matter, sulfur compounds, and NOx should not be treated as though one generic “filter” controls them all.
As one jurisdiction-specific example, the U.S. Environmental Protection Agency’s NESHAP for Major Source Industrial, Commercial, and Institutional Boilers and Process Heaters establishes requirements addressing pollutants including mercury, hydrogen chloride, particulate matter, and carbon monoxide for relevant major-source installations.
These are U.S. requirements and should not be interpreted as universal international emission limits. Each project must establish the regulations applicable at its destination.
Design codes and certification requirements are equally important.
ASME’s current 2025 Boiler and Pressure Vessel Code includes, among other boiler-related sections:
- BPVC Section I — Rules for Construction of Power Boilers
- BPVC Section IV — Rules for Construction of Heating Boilers
Other projects may involve EN/PED requirements, national boiler regulations, local inspection requirements, or customer-specific specifications.
The required design and certification basis should be established before final design and manufacturing.
7. Scope of Supply
The final major specification is both technical and commercial:
What is the supplier responsible for providing?
A project may be quoted as:
- boiler only;
- boiler package;
- boiler island;
- broader EPC or system scope.
The difference can include responsibility for:
- fuel handling;
- feedwater systems;
- water treatment;
- environmental equipment;
- electrical and instrumentation systems;
- installation;
- commissioning;
- spare parts;
- training.
Scope differences can materially change both the quotation and the work that remains for the buyer or EPC contractor.
This is another reason two boilers with the same TPH or MW rating cannot be compared on price alone. For a deeper discussion of cost boundaries, see the Industrial Steam Boiler Cost Guide.
How Boiler Specifications Work Together: A Real Project Example
Consider a buyer who says:
“We need a 30 TPH boiler.”
That establishes only the required steam capacity.
It does not tell the manufacturer whether the project requires:
- natural gas, coal, biomass, or another heat source;
- saturated or superheated steam;
- fire-tube or water-tube construction;
- grate or fluidized-bed combustion;
- stable or highly variable operation;
- boiler-only supply or an integrated boiler island.
A real project illustrates why these dimensions need to be considered together.
Our Thailand Biomass CHP Project
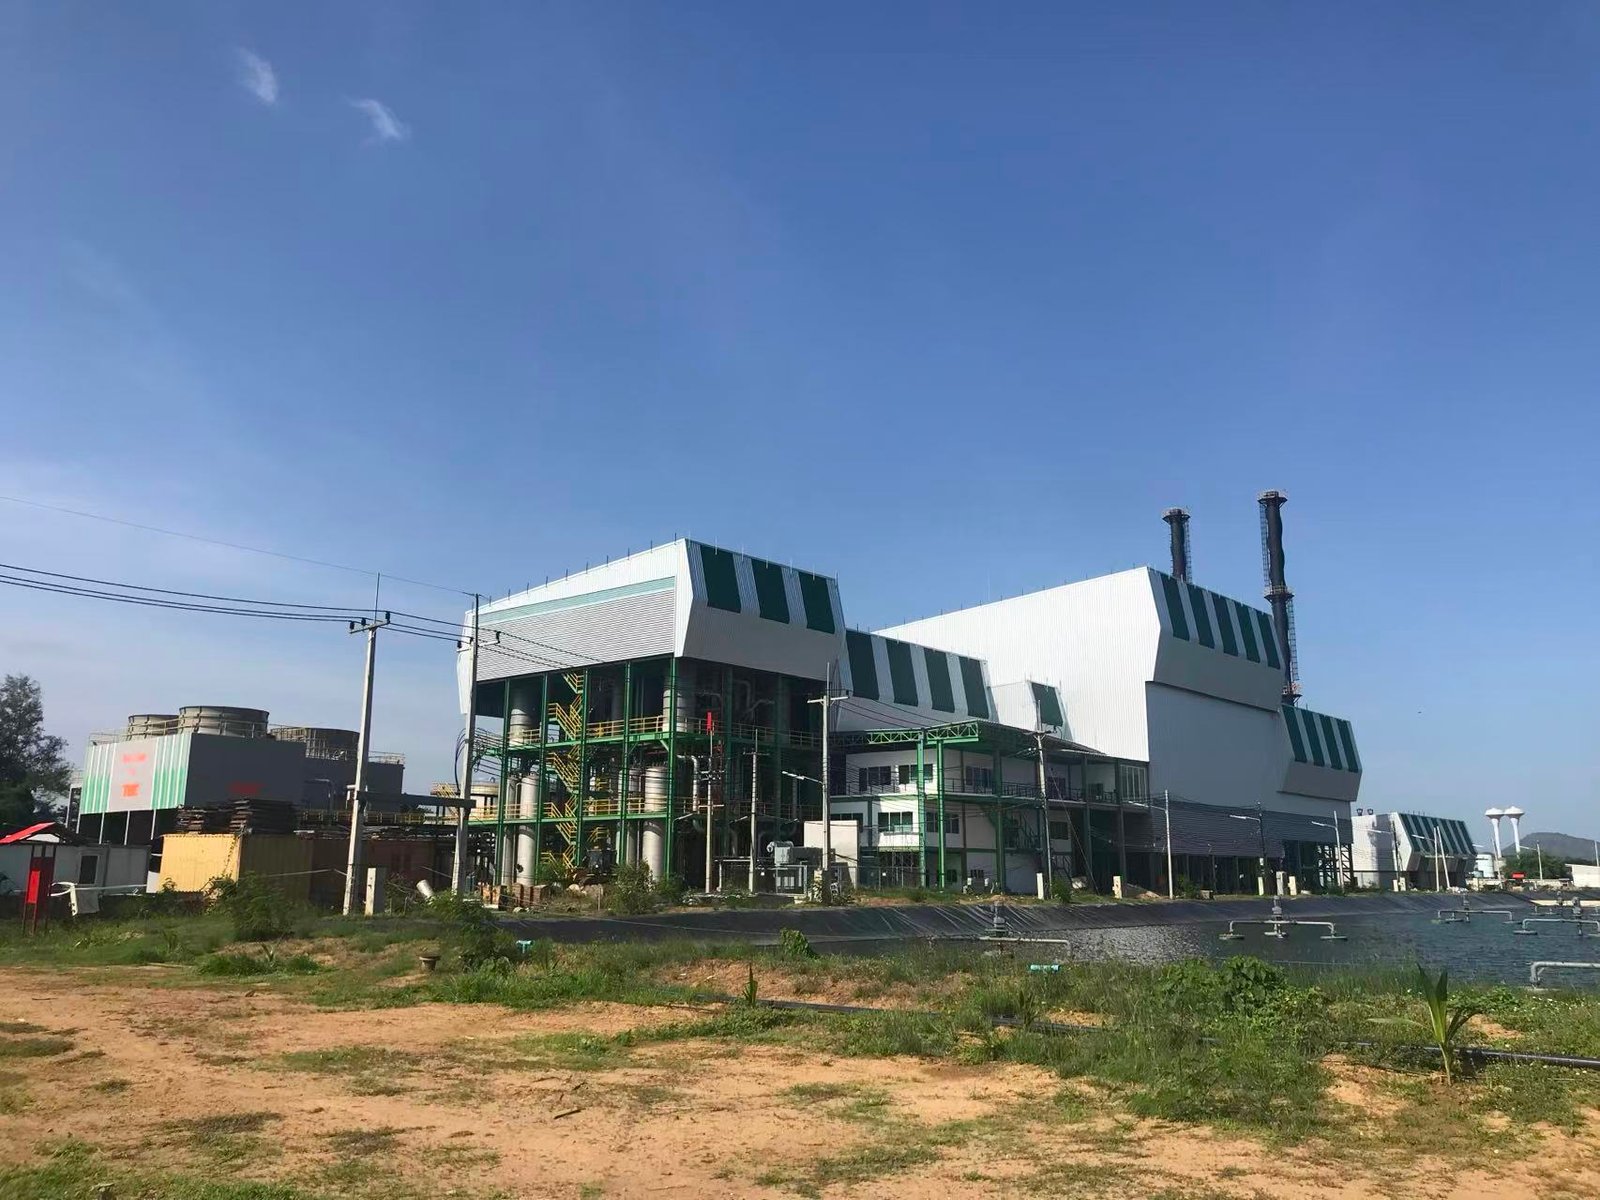
In one of our published projects in Thailand, Taishan Group supplied two 30 TPH spent-grain biomass boilers together with a 9 MW back-pressure steam turbine-generator system for a beverage-industry project. Our published Project Case portfolio identifies the work as a boiler-island EPC project and specifies ASME requirements.
The verified project information already tells us much more than the phrase “30 TPH boiler”:
| Verified Project Information | What It Tells Us |
|---|---|
| 2 × 30 TPH boilers | Installed steam-generation capacity and multi-unit arrangement |
| Spent-grain biomass | Fuel and combustion-design basis |
| 9 MW back-pressure steam turbine-generator | Integration of power generation with continuing thermal use |
| Beverage-industry project | Industrial process and CHP duty |
| Boiler-island EPC | Supply responsibility extends beyond boiler pressure parts |
| ASME requirement | Defined project code/certification basis |
The two boilers provide 60 TPH of installed steam-generation capacity, but that figure should not be converted into a universal TPH-per-MW relationship for the 9 MW turbine.
Our publicly available project information does not disclose the complete turbine heat balance, steam inlet and exhaust conditions, process-steam consumption, or simultaneous operating loads.
Without those inputs, reconstructing the detailed steam-to-power relationship would be speculative.
That limitation illustrates the central engineering point of this guide:
A boiler project is defined by the combination of capacity, steam conditions, fuel, operating duty, equipment configuration, codes, site requirements, and supply scope—not by one nameplate figure.
What Should You Understand Next?
Once the fundamentals are clear, individual project questions can be examined in greater depth.
| If You Need to Understand… | Detailed Guide |
|---|---|
| What equipment is inside an industrial boiler system | Industrial Boiler Components Guide |
| The main boiler configurations and their differences | What Are the Three Main Types of Boilers? |
| How much steam capacity is required | Industrial Steam Boiler Sizing Guide |
| Boiler and steam operating temperatures | Industrial Boiler Temperature Range |
| How boiler efficiency is evaluated | Industrial Boiler Efficiency Guide |
| Boiler requirements for different industries | Industrial Boiler Applications by Industry |
| Routine and preventive maintenance | Industrial Boiler Preventive Maintenance Guide |
| Boiler protection and safety systems | Industrial Boiler Safety Features |
| What affects boiler purchase and project cost | Industrial Steam Boiler Cost Guide |
| What should be included in a supplier quotation | Industrial Boiler Scope of Supply Guide |
This guide provides the common framework. Detailed engineering decisions should then be addressed within the relevant technical topic.
Frequently Asked Questions About Industrial Boilers
What is an industrial boiler?
An industrial boiler is a thermal system that transfers energy into water to produce steam or hot water for industrial processes, heating, CHP, power generation, or other thermal duties. The energy may come from combustion, electricity, or recovered industrial heat.
How does an industrial boiler work?
Energy from fuel, electricity, or recovered heat is transferred through heating surfaces into water. The water is heated or converted into steam, and the steam or hot water then carries useful thermal energy to industrial processes, heating systems, or power-generation equipment.
What are the main types of industrial boilers?
Common industrial boiler types include fire-tube and water-tube boilers; gas-, oil-, coal-, and biomass-fired boilers; grate-fired and fluidized-bed boilers; electric boilers; waste-heat boilers; and steam or hot-water boilers.
These names come from different classification systems, so one boiler can belong to several categories at the same time.
What is the difference between fire-tube and water-tube boilers?
In a fire-tube boiler, hot gases flow through tubes surrounded by water. In a water-tube boiler, water and steam flow inside tubes heated externally.
Fire-tube designs are common in packaged steam and hot-water applications, while water-tube construction offers greater flexibility for larger capacities and demanding steam conditions. The appropriate configuration is determined by the actual operating requirements.
Does every industrial boiler use a burner?
No.
Gas- and oil-fired boilers commonly use burners, but solid fuels can be burned on grates or in fluidized beds. Electric boilers do not require combustion, and waste-heat boilers can recover energy from external hot-gas streams without conventional primary firing.
What information is needed to specify an industrial boiler?
A useful starting specification should include:
- required capacity or thermal duty;
- steam pressure and temperature, or hot-water temperatures;
- fuel type and relevant fuel characteristics;
- normal, peak, and variable-load requirements;
- feedwater and site conditions;
- destination and emissions requirements;
- applicable design code or certification;
- expected scope of supply.
Together, these inputs provide a much stronger engineering basis than capacity alone.
Conclusion
Industrial boilers are best understood as multidimensional thermal systems, not as one list of mutually exclusive boiler types.
Terms such as water-tube, biomass-fired, CFB, and steam boiler describe different characteristics: pressure-part configuration, heat source, combustion technology, and thermal output.
A real industrial boiler project is then defined more precisely by its capacity, pressure, temperature, fuel characteristics, load profile, water and site conditions, environmental requirements, design code, and supply scope.
Understanding how these factors interact makes it easier to compare boiler technologies, interpret technical specifications, evaluate quotations, and communicate project requirements accurately.
If you are preparing an industrial boiler project, providing the required capacity, steam pressure and temperature, fuel information, operating profile, destination country, and expected supply scope gives the engineering team a much stronger basis for evaluating the appropriate boiler configuration.
References
Improving Steam System Performance: A Sourcebook for Industry, Second Edition
U.S. Department of Energy technical reference covering industrial steam systems, fire-tube and water-tube boilers, waste-heat recovery, superheaters, steam distribution, and condensate recovery.
Guide to Low-Emission Boiler and Combustion Equipment Selection
U.S. Department of Energy technical guide covering fuels, burners, stokers, pulverized-fuel systems, fluidized-bed combustion, boiler-selection factors, site conditions, and environmental considerations.
Improving Process Heating System Performance: A Sourcebook for Industry
U.S. Department of Energy reference covering industrial process heating and the thermal characteristics that make steam an effective industrial heat-transfer medium.
Combined Heat and Power Technology Fact Sheet: Steam Turbines
U.S. Department of Energy resource covering steam-turbine CHP systems and industrial applications.
Industrial, Commercial, and Institutional Boilers and Process Heaters: NESHAP for Major Sources
U.S. Environmental Protection Agency reference for U.S. major-source boiler and process-heater hazardous-air-pollutant requirements.
2025 ASME Boiler and Pressure Vessel Code
Official ASME overview of the current Boiler and Pressure Vessel Code, including Section I for Power Boilers and Section IV for Heating Boilers.
Babcock & Wilcox engineering reference covering steam-generation principles, including conventional drum and once-through boiler arrangements.
First-party project source supporting the Thailand beverage-industry biomass CHP example used in this guide.
Industrial Boiler Guide: How They Work, Types & Key Specifications Read More »