Industry News

Upfront and Long-Term Costs of a Circulating Fluidized Bed Boiler
Upfront and Long-Term Costs of a Circulating Fluidized Bed Boiler

Circulating Fluidized Bed (CFB) boilers are renowned for their fuel flexibility, high combustion efficiency, and low emissions, making them ideal for industrial users with variable fuels or strict environmental targets. However, CFB technology involves complex systems and higher capital requirements compared to traditional boilers. To make a sound investment, it’s crucial to evaluate both upfront and long-term costs—not just the purchase price.

The upfront costs of a CFB boiler include the boiler unit itself, fuel handling and feeding systems, air distribution and bed material systems, flue gas cleaning equipment, and site preparation. Long-term costs encompass fuel procurement, maintenance (including refractory repair and ash handling), emissions control operations, bed material replenishment, and system monitoring. Although CFB boilers may have higher capital costs than conventional boilers, they offer better efficiency, lower emissions penalties, and adaptability to low-cost or waste fuels, leading to long-term savings.

Here’s a comprehensive look at the key cost drivers to help you plan your investment wisely.
What Are the Typical Upfront Costs of Purchasing and Installing a CFB Boiler System?

Circulating Fluidized Bed (CFB) boilers are among the most versatile and efficient technologies for burning low-grade fuels—including biomass, coal, petcoke, and waste-derived materials. But this flexibility and performance come at a significant upfront capital cost. CFB systems require advanced combustion chambers, cyclone separators, in-bed heat exchangers, fuel and ash handling systems, and robust emissions control—resulting in higher total installed cost compared to simpler boiler types. For investors, plant owners, and procurement managers, understanding the full capital scope is essential for budgeting, financing, and evaluating long-term return on investment.

The typical upfront cost of purchasing and installing a CFB boiler system ranges from $8 million to over $60 million depending on system size, fuel type, emissions compliance requirements, and degree of automation. Smaller industrial-scale CFB boilers (10–50 TPH) typically cost $8–20 million installed, while utility-scale CFB plants (100–500 TPH) range from $25–60+ million. These costs include the boiler unit, combustion island, fuel handling, ash systems, emissions controls, balance-of-plant equipment, civil works, and commissioning.

The initial price is high—but so is the flexibility and efficiency payoff over decades of operation.

CFB boiler systems have high capital costs due to complex combustion design, cyclone separation, and emissions control infrastructure.True

These systems require advanced components and multiple support systems to handle diverse fuels and comply with environmental standards.


📦 Typical Installed Cost Breakdown of a CFB Boiler Project

Major System ComponentCost Range (USD)% of Total Cost
CFB Boiler Island (furnace + separator)$4M – $18M25–35%
Fuel Handling and Feeding$1M – $6M10–15%
Ash Handling System$500K – $3M5–8%
Emissions Control (ESP, SNCR, FGD)$1.5M – $10M15–25%
Air Supply System (fans, ducts)$600K – $2.5M5–8%
Water Treatment & Steam Distribution$800K – $3M5–10%
Instrumentation & Automation (DCS/PLC)$500K – $3M5–7%
Civil, Structural, and Foundations$1.5M – $6M10–15%
Erection, Commissioning & Testing$1M – $4M5–10%

Total Installed Cost:

  • 10–50 TPH CFB: $8M – $20M

  • 60–100 TPH CFB: $18M – $35M

  • 150–500 TPH CFB: $40M – $60M+


📉 Cost Comparison with Other Boiler Types

Boiler TypeInstalled Cost (USD/MWth)FlexibilityEmissions Control Required
CFB Boiler$700,000 – $1.2MHighYes (advanced)
Stoker Grate Boiler$500,000 – $800,000ModerateModerate
Pulverized Coal Boiler$600,000 – $900,000LowHigh
Gas/Oil-Fired Boiler$200,000 – $500,000LowMinimal

CFBs cost more—but offer fuel flexibility, lower NOₓ emissions, and are ideal for waste fuels, biomass, and high-ash coals.


🧪 Case Study: 100 TPH Biomass CFB Boiler

System Specs:

  • Fuel: Mixed biomass and RDF

  • Design: 100 TPH @ 480°C, 65 bar

  • Fuel Moisture: 20%

  • Operating hours/year: 7,500

Installed Cost Breakdown:

  • CFB Boiler Unit: $13.5M

  • Fuel Handling: $3.2M

  • Ash & Slag: $2.1M

  • Emissions (SCR, ESP): $6.8M

  • Civil & Structure: $4.4M

  • Control System: $2.1M

  • Steam Distribution & WTP: $2.7M

  • Total Project Cost: ~$34.8 million

Simple Payback Period: ~5.5 years (based on fuel savings vs. oil-fired system)


📋 Factors That Influence Final Capital Cost

FactorImpact on Total Cost
System Size (TPH)Larger = higher CAPEX, better unit cost
Fuel Type (coal, biomass, RDF)Lower-grade fuels need more handling, drying
Ash ContentHigh ash = bigger ash systems and cyclones
Steam Parameters (pressure/temp)Higher specs = thicker pipes, better steel
Emissions RegulationsStrict regions need ESP, FGD, or SCR
Site Conditions (space, soil)Tough sites = more civil and foundation work
Automation LevelHigher automation = better OPEX, higher upfront

A modular design approach can reduce cost by 10–15% through prefabrication and faster erection.


Summary

The typical upfront cost of a CFB boiler system varies widely—from $8 million for industrial-scale units to over $60 million for large utility applications. These costs reflect the advanced technology needed for flexible fuel handling, clean combustion, and environmental compliance. While CFB systems demand high capital outlays, they offer superior efficiency, multi-fuel flexibility, and lower long-term emissions penalties. For operations with variable fuel sources, carbon reduction goals, or long-duty cycles, the high upfront cost of CFB is often offset by lifecycle savings and fuel versatility. When budgeting for CFB, think big—not just in size, but in long-term value.
How Do Auxiliary Systems (Fuel Feeders, Air Systems, Ash Handling) Impact Capital Cost in a CFB Boiler System?

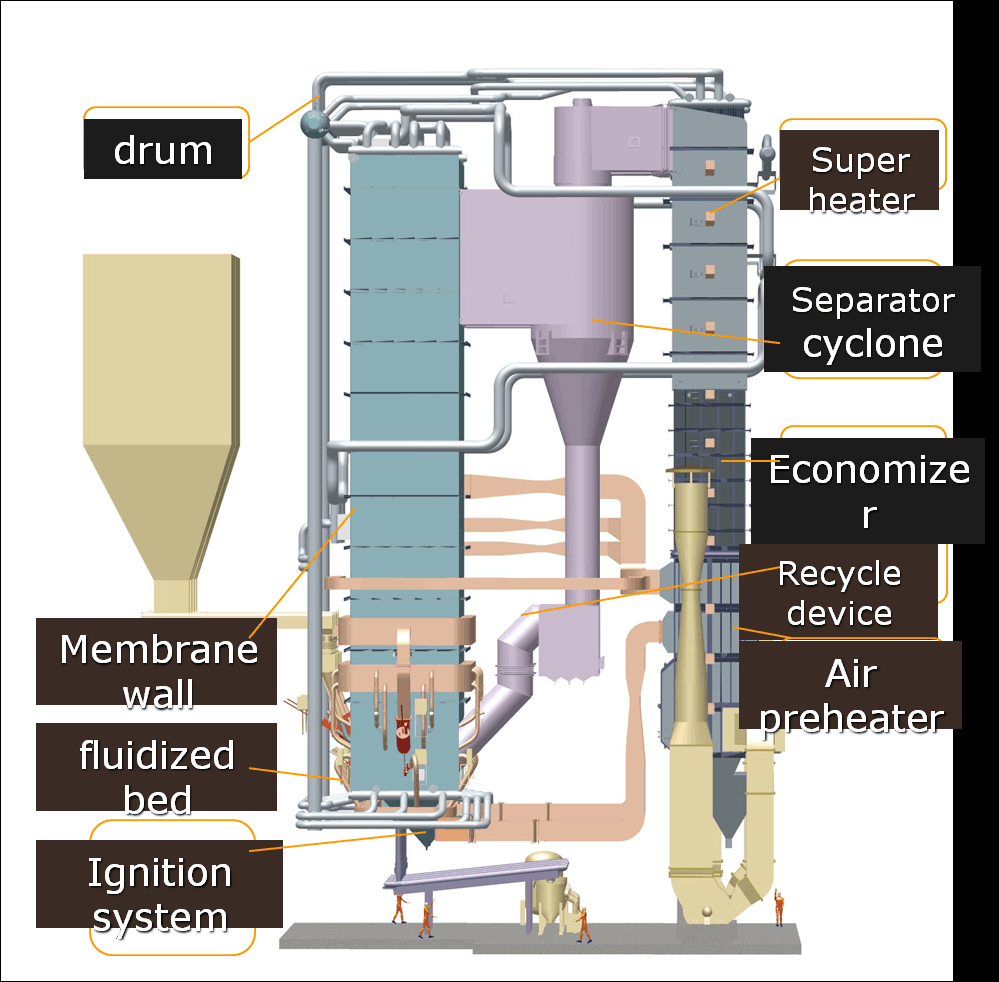
In a Circulating Fluidized Bed (CFB) boiler project, the core boiler unit gets much of the attention—but it’s the auxiliary systems that complete the process and often drive up capital costs significantly. These include fuel feeding systems, air supply units, and ash handling equipment—all essential for combustion, emissions control, and continuous, reliable operation. Depending on boiler size and fuel complexity, auxiliary systems can add 25% to 40% to the total capital budget. Understanding their function and cost contribution is essential for accurate budgeting, system design, and project financing.

Auxiliary systems—including fuel feeders, air systems, and ash handling—typically contribute 25%–40% of the total installed capital cost in a CFB boiler project. Fuel feeders ensure consistent delivery of variable fuels, air systems support fluidization and combustion with high-capacity fans and ducts, and ash handling systems remove bed material and fly ash continuously. These subsystems require durable, automated, and often customized equipment that varies by fuel type, ash content, and emissions compliance. Their complexity and cost grow with boiler size, fuel variability, and environmental requirements.

In CFB projects, support systems aren’t optional—they’re structural cost pillars.

Auxiliary systems can account for more than one-third of the capital cost in a CFB boiler system.True

These systems are essential for delivering fuel, managing combustion air, and safely removing ash, and they require robust infrastructure and controls.


🏗️ Capital Cost Breakdown of Auxiliary Systems

Auxiliary SystemFunctionCost Range (USD)% of Total Project Cost
Fuel Feeding SystemStores, conveys, and meters fuel$1M – $6M10–15%
Air Supply SystemDelivers primary, secondary, tertiary air$800K – $4M7–12%
Ash Handling SystemRemoves bed ash, cyclone ash, fly ash$500K – $3.5M5–10%
Combined Auxiliary CapEx$2.5M – $12M+25–40%

The exact cost depends on boiler size, fuel moisture/ash levels, system redundancy, and automation.


🔁 Fuel Feeding Systems: Complexity and Cost Drivers

ComponentPurposeCost Impact
Silo or BunkerStores raw biomass, coal, or RDFHigh (large footprint, safety systems)
Conveyor (belt, screw, chain)Moves fuel into the furnaceModerate to high (depends on distance/volume)
Fuel Metering FeederControls feed rate to bedHigh (precision is critical for stable combustion)
Drying Pre-Treatment (if used)Reduces moisture in fuelVery high (especially for >30% MC fuels)

For high-moisture fuels, pre-drying systems alone can cost $1M–$2M+, significantly increasing CAPEX.

High-moisture and mixed fuels require more complex and costly fuel feeding systems in CFB applications.True

Wet or variable fuels require drying, metering, and anti-clogging systems to maintain stable combustion.


🌬️ Air Supply System: The Heart of Fluidization

Air System ElementRoleCost Consideration
Primary Air FansFluidize bed materialHigh power, must run 24/7
Secondary Air FansEnhance combustion/NOₓ reductionModerate cost, critical to flame shape
Tertiary Air (if any)Finishes combustion in upper furnaceAdds ducting and fan cost
Air PreheatersReclaim heat, improve efficiencyOptional, adds 5–8% to air system cost

Fan redundancy and VFDs (variable frequency drives) increase cost but improve control and energy savings.


🧱 Ash Handling: Managing the Residue of Combustion

Ash TypeHandling MethodEquipment Needed
Bed AshExtracted from bottom furnaceDrag chain or screw coolers
Cyclone AshCaptured in separatorsPneumatic or mechanical removal
Fly AshCaptured in ESP or baghouseAsh silo, truck loading unit
Ash System Cost FactorCost Range (USD)Notes
Low-ash fuels (e.g., pellets)$500K – $1.2MSmaller silos, lighter-duty conveyors
High-ash fuels (e.g., rice husk, RDF)$1.5M – $3.5MRequires robust, high-capacity system

Design must consider abrasion, temperature, and dust control—especially in high-ash fuels.

Ash handling systems in CFB boilers must be engineered for high temperature and abrasive materials.True

Hot ash from bed and cyclone areas is abrasive and must be cooled and conveyed reliably to avoid damage and safety issues.


📉 Example: Auxiliary Costs in a 100 TPH CFB Project

SystemInstalled Cost (USD)
Fuel Handling & Feed$3.4 million
Air Fans + Ducts$2.2 million
Ash Handling (hot + fly ash)$2.7 million
Total Auxiliary Systems$8.3 million
Total Plant Cost~$32 million
% of Total~26%

📋 Cost-Saving Design Strategies

StrategyBenefit
Modular Fuel Feed DesignEasier installation, lower footprint
Variable Speed FansEnergy savings, better air control
Dry Ash vs. Wet Ash HandlingLower water use, lower environmental fees
Shared Conveyor InfrastructureReduces duplication in dual-fuel setups
Smart Ash Level SensorsAvoids overflow, automates disposal

Summary

Auxiliary systems in a CFB boiler—fuel feeding, air supply, and ash handling—are critical to system function and major contributors to capital cost. Together, they can represent 25% to 40% of the total installed project cost, especially for plants using high-moisture or high-ash fuels. These systems must be custom-designed for fuel characteristics, boiler size, and emissions compliance. In project budgeting and planning, overlooking their cost and complexity leads to underestimation and construction delays. For any CFB investment, it’s not just about the boiler—it’s about the infrastructure that makes it burn cleanly, continuously, and cost-effectively.
What Are the Recurring Operational Costs, Including Fuel, Bed Materials, and Maintenance for a CFB Boiler System?

While the upfront capital investment in a CFB (Circulating Fluidized Bed) boiler system is substantial, long-term profitability hinges on recurring operating costs. These include fuel (the largest cost), bed materials, maintenance, water treatment, emissions control, and labor. Due to the complex nature of CFB operation—which allows for multi-fuel flexibility and low emissions—the recurring cost profile is more varied and technically demanding than in simpler combustion systems. Understanding these costs in advance is critical for accurate lifecycle budgeting and ROI forecasting.

Recurring operational costs for a CFB boiler system typically range from $30 to $100 per megawatt-hour (MWh) of steam or heat generated, depending on fuel type, system size, run hours, and emissions requirements. The largest components are fuel (40–70% of OPEX), bed materials like sand or limestone (5–15%), and maintenance (10–20%). Other recurring costs include emissions consumables, labor, ash disposal, and water treatment. For a 100 TPH CFB system running 7,000+ hours annually, total recurring OPEX can range from $3 million to over $10 million per year.

CFB systems offer combustion flexibility—but that comes with a cost structure that must be carefully monitored and managed.

Fuel, bed material, and maintenance make up the bulk of recurring operational costs in CFB boiler systems.True

These elements are essential for maintaining combustion stability, emissions compliance, and long-term boiler reliability.


📦 Typical Breakdown of Recurring Operational Costs

Cost Category% of Total OPEXNotes
Fuel (biomass, coal, RDF)40–70%Depends on price, GCV, and moisture
Bed Materials (sand, limestone)5–15%Replenished regularly due to attrition
Routine Maintenance10–20%Tube cleaning, fan repairs, refractory
Labor and Supervision5–12%24/7 staff, technicians, shift ops
Water Treatment Chemicals2–5%For steam generation and system protection
Emissions Reagents (ammonia, lime)2–8%SNCR/ESP/baghouse/FGD consumables
Ash Handling and Disposal2–6%Depends on ash content and haul rates
Monitoring & Calibration1–3%Sensor recalibration, stack testing

These proportions vary depending on fuel type, regional costs, boiler capacity, and automation level.


🔥 Fuel Cost Estimates by Type

Fuel TypePrice (USD/ton)GCV (MJ/kg)Fuel Cost per MWh Thermal
Wood chips (dry)$60–$8015–18$20–30
Coal (bituminous)$80–$12020–26$25–35
Rice husk / agro waste$30–$6013–16$15–25
RDF / MSWOften subsidized10–14$0–20 (with gate fees)

CFB boilers’ ability to blend fuels can reduce average fuel cost, especially by using high-ash or subsidized waste streams.


🧱 Bed Material Cost and Consumption

MaterialPurposeCost (USD/ton)Consumption RateAnnual Cost (100 TPH Boiler)
Quartz SandBed fluidization, heat retention$30–$80~2–5 kg/ton fuel$80,000 – $300,000
LimestoneIn-bed sulfur capture$50–$150~4–8 kg/ton fuel$150,000 – $500,000

Bed materials must be replenished due to mechanical wear, chemical reaction, and fines carryover.

Bed materials like sand and limestone must be regularly replenished in CFB boilers to maintain combustion and emissions performance.True

Limestone neutralizes sulfur, and sand maintains fluidization—both degrade during normal operation.


🧪 Example: 100 TPH Biomass CFB Boiler (7,200 hours/year)

Cost CategoryEstimate (USD)
Fuel (biomass mix @ $70/ton)~$4.5 million
Bed materials (sand + limestone)~$450,000
Maintenance & Spares~$800,000
Labor (5–8 full-time staff)~$600,000
Emissions Consumables (urea, lime)~$250,000
Water Treatment~$120,000
Ash Disposal~$300,000
Stack Monitoring & Licenses~$60,000
Total Annual OPEX~$7.08 million

Cost per MWh steam output: ~$28–$35, depending on efficiency and fuel blend.


📋 Factors That Drive Up Operational Costs

FactorWhy It Raises Costs
High Moisture FuelsIncreases fuel consumption and ash
Poor Bed Material ManagementReduces combustion stability, causes downtime
Unscheduled MaintenanceHigher labor, part costs, and lost production
Tight Emissions LimitsRequires more reagents and CEMS services
Manual Ash HandlingRaises labor and disposal fees

Cost increases can be mitigated with automation, fuel pre-treatment, and performance monitoring.


📈 Cost-Saving Strategies for CFB Operations

StrategyPotential Benefit
Fuel Blending OptimizationReduces average fuel cost by 10–30%
Bed Material RecyclingCuts material cost by 20–40%
Predictive Maintenance SystemsReduces unplanned outages by 50%
Optimized Emissions DosingSaves 10–25% on reagent use
Automation & O₂ TuningLowers fuel use by 5–8%

Fuel cost optimization and bed material recycling are among the most effective ways to lower CFB boiler operating expenses.True

These strategies target the largest variable cost drivers and improve combustion efficiency and material reuse.


Summary

Recurring operational costs for CFB boiler systems are substantial and varied, with fuel, bed materials, and maintenance as dominant contributors. Depending on size and fuel strategy, OPEX ranges from $3 million to over $10 million annually, especially for 50–150 TPH systems. Smart O&M practices, effective fuel management, and automation can help reduce these expenses significantly over the boiler’s 20–30 year lifespan. For any facility planning or operating a CFB system, controlling these recurring costs is key to sustaining long-term economic and environmental performance.
How Do Emissions Control and Environmental Compliance Affect Long-Term Expenses in a CFB Boiler System?

Environmental regulations are becoming increasingly stringent worldwide, and compliance is no longer optional—it’s a core operating cost. For Circulating Fluidized Bed (CFB) boilers—praised for low NOₓ emissions and fuel flexibility—environmental control systems are still critical, particularly for SO₂, particulate matter (PM), heavy metals, and CO emissions. To comply with local, national, or global air quality laws, CFB systems require advanced emissions control equipment and ongoing monitoring, both of which translate into substantial long-term expenses across the lifecycle of the plant.

Emissions control and environmental compliance affect long-term expenses in CFB boiler systems by adding upfront capital investment and recurring operational costs associated with equipment maintenance, reagent use, emissions monitoring, stack testing, and regulatory reporting. Over a 20-year life cycle, these systems can account for 10%–25% of total operating expenses. Compliance with regulations for SO₂, NOₓ, PM, and CO requires technologies like SNCR/SCR, ESPs, fabric filters, flue gas desulfurization (FGD), and continuous emissions monitoring systems (CEMS), all of which require maintenance, consumables, and regular upgrades. Non-compliance can result in fines, permit revocation, or forced shutdowns—making proactive investment a necessity.

The cost of compliance is significant—but the cost of non-compliance is far greater.

Emissions control systems and compliance management represent a major long-term operating expense in CFB boiler systems.True

They require ongoing reagent use, monitoring, equipment maintenance, and regulatory reporting, often adding 10–25% to total OPEX.


🔍 Key Emissions Regulated in CFB Systems

Emission TypeControl RequirementCommon Technology
Particulate Matter (PM)Strict limits for air qualityESPs or baghouses
Sulfur Dioxide (SO₂)Acid rain and SOx capsIn-bed limestone + FGD
Nitrogen Oxides (NOₓ)Ozone & smog regulationsSNCR or SCR
Carbon Monoxide (CO)Incomplete combustion markerCombustion optimization
Mercury/MetalsHazardous air pollutantsActivated carbon filters

CFBs have lower NOₓ emissions naturally, but still require controls for other pollutants depending on local rules.


💸 Typical Emissions Control CAPEX (for a 100 TPH Boiler)

Control EquipmentInstalled Cost (USD)
ESP or Baghouse$2.5M – $6.5M
SNCR (Urea Injection)$800K – $2.5M
FGD or Limestone System$1.5M – $5M
CEMS (CO, NOₓ, SO₂, PM)$150K – $500K
Stack Modifications$250K – $1.2M
Total Emissions CAPEX$5M – $15M+

Capital costs for emissions control systems in CFB plants can exceed $10 million for large installations.True

Equipment like ESPs, SNCR, and FGD are complex, large-scale systems requiring significant engineering and infrastructure.


🔁 Long-Term Recurring Costs for Compliance

Cost ElementAnnual Cost Estimate (USD)Notes
Limestone/Desulfurization$100K – $600KIn-bed and post-combustion SO₂ control
SNCR Reagents (Urea/Ammonia)$80K – $400KNOₓ control varies with load & fuel
CEMS Operation & Calibration$20K – $60KStack emissions monitoring
ESP/Baghouse Maintenance$30K – $100KFilter changeouts, dust removal
Annual Stack Testing$10K – $50KRequired for permits
Permitting & Reporting$10K – $30KLegal & environmental compliance

For a mid-sized CFB system, emissions-related OPEX may exceed $500K to $1.5M annually.


🧪 Case Study: 100 TPH CFB Boiler Using Biomass & Petcoke

Emissions Control Configuration:

  • In-bed limestone for SO₂

  • SNCR for NOₓ

  • ESP for PM

  • CEMS for real-time tracking

Annual Compliance Costs:

  • Limestone: $280,000

  • Urea for SNCR: $180,000

  • ESP maintenance: $75,000

  • Stack sampling & permits: $35,000

  • Total Annual Cost: ~$570,000

Total 20-Year Emissions Compliance Cost:
~$11.4 million

Equals ~18% of total OPEX over plant life


📋 Factors That Increase Compliance Cost Over Time

FactorCost Driver
Tightening RegulationsRequires equipment upgrades or add-ons
High Sulfur or Ash FuelsMore reagent use, higher maintenance
Low AutomationManual monitoring increases labor cost
Poor MaintenanceMore frequent breakdowns and fines
Older CEMS TechnologyHigher recalibration and certification fees

Emissions regulations are expected to become stricter, raising long-term compliance costs for CFB boilers.True

Most countries are lowering limits on NOₓ, SO₂, PM, and CO₂, requiring better control technologies and more frequent monitoring.


📈 Strategies to Minimize Emissions Costs

StrategyExpected Savings
Fuel Blending (Low-S vs. High-S)Reduces SO₂ load and limestone use
O₂ Trim & Combustion TuningLowers CO and NOₓ output
Advanced SNCR AutomationImproves reagent dosing efficiency
ESP Pre-Dust Collection SystemsReduces filter wear and energy use
Emissions Forecasting SoftwarePrevents non-compliance before it occurs

Optimizing compliance systems can cut reagent costs by 10–25% and prevent regulatory penalties.


Summary

Emissions control and environmental compliance represent significant long-term costs for any CFB boiler operation. Capital equipment like ESPs, SNCR units, and CEMS demand millions in investment, while recurring costs—reagents, maintenance, monitoring, and reporting—can total hundreds of thousands to over $1 million annually. However, strategic system design, automation, and operational discipline can minimize compliance costs while maintaining air quality and legal adherence. In an age of rising environmental accountability, the smartest plants treat compliance not as a cost—but as a competitive advantage.
What Factors Influence Maintenance Cycles, Downtime Costs, and Spare Parts Inventory in a CFB Boiler System?

Circulating Fluidized Bed (CFB) boilers are powerful, flexible, and fuel-efficient—but they operate under extreme conditions that subject components to high abrasion, thermal cycling, and mechanical stress. As a result, maintenance frequency, unplanned downtime risk, and the need for strategic spare parts inventory become critical to the boiler’s economic viability. Every hour of downtime costs money—in lost steam output, staff labor, and missed energy savings—while poor inventory planning can delay repairs and inflate operating costs. Smart operators understand that maintenance isn’t a routine—it’s a strategic cost control function.

Maintenance cycles, downtime costs, and spare parts inventory in CFB boilers are influenced by several key factors, including fuel type and ash content, load variability, equipment wear rates, automation level, maintenance planning, and access to critical spares. High-ash or abrasive fuels increase maintenance frequency; inconsistent boiler loads cause thermal cycling and stress; and long procurement times for parts increase the need for on-site stock. Poor planning leads to extended downtime, higher labor costs, and emergency logistics expenses. Facilities that optimize maintenance strategy and inventory management typically reduce downtime by 30%–50% and avoid millions in lost output over time.

A well-maintained CFB boiler is not only more efficient—it’s far more cost predictable and profitable.

Maintenance cycle duration and downtime risk in CFB boilers depend heavily on fuel characteristics, wear patterns, and spare parts availability.True

Factors like ash content, erosion rate, refractory degradation, and supply chain delays all influence how often systems must be shut down and how long repairs take.


🔧 Key Factors Affecting Maintenance Cycles

FactorEffect on Maintenance Frequency
Fuel Ash ContentHigh ash = more erosion in cyclone, ducts
Fuel Abrasiveness (silica, fines)Wears refractory, bed nozzles
Load Cycling (start/stop)Increases thermal stress, refractory cracks
Burner & Bed WearFrequent fuel changes wear out nozzles
Combustion Air System LoadFan and duct fouling, vibration wear
Moisture Content in FuelCauses condensation, corrosion risk
Tube Fouling or SlaggingReduces efficiency, requires frequent cleaning
Instrumentation SensitivityDrift in sensors affects combustion tuning

A CFB running wet, high-ash biomass will require 3x more frequent maintenance than one using clean wood pellets.


💸 Downtime Cost Components

Downtime Cost ElementDescriptionEstimated Impact (100 TPH Plant)
Lost Steam OutputNo production during repair$10,000–$30,000/day
Labor OvertimeEmergency repair shifts$2,000–$5,000/day
Contractor MobilizationTravel, lodging for external specialists$5,000–$20,000/incident
Re-Synchronization CostsReheating, emissions spikes post-repair$2,000–$8,000
Penalty/Non-Delivery ChargesMissed steam/electricity supply targets$3,000–$50,000/event
Total Downtime Cost/Day$20,000 – $100,000+

Downtime costs escalate rapidly with every hour lost, especially in cogeneration or IPP applications with contracts.

Unexpected CFB boiler downtime can cost tens of thousands of dollars per day in lost output and contract penalties.True

The high energy value produced by large-scale boilers means that even short outages carry major financial consequences.


📦 Factors That Influence Spare Parts Inventory Strategy

FactorSpare Inventory Impact
Part Lead Time (weeks/months)Long lead times require local stocking
Part Cost (low vs. high)Expensive items often ordered on demand
Wear Frequency (high use parts)Nozzles, seals, valves must be stocked
Supplier ProximityRemote sites need deeper inventory
Custom/Proprietary PartsOEM-exclusive items need advance orders
Maintenance Schedule AlignmentBatch ordering for shutdowns saves cost
Criticality of ComponentHigh-risk parts must be available instantly

Common stocked items:

  • Bed nozzles

  • Refractory patch kits

  • Ash screws & paddles

  • Burner tips

  • Thermocouples, sensors

  • Valve seats & seals

  • Fan motor bearings


🧪 Case Study: Spare Parts Planning and Downtime Avoidance

Plant: 120 TPH CFB boiler (agro waste + petcoke blend)
Issue: Sudden refractory failure in cyclone riser
Outcome Without Stocked Parts:

  • Refractory delivery lead time: 4 weeks

  • Boiler offline: 28 days

  • Lost output value: ~$740,000

  • Penalty to power buyer: $150,000

  • Labor + contractor cost: ~$85,000

  • Total Loss: ~$975,000

After New Strategy:

  • Stocked 6 key refractory kits

  • Pre-trained local patch team

  • Future downtime reduced to 5 days

  • Total cost: ~$140,000

Inventory planning saved over $800,000 and avoided power contract breach.


📋 Maintenance Cycle Recommendations by Component

ComponentInspection IntervalTypical Replacement Interval
Cyclone LiningEvery 3–6 monthsEvery 12–24 months
Bed NozzlesEvery 6 months12–18 months
Air Fans & BearingsQuarterly1–2 years (or as needed)
Burner Tips & ValvesQuarterly1–1.5 years
CEMS & SensorsMonthly calibrationAnnual overhaul
Ash Screws & MotorsMonthly12–24 months
Economizer CleaningWeekly monitoringBiannual cleaning cycle

Use a computerized maintenance management system (CMMS) to track intervals, history, and spares.


Summary

Maintenance cycles, downtime costs, and spare parts management are core pillars of CFB boiler performance and cost control. Factors like fuel properties, operational stress, and spare part logistics shape how often systems need attention, how costly outages become, and how quickly problems can be fixed. Plants that adopt preventive maintenance schedules, prioritize critical spares, and minimize lead time dependencies avoid millions in downtime and emergency expenses. For long-term CFB efficiency, success is built not just on combustion—but on preparation.
How Can Lifecycle Cost (TCO) and Payback Period Be Accurately Estimated for CFB Boilers?

A Circulating Fluidized Bed (CFB) boiler is a complex, capital-intensive investment designed for fuel flexibility, low emissions, and long-term operation. But to make informed investment decisions—especially for utilities, IPPs, or industrial plants—owners must look beyond the purchase price and estimate Total Cost of Ownership (TCO) and payback period over the system’s expected life. Accurately calculating these financial indicators enables clear comparisons with other technologies, supports funding applications, and guides long-term budget planning.

Lifecycle cost (TCO) and payback period for a CFB boiler can be accurately estimated by summing the total capital expenditure (CAPEX), annual operating costs (OPEX), and end-of-life costs, then comparing this to projected savings or revenue generation. TCO includes all expenses over the system’s life: initial purchase and installation, fuel, maintenance, labor, consumables, emissions compliance, spare parts, and decommissioning. Payback period is calculated by dividing the total investment by the annual net savings (e.g., fuel savings vs. a legacy system). Accurate modeling requires site-specific inputs, realistic cost escalations, and conservative performance estimates.

In CFB investments, what matters isn’t what you pay upfront—but what you pay over decades of operation.

TCO and payback period analysis are essential financial tools for evaluating long-term value of CFB boiler investments.True

These metrics incorporate capital, operational, and environmental costs to provide a complete financial picture over the boiler's lifespan.


📦 Step-by-Step Lifecycle Cost (TCO) Estimation

TCO Formula (Simplified):

TCO = CAPEX + (OPEX × Operating Years) + Compliance + Decommissioning
TCO ComponentDescription
CAPEXBoiler purchase, construction, installation
OPEX (Annual)Fuel, maintenance, labor, consumables
Compliance CostsEmissions equipment + monitoring
Replacement PartsMajor components over 20–30 years
DecommissioningDisposal, site restoration, salvage

💰 Step-by-Step Payback Period Estimation

Payback Formula (Simplified):

Payback Period (years) = Total Investment / Annual Net Savings
InputTypical Values (Mid-Size CFB)
Total Investment (CAPEX)$20M – $50M
Annual Savings$2M – $8M (fuel cost vs. gas/oil)
Payback Range4 to 8 years, depending on fuel savings

Fuel flexibility (e.g., replacing oil with biomass/RDF) is the largest driver of short payback.


📉 Example: 100 TPH Biomass CFB Boiler (20-Year Projection)

Cost CategoryEstimate (USD)
CAPEX$28 million
OPEX (Avg. $1.5M/year)$30 million
Compliance Costs$12 million
Decommissioning$2 million
Total TCO (20 years)$72 million

Fuel cost savings vs. oil-fired system: ~$3.8M/year
Payback period: ~$28M / $3.8M = ~7.4 years


📊 CFB Boiler vs. Other Technologies: TCO Comparison

Boiler Type20-Year TCO (100 TPH)Notes
CFB Boiler$65M – $80MHigh CAPEX, lower fuel/emissions OPEX
Grate-Fired Boiler$55M – $70MLower CAPEX, higher emissions & fuel cost
Gas-Fired Boiler$35M – $55MLower CAPEX, volatile fuel cost
Oil-Fired Boiler$40M – $65MHigh OPEX, poor emissions compliance

CFB is ideal when fuel diversity or emissions savings offset high upfront cost.


📋 Key Inputs for Accurate TCO/ROI Modeling

InputWhy It Matters
Boiler Size & Load FactorImpacts fuel, maintenance, revenue
Fuel Type & Cost per TonBiomass, RDF, coal—all vary in cost/GCV
Efficiency (HHV Basis)Affects fuel required per MWh
Emissions Compliance ScopeImpacts CAPEX and OPEX
Annual Run HoursInfluences OPEX and asset utilization
Spare Parts & Maintenance CyclesShapes long-term reliability costs
Decommissioning AssumptionsInfluences end-of-life cost forecast

The accuracy of TCO and ROI projections for CFB boilers depends on realistic inputs and conservative performance assumptions.True

Inflated savings or underestimated OPEX can mislead decision-makers and lead to budget shortfalls.


🧪 Real-World Payback: Fuel Conversion Scenario

Company: Industrial Plant Switching from Oil to Biomass CFB

ParameterValue
Oil-fired OPEX (annual)$5.2 million
Biomass CFB OPEX (annual)$2.4 million
Annual Savings$2.8 million
CAPEX of CFB Boiler$19 million
Simple Payback~6.8 years
20-Year Savings vs. Oil$56 million

📈 Sensitivity Considerations

VariablePotential Impact on Payback/TCO
Fuel Price VolatilityIncreases savings if fossil prices rise
Regulatory Carbon CostsImproves ROI for lower-emission systems
Run Hours DecreaseLengthens payback, increases per-MWh cost
Unexpected RepairsRaises TCO unless spares/PM are strong
Efficiency DegradationAffects annual fuel cost and emissions

Summary

Calculating lifecycle cost and payback period is critical to validating the financial viability of a CFB boiler project. These metrics incorporate every relevant expense—from installation to operation and decommissioning—and compare them to savings or revenue generation. By using accurate, site-specific data and realistic modeling, operators and investors can make confident, long-term decisions. In large-scale energy systems, a well-calculated TCO is the difference between a strategic asset—and a stranded one.

🔍 Conclusion

While the upfront investment in a CFB boiler is typically higher, the system offers long-term savings through fuel flexibility, low emissions, and extended operational life. Understanding the full lifecycle costs—including installation, maintenance, and compliance—is critical to calculating return on investment. For industrial operations burning variable or low-grade fuels, a CFB boiler can offer superior cost efficiency when evaluated from a total cost of ownership perspective.


📞 Contact Us

💡 Need expert guidance on budgeting for a CFB boiler project? We offer cost modeling, fuel analysis, emissions compliance support, and full project planning services to help you invest with confidence.

🔹 Let us help you design a cost-effective, future-proof CFB boiler system tailored to your operational needs! 🔄🔥💰

FAQ

What is the average upfront cost of a circulating fluidized bed boiler?

The upfront cost for a CFB boiler ranges from $500,000 to over $5 million, depending on boiler size, steam capacity (typically 10–300 TPH), operating pressure, and required emissions controls. Installation adds $200,000–$2 million, covering infrastructure, fluidization systems, and auxiliary equipment.

How do fuel costs compare to other boiler types?

CFB boilers offer fuel flexibility, allowing use of low-cost fuels like high-ash coal, biomass, petcoke, or RDF. Fuel cost depends on the mix:

  • Coal: $40–$60/ton

  • Biomass: $30–$80/ton

  • Petcoke/RDF: $20–$50/ton
    Annual fuel expenses vary widely but can be 30–50% lower than oil or gas-fired systems for the same energy output.

What are the typical long-term maintenance costs?

Annual maintenance is 3–6% of the capital cost, reflecting the system’s complexity. Costs include:

  • Cyclone separator and bed material replacement

  • Tube erosion monitoring and repairs

  • Air and fuel system calibration
    Over a 20–25 year lifespan, maintenance totals can reach $500,000 to $1.5 million or more.

Are there any hidden or indirect costs with CFB boilers?

Yes. Consider:

  • Ash handling systems and disposal infrastructure

  • Emission control compliance (e.g., NOx, SO₂, PM filters)

  • Startup and shutdown fuel use

  • Water treatment system requirements

  • Operator training and automation software

How do CFB boilers compare in terms of lifecycle cost?

CFB boilers have higher upfront costs than traditional grate or pulverized coal boilers but offer lower fuel costs, emissions advantages, and greater operational flexibility. For plants with access to varied or low-cost fuels, CFBs deliver strong ROI and competitive total cost of ownership (TCO) over 20+ years.

References

  1. Circulating Fluidized Bed Boiler Economicshttps://www.energy.gov

  2. Fuel Cost Comparison for CFB Boilershttps://www.eia.gov

  3. Maintenance Cost and Performance Trends in CFBshttps://www.sciencedirect.com

  4. CFB Boiler Installation and Capital Planninghttps://www.researchgate.net

  5. Emission Control Costs in Fluidized Bed Combustionhttps://www.epa.gov

  6. Ash and Bed Material Handling in CFBshttps://www.bioenergyconsult.com

  7. Operational Cost Modeling for CFB Boilershttps://www.mdpi.com

  8. Boiler Lifecycle Cost Analysis Toolshttps://www.energysavingtrust.org.uk

  9. IEA Report on Advanced CFB Technologieshttps://www.iea.org

  10. ASME Standards for CFB Boiler Design and Costinghttps://www.asme.org

Andy Zhao

Senior Sales Manager
30+ boiler projects experience, focus on high-end customization, non-standard & special fuel boiler sales. Representative projects include waste heat boilers for Russian EVRAZ Steel, Coal CFB Boiler for Indonesia QMB New Energy Materials, HP drum & LP drum For Italian Nooter/Erisken, MP drum for Korean Hyundai Steel, LP drum for Korean POSCO Steel, 2 sets Air Cooling Coil for Finland Metso. Boiler Sales in Africa, Central Asia, Taiwan, etc.

Wade Zhang

CEO of Taishan Group Taian Boao International Trade Co., Ltd. 30 years experience in Global industrial boiler market,  Over 300 boiler projects experience, including 21+ EPC projects. Projects span 30+ countries & regions, involving industries such as nuclear power, energy & electricity, municipal heating, mining, textiles, tires etc.

Upfront and Long-Term Costs of a Circulating Fluidized Bed Boiler Read More »
How to Optimize Industrial Oil-Fired Boiler Performance for Lower Operating Costs

How to Optimize Industrial Oil-Fired Boiler Performance for Lower Operating Costs

Industrial oil-fired boilers are valued for their high energy density, stable performance, and quick heat delivery. However, without proper optimization, they can become fuel-intensive, emission-heavy, and costly to operate. Many facilities lose thousands annually due to inefficient combustion, poor maintenance, and underutilized heat recovery. To improve operational efficiency and profitability, it’s essential to take a systematic approach to performance optimization.

To optimize an industrial oil-fired boiler for lower operating costs, focus on improving combustion efficiency, maintaining clean heat transfer surfaces, minimizing excess air, utilizing flue gas heat recovery (e.g. economizers), and implementing predictive maintenance. Additional savings can be achieved by using high-quality fuel, adjusting load management strategies, and incorporating automation for real-time monitoring and control. Together, these measures reduce fuel consumption, lower emissions, and extend the boiler’s service life.

Here’s how to strategically improve the cost-efficiency of your oil-fired boiler system.

oil gas-fired

How Does Burner Tuning and Air-to-Fuel Ratio Adjustment Reduce Fuel Consumption?

Combustion is the heart of every biomass boiler—and just like any engine, its performance depends on precise tuning. A poorly adjusted burner wastes fuel by allowing too much air (excess oxygen) or too little (leading to incomplete combustion). Both conditions drive up fuel usage, increase emissions, and reduce efficiency. That’s why burner tuning and air-to-fuel ratio (AFR) control are essential tools for energy managers and plant engineers. Through proper tuning, consistent monitoring, and automated airflow control, facilities can reduce fuel consumption by 5%–15%, improve combustion stability, and lower maintenance costs.

Burner tuning and air-to-fuel ratio adjustment reduce fuel consumption by ensuring complete and efficient combustion. When the right amount of air is supplied relative to the fuel being burned, heat release is optimized, combustion losses are minimized, and emissions are reduced. Too much air cools the flame and carries heat out of the stack, while too little air causes unburned fuel and soot. Tuning adjusts the airflow, fuel feed, and burner performance to match load demand, fuel type, and oxygen levels. This balance lowers fuel use per unit of steam or heat produced.

If combustion is the engine, then tuning is your fuel-efficiency dial.

Air-to-fuel ratio tuning reduces fuel consumption by improving combustion efficiency and reducing stack heat losses.True

Correcting for excess air or insufficient oxygen ensures that more fuel energy is converted to usable heat.


🔥 What Is the Air-to-Fuel Ratio (AFR)?

The air-to-fuel ratio is the mass of air supplied per unit of fuel, typically expressed as:

  • Stoichiometric Ratio: Theoretical minimum air required for complete combustion

  • Excess Air: Air above stoichiometric, added to ensure full fuel burn

Biomass stoichiometric AFR (approx.):

  • Wood pellets: ~6:1

  • Wood chips (wet): ~8–9:1

  • Rice husk: ~7:1

Ideal excess air: 15–30% (actual ratio ~7–10:1 depending on fuel and moisture)

Too much air = heat wasted
Too little air = fuel wasted


📉 Effects of Improper AFR

ConditionConsequenceImpact on Fuel Use
Too Much Air (Excess O₂)Flame cooling, heat lost in flue gas5–10% fuel increase
Too Little AirIncomplete combustion, CO, soot8–15% fuel loss
Unbalanced DistributionHot spots, corrosion, emissionsBurner wear, inefficiency

Excess combustion air carries unburned heat up the stack, reducing thermal efficiency.True

Every 1% excess O₂ beyond optimal can reduce boiler efficiency by 0.5%–1%.


⚙️ Key Elements of Burner Tuning

Tuning ParameterWhat It AdjustsBenefit
Primary/Secondary Air FlowControls oxygen available at burnerOptimizes flame temperature
Fuel Feed RateMatches combustion load demandPrevents over- or underfeeding
O₂ Trim SystemAdjusts airflow based on O₂ sensorsMaintains consistent efficiency
Flame Shape and LengthBalances combustion space utilizationPrevents tube overheating or sooting
Burner Turndown RatioImproves control at part loadReduces cycling and losses

Automated tuning with PLC/SCADA ensures 24/7 optimization and faster adjustment to load changes.


🧪 Case Study: 5 TPH Biomass Boiler with O₂ Tuning

Before TuningAfter Tuning
Excess O₂: 6.8%Optimized O₂: 3.5%
Fuel Use: 2,400 tons/yearFuel Use: 2,160 tons/year
Efficiency: 73%Efficiency: 79%
Annual Savings240 tons biomass (~$19,200)

Payback on tuning system: <1 year


📋 Best Practices for Air-to-Fuel Optimization

PracticeResult
Install O₂ sensors in flue stackEnables real-time airflow adjustments
Calibrate airflow meters regularlyEnsures airflow matches readings
Check flame visuals during load changeIdentifies imbalances visually
Automate burner managementMaintains AFR under all load conditions
Track O₂ vs. fuel ratio weeklyDiagnoses trends, prevents drift

Monitoring tools like CEMS, PLC, or handheld flue gas analyzers are key to sustaining performance.


📈 AFR and Efficiency Relationship

Excess O₂ (%)Approx. Boiler Efficiency (%)
2%85–87%
4%83–84%
6%80–82%
8%77–79%
>10%<75%

Every 1% excess O₂ above optimal = ~0.5% to 1% efficiency loss


Summary

Burner tuning and air-to-fuel ratio adjustment are among the most effective and lowest-cost methods to reduce fuel consumption in biomass boiler systems. By minimizing excess air and optimizing combustion, operators can lower fuel use, increase thermal efficiency, reduce emissions, and extend component life. Whether done manually with regular checks or through automated O₂ trim systems, this process delivers fast, measurable ROI and is essential for long-term performance. For any fuel-fired system, efficient combustion starts with precise control—and ends with lower operating costs.

Why Is Cleaning Soot and Scale from Heat Exchanger Surfaces Essential for Thermal Efficiency?

In a biomass boiler system, the heat exchanger is where fuel energy becomes usable thermal energy. It transfers heat from hot combustion gases to water or steam. But over time, soot, ash, and mineral scale accumulate on these surfaces, forming insulating layers that choke off heat transfer. As these deposits grow, they reduce the boiler’s efficiency, increase fuel consumption, and raise flue gas temperatures. Without regular cleaning, these seemingly minor residues can cost thousands of dollars in wasted energy every year. Cleaning soot and scale is not just maintenance—it is a direct investment in efficiency and operating cost control.

Cleaning soot and scale from heat exchanger surfaces is essential for thermal efficiency because these deposits act as insulators that block effective heat transfer. Even thin layers of fouling reduce the rate at which combustion heat is transferred to water or steam, forcing the boiler to burn more fuel to produce the same output. Soot buildup from unburned biomass and mineral scale from water impurities can reduce efficiency by 5% to 15% or more. Regular cleaning restores optimal thermal conductivity, lowers stack temperatures, improves fuel economy, and prevents long-term damage to heat surfaces.

Neglecting fouling turns your heat exchanger into a fuel-wasting barrier.

Even thin layers of soot and scale significantly reduce heat transfer efficiency in boilers.True

Soot and scale are poor conductors of heat and form an insulating layer, requiring more fuel to achieve the same output.


🌫️ Impact of Fouling on Thermal Transfer

Deposit TypeSourceConductivity (W/m·K)Heat Transfer Impact
Soot (carbon ash)Incomplete combustion~0.1High insulating effect
Scale (calcium/silica)Hard water minerals~0.2 – 0.4Moderate to severe
Clean steel surface~45 – 55Optimal performance

Just 1 mm of soot or scale can reduce thermal conductivity by over 90%.


📉 How Fouling Affects Boiler Performance

Fouling LevelFlue Gas Temp RiseEfficiency DropFuel Use Impact
Clean TubesNormal (~180°C)0%Baseline
Light Fouling (0.5mm)+20°C-2–4%+3–5%
Moderate (1mm)+40°C-6–8%+7–10%
Severe (2mm+)+80°C-10–15%+10–20%

Fouled heat exchanger surfaces force boilers to use more fuel for the same thermal output.True

Insulation from deposits reduces heat transfer, requiring more combustion energy to reach target steam or water temperatures.


🧪 Case Study: 5 TPH Biomass Boiler with Soot Buildup

Symptoms:

  • Stack temperature rose from 180°C to 240°C

  • Fuel consumption increased by 12%

  • Combustion stable, but efficiency dropped

Intervention:

  • Conducted tube cleaning via soot blower

  • Removed ~1.5mm soot layer

  • Restored stack temp to 180°C

  • Recovered ~10.5% thermal efficiency

Annual fuel savings after cleaning: ~$28,000


🧹 Recommended Cleaning Practices

Cleaning MethodApplicationFrequency
Soot Blowing (manual/auto)Removes ash and unburned carbonDaily to weekly
High-pressure Water JettingRemoves scale and residueMonthly to quarterly
Chemical DescalingDissolves hard mineral scaleQuarterly to yearly
Mechanical Rod CleaningTube brushing or scrapingAnnually or during shutdown
Flue Path VacuumingPrevents fly ash recirculationAs needed

Cleaning intervals depend on fuel type, ash content, and boiler run time.


📋 Signs That Indicate the Need for Cleaning

  • Rising stack temperature despite constant load

  • Decrease in steam output or pressure

  • Increase in fuel consumption per MWh

  • Visible black soot around burner or tubes

  • Alarms from flue gas analyzers or CEMS

Regular soot and scale cleaning improves heat exchanger performance and extends boiler lifespan.True

Clean surfaces reduce stress on tubes, prevent hot spots, and delay component failure.


🧮 Example Efficiency Recovery from Cleaning

Fouling ThicknessEstimated Efficiency LossSavings After Cleaning (Fuel/Year)
0.5 mm~3%$5,000 – $12,000
1 mm~7%$15,000 – $25,000
2 mm~12%$30,000 – $50,000

Based on typical biomass fuel cost of $80/ton and usage of 2,500–4,000 tons/year.


Summary

Cleaning soot and scale from heat exchanger surfaces is essential for maintaining thermal efficiency in biomass boiler systems. Fouling acts as an invisible heat barrier that drives up fuel use, reduces steam output, and accelerates system wear. Regular maintenance—through soot blowing, chemical descaling, or manual brushing—can recover 5%–15% in lost efficiency and save tens of thousands of dollars per year. In the long run, a clean boiler isn’t just better for performance—it’s better for your budget. When it comes to heat exchange, clean metal saves money.

How Can Economizers and Air Preheaters Recover Waste Heat and Lower Operating Costs?

In biomass boiler systems, flue gas exits the combustion chamber at 180°C to 300°C or more, carrying with it massive amounts of unused thermal energy. Without recovery systems, this energy literally vanishes up the stack—wasting fuel and raising operating costs. Enter economizers and air preheaters, two proven technologies that capture this waste heat and reuse it within the system. The result? Lower fuel consumption, higher boiler efficiency, and faster payback.

Economizers and air preheaters recover waste heat from flue gases by transferring it to feedwater and combustion air, respectively. An economizer reduces the amount of fuel needed to heat water to steam by preheating the feedwater using exhaust gas heat, while an air preheater increases combustion efficiency by warming incoming air. Together, these devices can improve boiler efficiency by 5%–10% and cut fuel use by 8%–15%, significantly reducing operating costs. These savings can amount to tens of thousands of dollars annually depending on boiler size, runtime, and fuel type.

In biomass systems, economizers and preheaters are not upgrades—they are fuel-saving essentials.

Economizers and air preheaters can recover up to 20% of waste heat in biomass boiler systems.True

They capture thermal energy from flue gas and redirect it into feedwater and combustion air, improving efficiency and lowering fuel demand.


🔁 How Each System Works

DeviceRecovery TargetResulting Benefit
EconomizerPreheats feedwaterReduces fuel needed to generate steam
Air Preheater (APH)Warms combustion airEnhances fuel-air mixing, improves flame stability
Combined UseCaptures max flue heatBoosts efficiency up to 10%

Economizers operate at the boiler’s back-end, while air preheaters sit before the burner fan intake.


📉 Fuel Savings by Waste Heat Recovery

Boiler Capacity (TPH)Fuel Saved (%)Annual Fuel Cost Reduction (USD)
2 TPH6–8%$12,000 – $18,000
5 TPH7–10%$25,000 – $40,000
10 TPH8–12%$50,000 – $80,000
20 TPH10–15%$100,000 – $150,000

Based on wood chip biomass at $80/ton, 6,000 operating hours/year.


🧪 Case Study: 5 TPH Biomass Boiler with Flue Heat Recovery

Initial Conditions:

  • Flue gas temp: 240°C

  • Stack loss: ~18%

  • Feedwater temp: 65°C

After Installing Economizer + APH:

  • Feedwater temp increased to 95°C

  • Combustion air temp increased to 120°C

  • Flue gas temp reduced to 150°C

  • Fuel savings: 9.2%

  • Annual cost reduction: ~$32,000

  • Payback: < 2 years


📋 Performance Gains from Each Device

SystemEfficiency Gain (%)Typical Temp Change
Economizer3–6%+25–40°C to feedwater
Air Preheater2–4%+30–70°C to air
Combined Effect5–10%Flue temp drop ~80–120°C

Each °C drop in stack temperature = ~0.3–0.5% gain in thermal efficiency.

Lowering flue gas temperature with heat recovery systems directly increases boiler thermal efficiency.True

Less heat wasted means more energy converted to useful steam, reducing fuel consumption.


📊 Economizer & APH Cost vs. Savings

SystemInstalled Cost (USD)Annual Savings (USD)ROI Period
Economizer$50,000 – $200,000$15,000 – $80,0001–3 years
Air Preheater$40,000 – $150,000$10,000 – $60,0001–4 years
Combined$90,000 – $350,000$25,000 – $130,0001–3 years

ROI improves with boiler size, fuel price, and run hours.


🔧 Design & Integration Considerations

FactorDesign Impact
Flue Gas CompositionHigh ash or acid gases may corrode tubes
Fuel Type (e.g. wet chips)May require corrosion-resistant alloys
Water ChemistryImpacts scaling risk in economizer
APH PlacementMust match combustion fan location
Maintenance AccessNeeds soot blowing ports or wash access

For high-ash fuels, ASH FOULING CONTROL is crucial for reliability.


Summary

Economizers and air preheaters are core technologies for reducing waste and improving energy use in biomass boiler systems. By capturing flue gas heat and redirecting it to feedwater and combustion air, these devices improve efficiency by 5%–10% or more and deliver strong ROI through reduced fuel consumption. They also lower stack temperatures, reduce emissions, and stabilize combustion. In biomass-fired plants where margins matter, heat recovery isn’t an accessory—it’s a necessity. Investing in these systems ensures your boiler burns smarter, cleaner, and more cost-effectively for years to come.

WNS Oil Gas (7)

What Role Does Regular Maintenance and Inspection Play in Preventing Performance Loss?

Biomass boiler systems operate under high thermal, mechanical, and chemical stress. From ash buildup in heat exchangers to corrosion in feedwater lines and sensor drift in control systems, every operating hour exposes the system to gradual wear and fouling. Without regular maintenance and inspection, small inefficiencies compound into serious performance loss, higher fuel usage, unexpected shutdowns, and expensive repairs. Preventive maintenance ensures the system stays clean, calibrated, and compliant—delivering maximum thermal output at minimum cost.

Regular maintenance and inspection prevent performance loss in biomass boilers by addressing fouling, mechanical wear, fuel feeding inconsistencies, sensor drift, and ash buildup before they escalate into system failures. Scheduled cleaning, calibration, lubrication, and visual checks maintain combustion stability, protect thermal efficiency, and ensure emissions compliance. Facilities that implement preventive maintenance can maintain up to 95% of original system performance, while poorly maintained systems can lose 10%–25% efficiency within a few years.

If efficiency is the goal, maintenance is the guarantee.

Preventive maintenance keeps biomass boiler systems operating near peak efficiency and reduces unplanned downtime.True

Scheduled cleaning, inspection, and part servicing prevent buildup and breakdowns that degrade performance and increase fuel use.


🔁 Key Areas Affected by Neglected Maintenance

System ComponentRisk When UnmaintainedImpact on Performance
Heat Exchanger SurfacesSoot/scale buildup5–15% drop in heat transfer
Fuel Feeding SystemBlockages, belt wearInconsistent combustion
Burner & Airflow FansMisalignment, dust cloggingUnstable flame, excess air
Ash Handling SystemOverflow, motor jammingShutdowns, operator delays
Sensors (O₂, temp, pressure)Drift, failureIncorrect air-fuel ratio
Water Treatment SystemScaling, corrosionTube damage, poor efficiency

Even minor fouling or miscalibration can lead to 5%–10% efficiency loss and unexpected downtime.


🧪 Case Study: Maintenance Impact on a 4 TPH Biomass Boiler

Situation:

  • Annual steam production dropped by 12%

  • Fuel consumption rose 14%

  • Operators noticed longer warm-up time and increased ash

Inspection Findings:

  • Economizer blocked by soot

  • Fuel feeder chain stretched

  • O₂ sensor out of calibration

  • Ash bin overflowing

After Full Maintenance:

  • Steam output restored

  • Fuel savings: ~$24,000/year

  • Downtime reduced by 80%

  • ROI of maintenance overhaul: <6 months

Ignoring small maintenance issues in biomass boilers leads to cascading performance losses.True

Blocked exchangers, clogged feeders, and miscalibrated sensors amplify each other’s impact on system efficiency.


🔍 Recommended Maintenance and Inspection Schedule

Maintenance ActivityFrequencyMethod or Tool
Soot blowing (auto/manual)Daily to weeklySteam/air lances
Tube visual inspectionMonthlyBoroscope or manual check
Fan & blower serviceMonthly to quarterlyClean blades, check motor
Sensor calibration (O₂, temp)MonthlyHandheld meter or CEMS
Fuel conveyor alignment checkWeeklyVisual + load balance
Ash bin level monitoringDailyManual or level switch
PLC & alarm system testQuarterlySimulate fault triggers
Water chemistry testDaily to weeklypH, TDS, hardness kits

A preventive plan with daily, weekly, monthly, and annual tasks minimizes long-term performance erosion.


📉 Performance Loss from Deferred Maintenance

Delay PeriodExpected Efficiency Loss (%)Downtime Risk
3–6 months2–5%Low
6–12 months5–10%Moderate
1–2 years10–20%High
2+ years15–25%+Very high

Performance degradation accelerates over time without maintenance—and recovery becomes more costly.


📋 Maintenance ROI vs. Repair Cost

Maintenance TypeAnnual Cost (USD)Prevented IssuesSavings Value
Routine tube cleaning$10,000 – $30,000Efficiency loss, overheating$20,000+/year
Fan motor service$5,000 – $10,000Vibration, poor airflow, shutdowns$15,000+
Sensor calibration$2,000 – $6,000Incorrect AFR, emissions violations$10,000 – $30,000
Ash handling upkeep$5,000 – $12,000Blockages, manual labor delays$8,000 – $20,000

Regular maintenance offers 3x to 10x return on investment by avoiding system underperformance and downtime.


Summary

Regular maintenance and inspection are non-negotiable for biomass boiler systems seeking optimal thermal efficiency, fuel economy, and equipment longevity. From soot blowing to sensor calibration, proactive upkeep ensures your system operates like it was designed to—not 10% slower and 15% more costly. Facilities that commit to a structured maintenance plan experience fewer failures, higher efficiency, and reduced fuel costs, often saving thousands annually. In biomass combustion, maintenance isn’t a cost—it’s your best insurance against performance loss.

How Does Fuel Quality and Preheating Affect Combustion Stability and Emissions?

In biomass combustion systems, fuel isn’t just a heat source—it’s the foundation of combustion behavior. Fuel with inconsistent size, high moisture content, or low energy value disrupts flame stability, increases smoke and unburned gases, and accelerates fouling. Poor-quality biomass leads to inefficient burns, volatile emissions, and erratic load control. However, when fuel is well-prepared and preheated—whether naturally (via storage) or through mechanical or thermal aids—it burns cleaner, more completely, and more efficiently. That’s why fuel quality and preheating are critical levers in ensuring combustion stability and environmental compliance.

Fuel quality and preheating affect combustion stability and emissions by determining how consistently, efficiently, and completely biomass burns. High-moisture or variable fuels reduce flame temperature and increase incomplete combustion, leading to higher carbon monoxide (CO), unburned hydrocarbons, soot, and particulate matter (PM). Preheating the fuel—by drying or using warm air—improves ignition, maintains stable flame propagation, and reduces emissions. Consistent particle size, low ash content, and controlled moisture (ideally below 20%) are key to achieving stable combustion and low pollutant output in biomass boilers.

When the fuel is right and preheated, combustion is clean, stable, and efficient—but when it isn’t, costs rise and emissions spike.

Fuel quality and moisture content are key factors influencing biomass combustion stability and emission performance.True

Inconsistent or wet fuels result in unstable flames, higher unburned gases, and increased emissions.


🌿 Fuel Quality Parameters That Impact Combustion

ParameterIdeal RangeEffect if Poor Quality
Moisture Content< 20% (target 10–15%)Delayed ignition, low flame temp, high CO
Particle Size Uniformity10–50 mm chips or ≤10 mm pelletsUnstable feed rate, fluctuating burn
Bulk Density≥ 180 kg/m³ (pellets ~650)Affects feed system consistency
Ash Content< 3–4% for most fuelsFouling, slagging, high PM
Volatile Matter60–80%Supports stable flame if balanced
Calorific Value15–18 MJ/kg (dry)Influences boiler capacity/output

Biomass with moisture >30% may reduce combustion efficiency by 10% or more, raising fuel consumption and emissions.


🔥 Effects of Preheating Biomass Fuel

Preheating MethodWhat It ImprovesResulting Benefit
Mechanical Drying (rotary drum, belt dryer)Lowers moisture to <15%Stable combustion, lower CO
Combustion Air PreheatingRaises flame temp by 50–100°CEnhances ignition and efficiency
Warm Storage (covered sheds)Uses ambient heat to reduce wetnessReduces drying load in furnace
Indirect Heat RecoveryUses economizer heat to dry fuelImproves boiler thermal efficiency

Preheating helps ensure steady flame propagation, even with marginal fuels.

Preheating biomass fuel reduces moisture content and improves combustion stability and flame quality.True

Dry fuel ignites more quickly and burns more evenly, lowering carbon monoxide and particulate emissions.


📉 Impact of Moisture on Combustion Efficiency and Emissions

Moisture LevelEfficiency DropCO/PM Emissions IncreaseFuel Usage Increase
10–15%BaselineNormal
20–25%-3% to -5%+15–20%+5–8%
30–35%-6% to -9%+30–50%+10–12%
>40%-10%++70%++15–20%

For every 10% rise in moisture, expect ~2–4% efficiency loss and significantly higher CO and PM levels.


🧪 Case Study: Fuel Drying in a 3 TPH Biomass Boiler

Before Drying:

  • Moisture content: 35%

  • Efficiency: 70%

  • CO: 350 ppm

  • Fuel consumption: 3,800 tons/year

After Pre-Drying to 15%:

  • Efficiency: 81%

  • CO: 110 ppm

  • Fuel consumption: 3,200 tons/year

  • Fuel savings: 600 tons/year (~$48,000)

  • Emissions compliance passed without retrofitting


📋 Best Practices for Managing Fuel Quality

PracticeResulting Benefit
Use screened, dry wood chipsImproves flow and combustion balance
Store fuel in dry, covered areaReduces moisture pickup
Install moisture metersEnables fuel batch sorting
Blend fuels for consistencySmooths volatility, maintains stable flame
Integrate fuel pre-dryerMaximizes value from high-moisture sources

Dry, uniform biomass fuel leads to cleaner combustion and lower regulatory risk.True

Lower moisture and consistent size reduce unburned emissions, improve burner stability, and reduce fouling.


Summary

Fuel quality and preheating are foundational to efficient, clean biomass combustion. High moisture, variable particle sizes, and inconsistent energy values degrade flame stability, lower efficiency, and increase emissions. Preheating through drying systems or combustion air warming significantly improves ignition, flame uniformity, and pollutant reduction. Facilities that manage fuel quality and drying properly see lower fuel use, stable operation, and cleaner stack emissions. In every successful biomass boiler, good fuel is half the combustion—and preheating unlocks its full value.

How Can Automation and Real-Time Monitoring Improve Long-Term Cost Control?

In modern biomass boiler systems, manual oversight alone isn’t enough to ensure peak performance. Variations in fuel quality, load demand, and combustion conditions can shift efficiency and emissions in real time. Without automated responses and continuous data insights, these fluctuations lead to higher fuel use, increased wear, missed efficiency opportunities, and regulatory risks. That’s where automation and real-time monitoring come in. These technologies enable proactive control, reducing fuel waste, improving uptime, and unlocking long-term cost savings through smarter operations.

Automation and real-time monitoring improve long-term cost control by optimizing combustion efficiency, preventing unplanned downtime, reducing labor costs, and enabling predictive maintenance. Automation systems (like PLCs, DCS, and SCADA) adjust air-to-fuel ratios, fuel feed rates, and ash removal in response to real-time sensor feedback. Monitoring tools track key parameters—flue gas temperature, oxygen levels, steam output, and equipment health—so operators can respond instantly or program automatic corrections. Over time, this reduces fuel consumption by 5–15%, extends equipment life, lowers emissions penalties, and minimizes maintenance surprises.

Without automation, you’re driving a boiler blind. With it, you’re saving fuel, avoiding breakdowns, and staying compliant.

Real-time monitoring and automation reduce operating costs by maintaining optimal efficiency and minimizing downtime.True

Sensors and control systems detect performance changes instantly, enabling automatic adjustments that reduce waste and avoid costly failures.


🔁 Core Automation Functions and Cost Benefits

FunctionAutomation RoleCost Control Impact
Combustion Control (O₂ trim)Balances air and fuel feed5–10% fuel savings
Fuel Feed RegulationMatches feed to steam demandPrevents overburn, fuel waste
Soot Blower ActivationAuto-cleaning based on ΔT or runtimeMaintains efficiency, reduces labor
Ash Handling AutomationAvoids overflow and blockagesPrevents shutdown, lowers manpower
Boiler Load ModulationMatches capacity to demandAvoids short-cycling and fuel loss
Safety Alarms & InterlocksPrevents unsafe operationAvoids damage, reduces liability

Automating these tasks ensures that system behavior adjusts as conditions change, rather than reacting late or inconsistently.


📉 Long-Term Operating Cost Comparison

Operation TypeManual/Minimal AutomationFull Automation & Monitoring
Fuel UseHigh variability (+8–15%)Optimized (baseline or better)
Downtime3–6% unplanned/year<1% with predictive tools
Labor IntensityHighLower (fewer reactive tasks)
Emissions ComplianceManual testingReal-time assurance
Maintenance CostsReactive, highPredictive, lower
Data InsightPaper logsReal-time dashboards

Facilities using real-time analytics and auto-tuning report 10–25% reduction in annual OPEX.


🧪 Case Study: 5 TPH Biomass Boiler with SCADA + PLC Upgrade

Before Automation:

  • Stack O₂ fluctuated 6–9%

  • Frequent operator interventions

  • 5 unplanned shutdowns/year

  • Fuel use: 4,200 tons/year

After Automation:

  • Stack O₂ maintained at 3.5% ± 0.2%

  • No unplanned shutdowns in 12 months

  • Fuel use: 3,750 tons/year

  • Fuel savings: ~$36,000/year

  • Downtime loss avoided: ~$18,000/year

  • ROI on system: <1.8 years


📋 Key Monitoring Parameters for Real-Time Cost Control

ParameterSensor Type/SourceCost-Linked Insight
Flue Gas TemperatureStack thermocoupleDetects fouling or efficiency loss
Oxygen (O₂)Zirconia sensor or CEMSAdjusts air-to-fuel ratio
Steam Output (TPH)Flow transmitterTracks demand/load response
Combustion Air FlowPitot or mass flow meterBalances burner operation
Feedwater TemperatureRTD in economizer outletIndicates recovery system health
Motor VibrationVibration sensorsPredicts bearing or fan failure
Differential PressureBaghouse or economizerFlags clogging or soot buildup

Real-time monitoring of temperature, oxygen, and pressure improves combustion tuning and early fault detection.True

These parameters directly affect fuel efficiency, heat recovery, and system integrity.


📈 Software and Tools That Support Monitoring

Tool/SystemFunctionalityBenefit
SCADA (Supervisory Control)System-wide visualization, trendingCentralized decision-making
PLC (Programmable Logic Controller)Automated control loopsFast reaction, minimizes drift
CEMS (Continuous Emissions Monitor)Real-time emissions reportingEnsures compliance, avoids fines
Data HistorianStores years of data for trendsPredictive modeling, audits
Predictive Maintenance SoftwareAlerts before component failureLowers long-term maintenance costs

Integration enables automated tuning, real-time alerts, and visual KPIs that guide operators and managers alike.


Summary

Automation and real-time monitoring aren’t just conveniences in biomass boiler operations—they are strategic tools for cost control, risk reduction, and efficiency assurance. By continuously tracking and adjusting air-fuel ratios, combustion dynamics, and system health, automated systems keep boilers operating at peak performance. The result is less fuel wasted, fewer breakdowns, lower emissions, and more informed decisions. For plant managers and engineers, investing in automation means trading guesswork for precision—and cutting costs with every clean, optimized burn. In the long run, smart control is smart economics.

🔍 Conclusion

Optimizing an industrial oil-fired boiler is about balancing combustion, heat recovery, maintenance, and monitoring. By focusing on fuel efficiency, flue gas management, and predictive diagnostics, companies can significantly reduce fuel costs, improve emissions performance, and ensure stable operation. With proper optimization, your boiler becomes not just a heat source—but a high-efficiency, low-cost energy solution.


📞 Contact Us

💡 Need expert help optimizing your oil-fired boiler system? Our engineers provide combustion tuning, maintenance planning, and energy efficiency consulting tailored to industrial oil-fired boilers.

🔹 Contact us today and unlock the full cost-saving potential of your oil-fired boiler system! 🛢🔥📉

FAQ

What are the best ways to optimize an industrial oil-fired boiler?

To maximize efficiency and minimize costs:

  • Perform regular burner tuning

  • Maintain correct air-to-fuel ratio

  • Install oxygen trim systems

  • Clean heat exchanger surfaces and remove soot

  • Use economizers for heat recovery

  • Schedule routine inspections and maintenance

How does combustion control reduce operating costs?

Efficient combustion ensures complete fuel burn and reduces waste. Installing oxygen trim or flue gas analyzers enables real-time adjustment of the air-fuel mix, improving combustion efficiency by 3–5% and lowering fuel use.

Why is burner tuning critical for oil-fired boilers?

Oil burners require periodic adjustment to prevent incomplete combustion and minimize unburnt fuel, smoke, and soot. A well-tuned burner maintains flame stability, reduces emissions, and improves heat output per gallon of fuel.

Can heat recovery systems improve efficiency in oil-fired boilers?

Yes. Economizers recover heat from flue gases to preheat feedwater, increasing efficiency by 5–8%. Condensing heat exchangers can further boost savings, especially in lower-temperature return systems.

What maintenance practices reduce long-term operating costs?

  • Remove soot buildup from tubes to restore heat transfer

  • Check and replace nozzles, gaskets, and filters

  • Monitor stack temperature and flue gas composition

  • Inspect refractory linings and combustion chamber integrity
    Proactive maintenance extends equipment life and ensures consistent efficiency.

References

  1. Boiler Efficiency Improvement Guidehttps://www.energy.gov

  2. Combustion Optimization for Oil Burnershttps://www.sciencedirect.com

  3. Flue Gas and Oxygen Trim Controlshttps://www.researchgate.net

  4. Oil-Fired Boiler Maintenance Best Practiceshttps://www.epa.gov

  5. Economizers and Heat Recovery in Boilershttps://www.bioenergyconsult.com

  6. Air-to-Fuel Ratio Tuning in Industrial Systemshttps://www.mdpi.com

  7. Boiler Performance Monitoring Toolshttps://www.automation.com

  8. Efficiency Trends in Oil-Fired Boilershttps://www.iea.org

  9. Industrial Boiler TCO Reduction Strategieshttps://www.energysavingtrust.org.uk

  10. ASME Guidelines on Boiler Efficiencyhttps://www.asme.org

Wade Zhang

CEO of Taishan Group Taian Boao International Trade Co., Ltd. 30 years experience in Global industrial boiler market,  Over 300 boiler projects experience, including 21+ EPC projects. Projects span 30+ countries & regions, involving industries such as nuclear power, energy & electricity, municipal heating, mining, textiles, tires etc.

How to Optimize Industrial Oil-Fired Boiler Performance for Lower Operating Costs Read More »

Upfront and Long-Term Costs of an Industrial Biomass Boiler

Upfront and Long-Term Costs of an Industrial Biomass Boiler

Industrial biomass boilers are increasingly adopted for their renewable fuel usage, carbon neutrality, and potential cost savings. However, investing in a biomass boiler involves more than just the equipment price. Without a full understanding of the upfront and long-term costs, companies may face budget overruns, unexpected operational expenses, or inefficient system performance. A well-informed investment requires analyzing both the capital expenditure and the total cost of ownership (TCO) over the boiler’s lifecycle.

The upfront costs of an industrial biomass boiler include the equipment purchase, installation, site preparation, fuel storage and handling systems, emissions controls, and permitting. Long-term costs involve fuel sourcing and transportation, ash disposal, regular maintenance, equipment cleaning, emissions monitoring, and operator training. While fuel costs are often lower than fossil fuels, maintenance and logistics are typically higher. Over a lifespan of 15–25 years, a properly optimized biomass boiler can deliver competitive energy at a lower environmental cost—if lifecycle costs are carefully managed.

Here’s a breakdown of the key financial components to help you make a cost-effective investment.

Biomass boiler(5)

What Are the Typical Upfront Costs of Purchasing and Installing a Biomass Boiler?

Biomass boilers are a popular choice for facilities seeking renewable heat or steam generation using wood chips, pellets, agricultural waste, or other organic materials. However, the transition to biomass involves more than just the boiler unit—it requires specialized fuel handling, combustion, ash disposal, emissions controls, and civil works. This makes the upfront cost higher than traditional fossil-fueled boilers. Understanding these capital costs helps businesses, industries, and institutions accurately plan energy investments and assess long-term feasibility.

The typical upfront cost of purchasing and installing a biomass boiler ranges from $350,000 to over $5 million depending on capacity, automation level, emissions compliance, and supporting infrastructure. Small-scale systems (100–500 kW thermal) cost between $350,000 and $750,000 installed, while mid-scale commercial and industrial systems (1–5 MW or 1.5–7.5 TPH) range from $1.2 to $3.5 million. Large biomass CHP plants or district heating boilers (10+ TPH) can exceed $5 million when including fuel storage, feeding systems, ash handling, and flue gas treatment.

Choosing biomass means budgeting not just for energy—but for a complete sustainable energy ecosystem.

Biomass boiler installations require higher upfront costs due to complex fuel logistics and emissions controls.True

Systems must accommodate bulk fuels, ash disposal, and air quality standards, increasing overall capital requirements.

🔧 Typical Upfront Cost Breakdown for Biomass Boiler Projects

System ComponentCost Range (USD)% of Total Cost
Boiler Unit (Grate/FBC)$200,000 – $2,500,00025–40%
Fuel Storage and Conveying System$80,000 – $600,00010–20%
Combustion & Control System$50,000 – $300,0005–10%
Ash Handling System$40,000 – $300,0005–8%
Emission Control Equipment (cyclone, baghouse, scrubber)$100,000 – $800,00010–20%
Water Treatment (if steam plant)$50,000 – $250,0003–6%
Piping, Civil Works, Foundations$150,000 – $600,00010–15%
Automation, PLC/SCADA Integration$30,000 – $200,0003–5%
Installation & Commissioning Labor$100,000 – $500,00010–15%

Total Installed Cost (Small to Medium Scale):

  • 100–500 kWth: $350,000 – $750,000

  • 1–5 MWth (1.5–7.5 TPH): $1.2M – $3.5M

  • 10+ MWth (10+ TPH): $4.5M – $7.5M+

Upfront costs for biomass boilers are significantly influenced by fuel type and storage automation.True

Bulkier fuels like wood chips require more robust feeding systems than pellets, increasing cost.

📉 Cost Comparison: Biomass vs. Other Boiler Types

Boiler TypeInstalled Cost per MWthMain Cost Drivers
Gas-Fired Boiler$250,000 – $500,000Simple burner, low emissions equipment
Oil-Fired Boiler$400,000 – $700,000Burner and tank systems
Coal-Fired Boiler$700,000 – $1.2MFuel and ash handling + emissions control
Biomass Boiler$900,000 – $1.5MFuel logistics, ash, emissions compliance

Although biomass has higher upfront costs, fuel cost savings and environmental compliance advantages may yield better ROI in the long run.

🧪 Case Study: 3 TPH Biomass Boiler for Food Processing Plant

Project Details:

  • Output: 3 TPH saturated steam

  • Fuel: Rice husk and wood chips

  • 6,000 operating hours per year

Cost Breakdown:

  • Boiler system (grate type): $800,000

  • Fuel handling + bunker: $250,000

  • ESP and cyclone dust collector: $400,000

  • Ash system: $80,000

  • Civil works + piping: $320,000

  • Commissioning: $150,000

  • Total Installed Cost: ~$2 million

Compared to oil-fired alternative: $1.2 million installed
Estimated fuel savings/year: $210,000
Simple Payback: ~3.8 years

Fuel savings from biomass systems can offset higher capital investment in under 5 years for high-use applications.True

Biomass fuels are cheaper and more stable in price than fossil fuels, leading to strong long-term financial returns.

📋 Cost Factors That Influence Capital Budget

FactorInfluence on Cost
Fuel Type (chips vs. pellets)Bulkier fuels = more storage and feeding gear
Fuel Moisture ContentWet fuels need larger combustion chambers
Emission Standards (SOx, NOx)Stricter rules = baghouses or scrubbers
System Automation LevelFull PLC/SCADA control adds upfront cost
Onsite Space ConstraintsTight sites raise civil and layout costs

A well-scoped project balances performance needs with compliance and layout realities.

Summary

Biomass boiler systems require higher upfront investment than conventional boilers due to their complex fuel logistics, ash disposal, and emissions control requirements. Installed costs for small to medium systems typically range from $350,000 to over $3 million, with larger plants exceeding $5 million. While the capital outlay is substantial, long-term fuel savings and regulatory incentives often offset the initial expense within 4–7 years. When budgeting for biomass, it’s not just about buying a boiler—it’s about building a sustainable thermal system that can support your operation for decades.

How Do Fuel Storage, Conveyor, and Ash Handling Systems Add to Capital Cost?

In a biomass boiler system, the core boiler unit is just one part of the infrastructure. Fuel logistics and ash disposal play an equally important role—especially given the volume, weight, and variability of solid biofuels like wood chips, pellets, rice husks, or agricultural waste. These systems must be robust, automated, and tailored to the specific fuel and combustion characteristics. As a result, fuel storage silos, conveyors, feeders, and ash handling systems can add 20% to 40% to the total installed capital cost—and more in some configurations.

Fuel storage, conveyor, and ash handling systems significantly add to the capital cost of biomass boiler installations because they require durable mechanical equipment, automation, safety controls, and civil infrastructure. Fuel systems must accommodate variable moisture, bulk density, and flow characteristics, while ash systems must manage abrasive, high-temperature residues. Depending on fuel type and boiler capacity, these support systems can cost $300,000 to over $1.5 million, representing 20%–40% of total project cost. Their design also affects operational efficiency, labor needs, and safety.

Biomass isn’t just burned—it must be stored, moved, and managed efficiently, and that comes with substantial capital implications.

Biomass boiler support systems for fuel and ash handling often account for up to 40% of the total installed cost.True

These systems are required to move, meter, and dispose of large volumes of solid fuel and ash safely and reliably.

🧱 Breakdown of Fuel & Ash System Components and Their Costs

System ComponentPurposeTypical Cost Range (USD)% of Total Capex
Fuel Storage (silos/bunkers)Stores wood chips, pellets, or husks$80,000 – $600,00010–15%
Fuel Feeding ConveyorsTransports biomass to boiler$50,000 – $300,0005–10%
Automatic Fuel MeteringRegulates feed rate based on load/temperature$30,000 – $150,0003–5%
Ash Conveyors (bottom/fly)Moves hot ash to silo or bin$40,000 – $250,0004–7%
Ash Silo/Storage SystemCollects and stores ash before disposal$30,000 – $200,0003–5%
Ash Cooling or QuenchingReduces temperature for handling safety$20,000 – $80,0001–3%
Dust Control SystemsPrevents airborne particulate from conveyors$25,000 – $100,0002–4%

Total Additional Capital Range (Mid-Sized System): $300,000 – $1.5 million+

These are non-optional systems, especially for high-capacity or continuously operated biomass plants.

📊 Example Project Cost Breakdown: 3 TPH Biomass Boiler (Wood Chip)

ComponentInstalled Cost (USD)% of Total Cost
Boiler + Burner$800,00040%
Fuel Storage + Feed System$360,00018%
Ash Handling System$180,0009%
Emission Control$350,00017%
Civil + Installation + SCADA$330,00016%
Total CapEx$2.02 million100%

Support systems account for 27% of this total.

Fuel and ash logistics in biomass systems require high-capacity, reliable mechanical components and custom design.True

Biomass is variable and bulky, requiring larger, more robust handling systems than liquid or gas fuels.

⚠️ Key Design Factors That Affect System Cost

FactorHow It Increases Cost
Fuel Type (chips vs. pellets)Chips need larger conveyors, anti-bridging feeders
Storage Automation (silos vs. manual tipping)Silos with automatic extraction cost more but reduce labor
Fuel Moisture & FlowabilityWet or sticky fuels require special conveyor design
Continuous OperationRedundant conveyors and larger ash bins needed
Indoor vs. Outdoor StorageCovered fuel bunkers or weatherproofing required
Ash Volume (high-ash fuels)More robust disposal systems and increased storage

🧪 Case Study: Agricultural Plant Using Rice Husk

System Capacity: 2 TPH
Fuel: Rice husk (low density, high ash)
Fuel Storage: Horizontal covered bunker, 100 m³
Conveyor: Inclined belt with screw feeder to furnace
Ash Handling: Dual-screw cooled system with bagging station
Costs:

  • Fuel handling system: $290,000

  • Ash system: $170,000

  • Boiler & core: $650,000

  • Total Installed CapEx: $1.35 million

  • Support systems = ~34% of total cost

📋 Best Practices to Optimize Cost of These Systems

StrategyCost Benefit
Design for modularityEasier upgrades and future scaling
Select fuel with low ashReduces ash handling system requirements
Optimize layout (shorter conveyors)Less infrastructure and energy use
Automate feeding but monitor usageReduces labor cost, improves consistency
Choose dual-function silos (storage + metering)Saves space and component cost

Fuel and ash systems must be scaled to match boiler size, fuel type, and expected runtime.True

Improper sizing leads to frequent blockages, wear, and downtime—impacting both OPEX and efficiency.

Summary

Fuel storage, conveyor, and ash handling systems significantly increase the capital cost of a biomass boiler installation—often by $300,000 to over $1.5 million, depending on system size, automation, and fuel type. These systems are vital for feeding the boiler reliably and disposing of ash safely. Underinvesting in them leads to operational headaches, inefficiency, and higher long-term maintenance. When planning a biomass project, remember: your system is only as reliable as your fuel and ash logistics—and they must be budgeted and built to last.

Biomass boiler(13)

What Are the Recurring Fuel, Logistics, and Operating Expenses Over Time for Biomass Boiler Systems?

Biomass boiler systems may offer long-term savings and sustainability benefits, but their recurring operating expenses are multifaceted. These include not only fuel procurement but also logistics, labor, maintenance, and system efficiency losses. Unlike liquid fuels, biomass is a bulky, solid, and sometimes moisture-laden fuel that must be stored, conveyed, metered, and combusted efficiently. These realities translate into ongoing costs that can rival or even surpass fossil fuel systems if not properly managed.

Recurring fuel, logistics, and operating expenses for biomass boiler systems typically range from $50 to $120 per MWh of thermal energy produced, depending on fuel type, boiler efficiency, labor structure, and automation. Annual fuel costs often make up 60% to 80% of total operating expenses, with logistics (delivery, storage, handling) contributing another 10%–20%. Maintenance, water treatment, ash disposal, and labor account for the remaining 10%–20%. For a mid-sized 2–5 TPH biomass boiler running 6,000 hours per year, total recurring costs may reach $300,000 to $750,000 annually.

Biomass is affordable fuel—but managing it is a logistics-driven, labor-sensitive process.

Fuel and logistics are the dominant recurring operating costs in biomass boiler systems.True

Due to the low energy density and bulkiness of biomass, fuel sourcing, delivery, and handling form the largest share of annual expenditures.


🔁 Annual Recurring Cost Breakdown (for 3 TPH Biomass Boiler, 6,000 hrs/year)

Cost ComponentAnnual Cost Estimate (USD)% of Total OPEX
Fuel (wood chips/pellets)$180,000 – $450,00060–75%
Fuel Delivery & Handling$30,000 – $80,00010–15%
Ash Handling & Disposal$8,000 – $25,0002–5%
Labor (operators, techs)$50,000 – $120,00010–15%
Routine Maintenance$30,000 – $60,0005–10%
Water Treatment (steam)$8,000 – $20,0002–4%
Total Operating Expense$300,000 – $750,000100%

Biomass fuel price stability helps control long-term OPEX, but logistics costs remain highly location-dependent.True

Local fuel availability and transport distance significantly affect total fuel cost per ton.


🌿 Fuel Costs Over Time: Key Variables

VariableImpact on Fuel Expense
Fuel TypePellets cost more than chips, but burn cleaner
Moisture ContentWet fuel = more tons needed per MWh
Calorific Value (GCV)Low-energy fuels require more volume
Local SourcingShorter distance = lower delivery cost
Seasonal AvailabilityPrices may rise during winter or harvest seasons

Typical Biomass Prices (Delivered):

  • Wood chips: $40–$80/ton

  • Wood pellets: $90–$150/ton

  • Agricultural residues: $30–$60/ton

At 65–80% boiler efficiency, this translates to:
$45–$110 per MWh thermal


🧪 Example: 2 TPH Biomass Boiler Using Wood Chips

ParameterValue
Operating Hours/Year6,000
Fuel Use (wood chips)~6,000 tons/year
Delivered Price$55/ton
Annual Fuel Cost$330,000
Other O&M (labor, handling)~$120,000
Total Annual Recurring Cost~$450,000

If the same boiler used pellets at $110/ton, total annual cost could rise by $330,000, showing how fuel type and sourcing dominate costs.


📋 How Logistics Affects Cost and Efficiency

Logistics ElementCost Impact
Delivery Frequency (trucks/week)More deliveries = higher transport fees
Onsite StorageLarger silos/bunkers reduce cost volatility
Fuel Handling AutomationReduces labor but raises capex
Fuel Quality ManagementCleaner fuel reduces maintenance

Fuel moisture and particle size variability can increase both logistics and maintenance expenses in biomass systems.True

Handling inconsistent biomass requires more frequent cleaning and equipment upkeep.


📈 Trends in Biomass OPEX vs. Fossil Fuels

Fuel TypeAnnual Cost StabilityEmissions Cost RiskHandling Complexity
Natural GasVolatile pricingHigh (CO₂ tax)Low
OilHigh cost, volatileHigh (CO₂ + NOx)Low
CoalModerate costVery high complianceHigh
BiomassModerate cost, stableLow (carbon neutral)High

Despite handling challenges, biomass is often favored for carbon neutrality and regulatory compliance, especially in carbon tax regions.


Summary

Biomass boiler systems may be fuel-efficient, but their total operating expenses hinge on more than just fuel cost. Logistics, moisture management, handling systems, ash disposal, labor, and maintenance all contribute to a complex cost structure. Annual recurring expenses range from $300,000 to $750,000 or more, depending on system size and automation level. To keep costs predictable and performance high, operators must optimize fuel sourcing, delivery frequency, and operational efficiency. In the biomass world, it’s not just what you burn—it’s how you manage everything around it.

How Do Maintenance, Cleaning, and Operator Training Impact Lifecycle Costs of Biomass Boiler Systems?

In biomass boiler operations, performance and cost aren’t only driven by the fuel burned—but by how well the system is cleaned, maintained, and operated over time. These “soft costs” often receive less attention than capital and fuel expenses, but they can significantly affect the Total Cost of Ownership (TCO), efficiency, downtime, and system lifespan. Poor maintenance leads to fouling, scaling, ash buildup, and premature failures, while under-trained staff can cause combustion imbalances and avoidable breakdowns. When done right, preventive maintenance, regular cleaning, and skilled operation can lower lifecycle costs by 10–30%.

Maintenance, cleaning, and operator training directly impact lifecycle costs by preventing system degradation, avoiding unplanned downtime, and sustaining high thermal efficiency. Scheduled cleaning and inspections keep heat transfer surfaces clear of soot and ash, which reduces fuel consumption and protects components. Skilled operators reduce the risk of malfunctions, optimize combustion, and detect issues early. Over a 20-year lifecycle, well-maintained and properly operated biomass boilers can save hundreds of thousands of dollars in avoided repairs, fuel waste, and labor inefficiencies.

In thermal systems, clean operation and trained oversight aren’t just best practices—they are profit protection tools.

Preventive maintenance and trained operators can lower biomass boiler lifecycle costs by up to 30%.True

They reduce repair frequency, extend component life, and minimize energy waste, which adds up significantly over decades.


🔧 Lifecycle Cost Impact by Category (20-Year View)

CategoryPoor Practice Cost (USD)Optimized Cost (USD)Potential Savings
Unplanned Repairs$800,000 – $1.2 million$300,000 – $500,000$300K – $900K
Fuel Efficiency Loss$2.5 – $3.5 million$1.8 – $2.3 million$700K – $1.2M
Component Replacement (burners, fans)$600,000 – $1M$300,000 – $600,000$300K – $400K
Downtime Production Loss$1M – $2.5 million$400,000 – $900,000$600K – $1.6M
Total Lifecycle Savings$2 – $4 million+

These savings can outweigh the cost of the boiler itself—underscoring the ROI of disciplined maintenance and training.


🧹 Importance of Cleaning and Fouling Control

Cleaning ActivityFrequencyBenefit
Tube brushing / soot removalWeekly to monthlyMaintains thermal transfer
Ash bin/silo emptyingWeeklyPrevents overflow & buildup
Cyclone/baghouse inspectionMonthly to quarterlySustains emissions compliance
Combustion chamber vacuumingMonthlyReduces clinker formation
Heat exchanger cleaningAnnuallyRestores energy recovery capacity

Even 1 mm of soot can cause up to 10% fuel efficiency loss.

Ash and soot buildup on heat transfer surfaces increases fuel consumption by reducing thermal efficiency.True

These deposits act as insulation, forcing more fuel to achieve the same heat output.


👷 Operator Training and Its ROI

Training AreaImpact on Lifecycle Cost
Combustion optimizationReduces unburned fuel, CO, soot
Startup/shutdown proceduresPrevents thermal shock, wear
Sensor and alarm interpretationEnables early problem detection
Water chemistry managementPrevents scaling and corrosion
Fuel handling and feedingAvoids clogs, fire hazards

Well-trained operators can reduce fuel use by 5%–10%, avoid 2–4 unplanned shutdowns per year, and extend boiler life by 3–5 years.

Training operators in biomass combustion and system response improves efficiency and reduces unplanned maintenance.True

Skilled staff optimize combustion, react quickly to faults, and handle fuel variability better.


📊 Case Study: Lifecycle Cost Comparison

Facility A (No Training, Minimal Maintenance):

  • 20 TPH biomass boiler

  • Fuel efficiency: 68%

  • Annual repairs: $85,000

  • Downtime: 12 days/year

  • Lifecycle cost (20 years): ~$28 million

Facility B (Trained Staff + Preventive Cleaning):

  • 20 TPH biomass boiler

  • Fuel efficiency: 78%

  • Annual repairs: $40,000

  • Downtime: 4 days/year

  • Lifecycle cost (20 years): ~$23 million

  • Savings: $5+ million


📋 Best Practices for Lifecycle Cost Control

PracticeDescription
Create a preventive maintenance scheduleBase it on OEM and runtime data
Track cleaning intervals with logsIdentify patterns in fouling
Use infrared or stack sensorsDetect hidden heat loss or airflow issues
Conduct quarterly operator refresher trainingKeep staff sharp and compliant
Budget annually for training + maintenanceEnsure funding isn’t cut reactively

Summary

Maintenance, cleaning, and operator training are key cost levers in the lifecycle of a biomass boiler system. These elements directly affect efficiency, availability, component durability, and compliance. Facilities that neglect these areas face higher fuel costs, shorter equipment lifespan, and frequent operational interruptions. In contrast, disciplined programs lead to fuel savings, extended system life, and smoother operations—with savings that often total millions of dollars over two decades. In biomass boiler management, smart habits save hard cash.

What Role Do Emissions Control and Compliance Systems Play in Long-Term Budgeting?

In biomass boiler systems, staying compliant with air quality and environmental regulations isn’t optional—it’s central to long-term cost management and system viability. As global and regional environmental standards tighten, emissions control systems like cyclones, baghouses, scrubbers, and continuous emissions monitoring systems (CEMS) become critical line items in both capital and operating budgets. These systems ensure your facility meets limits for particulate matter (PM), CO, NOₓ, SO₂, and VOCs—protecting you from fines, operational suspensions, or forced retrofits. Over a 20-year lifecycle, emissions control and compliance management can account for 10% to 20% of total boiler system cost.

Emissions control and compliance systems play a pivotal role in long-term budgeting by introducing significant up-front capital investments and recurring operational costs tied to environmental performance. These systems ensure regulatory compliance, avoid penalties, and maintain operating permits. While initial installation may cost $100,000 to over $1 million, ongoing expenses—including maintenance, reagent replenishment, monitoring calibration, and reporting—can add $20,000 to $100,000 or more annually. In regulated markets, these costs must be included in total cost of ownership (TCO) and amortized into financial planning.

In the era of sustainability and carbon accountability, compliance isn’t a cost to cut—it’s a cost to plan for.

Emissions control and compliance systems are essential for permitting and long-term operation of biomass boiler plants.True

They are required by law and prevent penalties, shutdowns, or loss of environmental certification.


🏭 Typical Emissions Systems and Budget Impact

ComponentPurposeInstalled Cost (USD)Annual O&M (USD)
Cyclone SeparatorPre-separation of large particulates$50,000 – $150,000$5,000 – $15,000
Baghouse FilterFine particulate filtration (PM <10µm)$100,000 – $500,000$10,000 – $25,000
Wet/Dry ScrubberSO₂ or acid gas removal$150,000 – $750,000$15,000 – $40,000
SNCR or SCR SystemNOₓ reduction (optional in some regions)$300,000 – $900,000$25,000 – $60,000
CEMS (Continuous Monitoring)Tracks CO, NOₓ, PM, O₂ in real time$40,000 – $120,000$8,000 – $20,000
Stack Sampling & ReportingRegulatory compliance and auditsIncluded in O&M$5,000 – $15,000

For a 3–5 TPH biomass boiler, total installed emissions system cost: $300,000 – $1.2 million
Annual emissions-related O&M: $30,000 – $100,000


📊 Emissions-Related Cost Share in Lifecycle Budget (20-Year Span)

Lifecycle Budget AreaCost (USD)% of TCO
Boiler + Core Systems$2.5 – $5 million40–55%
Fuel Supply & Logistics$6 – $10 million35–45%
Emissions Control (CAPEX + OPEX)$1 – $2.5 million10–15%
Labor + Maintenance (non-emissions)$1.5 – $3 million10–15%

Emissions compliance is a top 3 lifecycle cost category, not just a minor addition.

Over a 20-year period, emissions-related expenses can exceed $2 million for medium-sized biomass boilers.True

Between installation, maintenance, and compliance reporting, these systems represent a major OPEX and CAPEX component.


🧪 Case Study: Biomass Boiler with Baghouse + Scrubber + CEMS

Facility: Industrial processing plant with 4 TPH biomass steam boiler
Location: EU, under strict PM and SO₂ limits

Emissions Compliance ElementCost
Baghouse Filter (fabric)$320,000
Wet Scrubber (lime injection)$460,000
CEMS Unit$85,000
Installation & Integration$180,000
Total Emissions CAPEX$1.05 million
Annual Reagents & Filter Media~$28,000/year
CEMS Calibration & Reporting~$12,000/year

Total 20-Year Emissions Cost: ~$1.7 million
Avoided Fines/Shutdowns: Estimated $300,000 – $500,000


📋 Compliance Considerations for Budget Planning

FactorBudget Impact
Local Emissions LimitsDefines scope of controls needed
Fuel Type & CompositionAffects PM, SO₂, NOₓ output
Boiler Size and Load FactorDrives CEMS & reagent consumption
Automation Integration (PLC/SCADA)Eases reporting, adds upfront cost
Inspection and Re-CertificationRecurring fees every 1–3 years

Some jurisdictions require quarterly stack testing—budget $5,000–$10,000/year minimum.


🌍 Emissions and Regulatory Trends Affecting Future Budgets

  • Tighter PM10 and PM2.5 thresholds

  • Expanded CO₂ and carbon credit policies

  • Real-time emissions dashboards required in EU/UK

  • Higher penalties for non-compliance in Asia and Latin America

Forward-looking budgeting should include a 10–20% emissions cost buffer to account for policy tightening over 10–20 years.

Planning for emissions control upgrades now avoids costly retrofits when regulations tighten later.True

Designing modular, scalable systems upfront reduces future disruption and capital shock.


Summary

Emissions control and compliance systems are non-negotiable components of biomass boiler planning—and their impact on long-term budgeting is substantial. While they add $300,000 to $1.2 million in capital costs and $30,000 to $100,000 in annual O&M, they are essential to maintain operating permits and avoid penalties. Over a 20-year period, these costs often exceed $2 million and must be accounted for in any credible TCO model. In sustainable energy systems, compliance is a cost of doing business—and a safeguard for uninterrupted operation.

How Can ROI and TCO Be Calculated to Assess Long-Term Investment Value of Biomass Boiler Systems?

When evaluating a biomass boiler investment, decision-makers must go beyond the initial price tag and consider the entire financial footprint of the system. This means calculating both Total Cost of Ownership (TCO)—all expenses over the boiler’s life—and Return on Investment (ROI)—how fast the system pays back and how much value it generates. These two metrics help compare biomass systems to alternatives like gas or oil-fired boilers, and support long-term financial and sustainability planning.

ROI (Return on Investment) and TCO (Total Cost of Ownership) are essential tools for assessing the long-term value of a biomass boiler investment. TCO includes all costs over the system’s lifetime—CAPEX, OPEX, fuel, maintenance, labor, emissions compliance, and decommissioning. ROI compares the total benefits (like fuel savings or revenue from steam production) to the total cost, usually expressed as a percentage or payback period. These calculations help quantify project feasibility, determine breakeven points, and guide capital allocation.

A biomass boiler’s value isn’t defined by what you pay today—but by how it performs financially over 20–30 years.

ROI and TCO calculations are essential for evaluating the long-term investment value of biomass boiler systems.True

They provide a complete financial picture, allowing owners to compare options and make informed, sustainable decisions.


📊 Step-by-Step TCO Calculation (Total Cost of Ownership)

TCO = CAPEX + (OPEX × Lifespan) + Compliance Costs + Decommissioning

Cost CategoryExample Value (USD)Notes
CAPEX (Initial Investment)$2.5 millionBoiler + installation + emissions
OPEX (Annual Operating Costs)$300,000 – $700,000Fuel, labor, maintenance, chemicals
Lifespan20 yearsIndustry average
Compliance + Monitoring$30,000/year × 20 = $600,000Emissions, stack testing, permits
Decommissioning (est.)$100,000 – $200,000End-of-life dismantling & disposal

TCO Estimate (20-Year, Mid-Sized Boiler):
$2.5M + ($500K × 20) + $600K + $150K = $13.75 million


💰 Step-by-Step ROI Calculation

Simple ROI Formula:

ROI (%) = (Net Benefit ÷ Total Investment) × 100

Payback Period Formula:

Payback (years) = Total Investment ÷ Annual Savings


🧪 ROI Example: Biomass vs. Oil-Fired Boiler

ParameterBiomass BoilerOil-Fired Boiler
CAPEX$2.5 million$1.2 million
Annual Fuel Cost$330,000$850,000
Annual OPEX (excluding fuel)$160,000$120,000
Annual Savings (fuel + emissions)$480,000
Payback Period2.5M ÷ 480K = ~5.2 yrs
20-Year ROI($480K × 20) ÷ 2.5M = 384%

Despite higher capital cost, fuel savings provide strong returns within 5–6 years, especially in high-fuel-cost regions.

Biomass systems often achieve payback in under 6 years through fuel savings compared to oil or LPG systems.True

Cheaper biomass fuel offsets the higher capital investment over time.


📋 TCO vs. ROI: Side-by-Side Analysis

MetricWhat It Tells YouUsed For
TCOLifetime financial burdenBudget forecasting, risk analysis
ROI (%)Profitability from investmentInvestment comparison, performance
Payback PeriodTime to recover investmentProject feasibility, loan planning
NPV/IRRTime-value adjusted returnAdvanced investment modeling

For a financially sound biomass project, aim for:

  • TCO below $15M (20-year scope)

  • ROI above 250%

  • Payback < 7 years


📉 Factors That Affect ROI & TCO

FactorTCO ImpactROI Impact
Fuel Type & Price StabilityHigh (lower is better)High (greater savings)
Boiler EfficiencyHigh (efficiency = lower TCO)High
Automation LevelHigher CAPEX but lower OPEXPositive long-term
Labor and Maintenance PracticesModerateSignificant (avoids failures)
Emissions Compliance StringencyModerate to highMay reduce savings margin

Boiler efficiency and fuel type are the most influential factors in long-term ROI for biomass systems.True

They directly affect both recurring costs and achievable savings.


🔁 Tips for Accurate ROI and TCO Analysis

  • Use realistic fuel cost escalation (e.g., 2%/year)

  • Include maintenance, training, and cleaning costs

  • Factor in emissions compliance changes over 20 years

  • Don’t forget downtime risk or part replacement cycles

  • Use Net Present Value (NPV) for deeper analysis

  • Create comparison models with fossil fuel alternatives


Summary

Calculating ROI and TCO is essential for determining the long-term financial viability of biomass boiler investments. While capital costs may be high, the fuel savings, compliance benefits, and lifecycle efficiency of biomass often deliver strong returns—especially when projected over 20–30 years. A clear financial model ensures that decisions are based not on the cheapest option upfront, but on the most valuable option long term. For industrial users, schools, or utilities, a high-ROI biomass system can fund itself—and then fuel savings for years to come.

🔍 Conclusion

The cost of an industrial biomass boiler goes far beyond the initial purchase. While the fuel cost per unit energy is generally lower than oil or gas, factors like fuel quality variability, ash management, and system maintenance must be considered when evaluating total ownership cost. By conducting a full lifecycle cost analysis, including installation, fuel, upkeep, and regulatory compliance, businesses can ensure their investment in biomass technology delivers long-term environmental and economic benefits.


📞 Contact Us

💡 Need help calculating the full cost of a biomass boiler project? Our team offers feasibility studies, TCO assessments, and customized cost modeling to help you plan confidently.

🔹 Contact us today and invest in a biomass boiler system that’s efficient, cost-effective, and built to last. 🌱🔥💰

FAQ

What is the average upfront cost of an industrial biomass boiler?

Upfront costs typically range from $150,000 to $1.5 million, depending on boiler size, type (grate, fluidized bed, etc.), automation, emissions controls, and whether it supports multi-fuel operations. Installation costs (civil works, piping, feed systems) add $100,000–$500,000.

What are the long-term fuel costs for a biomass boiler?

Biomass fuel cost depends on type and region.

  • Wood chips: $40–$70/ton

  • Wood pellets: $150–$250/ton

  • Agri-waste/energy crops: $30–$80/ton
    Annual fuel costs for mid-size units can range from $100,000 to $500,000, influenced by fuel quality and moisture content.

How much does long-term maintenance cost?

Maintenance tends to be 5–8% of the capital cost per year, due to:

  • Ash handling system upkeep

  • Tube cleaning

  • Refractory replacement

  • Fuel feeding system maintenance
    Over a 20-year lifespan, expect $300,000–$800,000+ in total maintenance costs.

What hidden or indirect costs should be considered?

  • Fuel storage infrastructure and drying systems

  • Permitting and emissions compliance (especially for particulate matter)

  • Operator training due to more complex fuel handling

  • Emission control systems (e.g., cyclones, baghouses)

  • Fuel supply logistics, especially for variable biomass

How do biomass boilers compare in total cost of ownership (TCO)?

While upfront costs are higher than gas/oil boilers, biomass systems benefit from lower and stable fuel prices, renewable energy incentives, and carbon credits. Over 20+ years, they offer competitive or even lower TCO—especially where biomass is locally sourced and regulations favor carbon neutrality.

References

  1. Industrial Biomass Boiler Cost Overviewhttps://www.energy.gov

  2. Biomass Fuel Cost and Supply Guidehttps://www.bioenergyconsult.com

  3. Total Cost of Ownership for Biomass Systemshttps://www.researchgate.net

  4. Biomass Boiler Installation and Operating Costshttps://www.sciencedirect.com

  5. Emission Compliance Costs for Biomass Boilershttps://www.epa.gov

  6. Wood Chip vs. Pellet Cost Comparisonhttps://www.eia.gov

  7. Boiler Maintenance and Lifecycle Analysishttps://www.mdpi.com

  8. IEA Biomass Boiler Economics Reporthttps://www.iea.org

  9. Renewable Heat Incentive and Carbon Creditshttps://www.energysavingtrust.org.uk

  10. ASME Biomass Boiler Standards and Cost Trendshttps://www.asme.org

Wade Zhang

CEO of Taishan Group Taian Boao International Trade Co., Ltd. 30 years experience in Global industrial boiler market,  Over 300 boiler projects experience, including 21+ EPC projects. Projects span 30+ countries & regions, involving industries such as nuclear power, energy & electricity, municipal heating, mining, textiles, tires etc.

Upfront and Long-Term Costs of an Industrial Biomass Boiler Read More »

Upfront and Long-Term Costs of an Industrial Coal-Fired Boiler

Upfront and Long-Term Costs of an Industrial Coal-Fired Boiler

Industrial coal-fired boilers are widely used in power generation, metallurgy, textiles, and chemical industries due to their fuel availability, cost-effectiveness, and scalability. However, while coal remains a low-cost fuel option, these systems often come with complex infrastructure requirements, regulatory challenges, and high maintenance demands. Evaluating only the upfront cost can lead to unexpected expenses in the long run—making it crucial to assess both capital and lifecycle costs when planning a purchase.

The upfront costs of an industrial coal-fired boiler include equipment price, construction and installation, fuel handling systems, ash management, and environmental compliance technologies. Long-term costs encompass fuel expenditure, emissions control, regular maintenance, spare parts, operator training, and potential carbon penalties. Over a lifespan of 20–30 years, operational and regulatory costs can far outweigh the initial investment, especially with tightening environmental regulations. Therefore, a full cost analysis is essential to determine total cost of ownership (TCO).

Here’s how the cost structure breaks down in both the short and long term.

What Are the Typical Upfront Costs for Purchasing and Installing a Coal-Fired Boiler System?

Investing in a coal-fired boiler system is a significant capital decision, particularly for industrial plants or energy-intensive facilities. These systems are large, complex, and require extensive support infrastructure such as fuel storage and handling, ash disposal systems, emission control units, and water treatment facilities. As a result, the upfront cost of purchasing and installing a coal-fired boiler is typically much higher than oil- or gas-fired alternatives. Understanding these cost components helps project developers, engineers, and procurement teams budget accurately and assess feasibility.

The typical upfront costs for purchasing and installing a coal-fired boiler system range from $2 million to over $10 million depending on capacity, pressure rating, environmental controls, and site-specific requirements. These costs include the boiler unit, coal handling system, ash handling, flue gas treatment, water treatment, piping, instrumentation, and civil construction. For a mid-size 10–50 TPH coal boiler, expect costs between $3.5 million and $7 million. Large-scale power plant systems or high-pressure utility boilers may exceed $20 million when all auxiliary systems are included.

Coal-fired boiler projects demand detailed engineering, regulatory compliance, and infrastructure investment—which must all be reflected in capital planning.

The upfront cost of a coal-fired boiler includes more than just the boiler unit—it covers fuel handling, ash disposal, emission control, and civil construction.True

These auxiliary systems are essential for safe, efficient, and compliant operation, often doubling or tripling the cost of the boiler unit alone.

🧱 Typical Cost Breakdown for a Coal-Fired Boiler Installation

Component/ServiceCost Range (USD)Share of Total Capex (%)
Boiler Unit + Burner$1,200,000 – $3,500,00025–35%
Coal Handling System$300,000 – $1,200,00010–15%
Ash Handling System$200,000 – $800,0005–10%
Flue Gas Desulfurization (FGD)$500,000 – $2,000,00010–20%
Electrostatic Precipitator (ESP)$400,000 – $1,500,0008–12%
Water Treatment Plant$300,000 – $900,0005–10%
Control & Instrumentation (PLC/SCADA)$250,000 – $800,0005–8%
Piping, Valves, Ducting$200,000 – $700,0003–7%
Civil Construction & Foundations$500,000 – $2,000,00010–20%
Installation Labor & Testing$300,000 – $1,500,0007–15%

Total Estimated Upfront Cost Range: $2 million to $10+ million
(Varies with boiler size: 5–100+ TPH)

📉 Cost by Boiler Capacity

Boiler Capacity (TPH)Pressure (bar)Installed Cost Estimate (USD)
5 TPH10–25 bar$2.2 – $3.8 million
10 TPH25–40 bar$3.5 – $5.0 million
25 TPH40–60 bar$6.0 – $8.5 million
50 TPH60–80 bar$8.0 – $12 million
100 TPH+100 bar+$15 – $25+ million

Utility-scale projects often include multiple boilers, turbines, and power generation infrastructure, significantly raising capital costs.

High-capacity coal boilers require substantial auxiliary infrastructure, making them more expensive to install than other boiler types.True

Coal systems need coal and ash handling, flue gas treatment, and emissions controls that are not needed in simpler fuel systems.

🔧 Key Factors That Influence Capital Cost

FactorDescriptionCost Impact
Boiler Output (TPH or MW)Higher output = larger and more complex systemMajor
Emission Control RequirementsFGD, ESP, baghouses required by lawMajor
Fuel Type (e.g. lignite vs. bituminous)Affects burner and handling designModerate
Automation and Monitoring LevelPLC, SCADA, DCS integrationModerate
Water Quality and SourceAffects treatment system sizeModerate
Site Conditions (greenfield vs. retrofit)Civil, access, foundationsHigh (for retrofit)

🧪 Case Study: 25 TPH Coal Boiler Project in Southeast Asia

Scope:

  • 25 TPH coal-fired boiler at 40 bar

  • Bituminous coal fuel

  • Includes ESP, basic water treatment, PLC control

  • Moderate emission regulation compliance

Breakdown:

  • Boiler + Burner: $2.1 million

  • Coal & Ash Handling: $1.1 million

  • ESP + Stack: $1.3 million

  • Water Treatment + Piping: $0.9 million

  • Civil Works + Labor: $1.2 million

  • Total Installed Cost: $6.6 million

  • Payback from fuel savings vs. oil: ~3.7 years

Coal-fired boiler systems offer cost savings in fuel but require higher upfront investment than gas or oil-fired systems.True

While coal fuel is cheaper, the installation is costlier due to environmental and infrastructure requirements.

📋 Additional Considerations in Budgeting

ItemEstimated Cost or RangeWhy It Matters
Project Engineering & Design$150,000 – $750,000Essential for proper sizing and layout
Permitting & Environmental Studies$50,000 – $250,000Required for emissions and construction
Operator Training$20,000 – $100,000Critical for safe and efficient use
Spare Parts Inventory2–5% of capexPrevents extended downtime
Contingency5–15% of project costAccounts for overruns and design changes

Summary

The upfront cost of a coal-fired boiler system is significantly higher than other fuel types due to the scale, complexity, and regulatory compliance required. A complete system includes not just the boiler, but fuel handling, ash disposal, emissions controls, and civil works—often more than doubling the base equipment cost. While coal may offer lower fuel costs over time, the initial capital investment ranges from $2 million to over $10 million. For industrial operations seeking fuel flexibility and long-term savings, this investment can pay off—but only with thorough planning, efficient design, and disciplined project execution.

How Do Fuel Handling, Ash Removal, and Flue Gas Treatment Systems Add to Capital Cost?

Coal-fired boiler systems are complex thermal plants that require more than just a combustion unit. To ensure efficient, clean, and safe operation, they must be equipped with robust fuel handling infrastructure, ash disposal mechanisms, and emission control systems. These auxiliary systems are essential but significantly increase the capital cost of the overall installation. In many cases, they represent more than half of the total investment, particularly when strict environmental regulations are in place. Understanding their cost implications is crucial for accurate budgeting and project planning.

Fuel handling, ash removal, and flue gas treatment systems add substantially to the capital cost of coal-fired boiler systems because they require large, custom-engineered infrastructure, mechanical equipment, and environmental controls. Fuel handling systems include conveyors, crushers, bunkers, and feeders. Ash removal systems manage hot and abrasive byproducts from the combustion chamber. Flue gas treatment systems such as electrostatic precipitators (ESP), flue gas desulfurization (FGD), and baghouses are often legally required. Together, these systems can account for 40% to 60% of total capital costs.

In coal boiler projects, supporting systems cost as much as—if not more than—the boiler itself.

Fuel handling, ash removal, and flue gas treatment systems significantly increase the capital investment required for coal-fired boiler systems.True

These systems are essential for fuel delivery, emission control, and waste management, and they often cost more than the core boiler unit.

🔧 Cost Contribution of Key Auxiliary Systems

System ComponentTypical Cost Range (USD)Share of Total Capital Cost (%)
Fuel Handling System$300,000 – $1,500,00010–15%
Ash Removal System$200,000 – $1,000,0005–10%
Electrostatic Precipitator (ESP)$400,000 – $2,000,00010–20%
Flue Gas Desulfurization (FGD)$600,000 – $3,000,00010–25%
Baghouse Filters / Scrubbers$300,000 – $1,500,0005–15%
Chimney/Stack System$200,000 – $1,200,0003–7%

Combined, these systems may add $1.5 million to over $6 million to a typical mid-sized industrial coal-fired boiler installation.

📉 Breakdown of Auxiliary System Cost Impact

ComponentMid-Size Boiler (10–25 TPH)Large Boiler (50+ TPH)
Core Boiler Unit$2.0 – $3.5 million$4.5 – $7 million
Auxiliary Systems$3.0 – $5.5 million$6.0 – $12+ million
Total System Installed$5.0 – $9.0 million$10.5 – $19+ million

Auxiliary systems often cost more than the boiler unit in a complete coal-fired installation.True

Their role in emissions, fuel logistics, and ash management makes them large-scale engineered systems with substantial capital impact.

🔄 Detailed Cost Impact by Function

🪨 1. Fuel Handling System

Includes:

  • Coal crushers

  • Storage bunkers

  • Conveyors (belt/screw)

  • Feeders and chutes

  • Dust suppression systems

Typical Cost Range: $300,000 – $1.5 million
Why it adds cost: Requires robust construction, layout design, and fire prevention measures.

⚫ 2. Ash Removal System

Includes:

  • Bottom ash hoppers

  • Submerged drag chain conveyors

  • Fly ash silos and transport

  • Vacuum or pneumatic ash systems

Typical Cost Range: $200,000 – $1 million
Why it adds cost: Handles abrasive, high-temperature residue that requires heat- and wear-resistant materials.

🌫 3. Flue Gas Treatment System

Includes:

  • Electrostatic precipitators (ESP)

  • FGD (wet/dry scrubbers)

  • Baghouse filters

  • NOₓ control systems (SNCR/SCR)

  • Stack and draft fans

Typical Cost Range: $1 million – $6 million+
Why it adds cost: Required to comply with strict air pollution control laws; high-tech systems with complex integration.

🧪 Case Study: 20 TPH Coal-Fired Boiler with Full Auxiliaries

Installed in Eastern Europe for district heating application

  • Boiler Unit: $2.6 million

  • Fuel Handling: $850,000

  • ESP System: $1.3 million

  • FGD Scrubber: $1.9 million

  • Ash Handling: $700,000

  • Piping + Installation: $900,000

  • Control + Integration: $400,000

  • Total Installed Cost: $8.65 million

Auxiliaries accounted for ~70% of total cost, driven by strict EU emissions compliance.

📋 Regulatory and Design Drivers That Affect Cost

FactorDescriptionCapital Cost Effect
Emission Limits (SO₂, NOₓ, PM)Determines FGD, ESP, and SCR system sizeMajor
Boiler Size and Fuel TypeHigher TPH and low-grade coal = more ashHigh
Local Ash Disposal RegulationsAffects need for silo storage or landfillsModerate
Automation RequirementsPLC and monitoring for all auxiliary systemsModerate
Site ConditionsSpace for conveyors and stack equipmentHigh (especially in retrofits)

Summary

Fuel handling, ash removal, and flue gas treatment systems are essential and cost-intensive components of any coal-fired boiler installation. They ensure the safe, clean, and efficient transport, combustion, and disposal of coal and its byproducts. While the boiler itself might be the central unit, these supporting systems can double or triple the total installed cost, especially under stringent environmental regulations. For project developers and engineers, including these auxiliary costs in the initial budget is not optional—it’s fundamental to successful planning and implementation.

What Are the Recurring Fuel and Operational Expenses Over the Boiler’s Lifecycle?

When evaluating a boiler system’s true cost, it’s critical to look beyond the upfront capital investment. Over the 15–30 year lifespan of a coal-fired boiler, the majority of expenses come from recurring fuel and operational costs. These costs accumulate every day the system is running—impacting your profit margin, emissions output, and total cost of ownership. Whether your system is large or small, understanding the annual and cumulative fuel, labor, maintenance, and water treatment costs is key to accurate financial planning.

Recurring fuel and operational expenses over a coal-fired boiler’s lifecycle include fuel procurement, ash handling, maintenance, water treatment, labor, emissions compliance, and auxiliary power usage. Fuel alone typically accounts for 70% to 90% of total lifecycle operating costs. Other ongoing expenses—such as operator wages, chemical dosing, spare parts, soot blowing, and environmental monitoring—can make up 10% to 30% of annual operating budgets. Over 20 years, these recurring costs often exceed the boiler’s original purchase and installation price by 5 to 10 times.

Your fuel and operations plan is not just about cost—it determines the long-term economic viability of your system.

Recurring operating costs over a boiler’s life far exceed the initial capital cost.True

Fuel, labor, maintenance, water treatment, and compliance expenses accumulate continuously and dominate lifecycle cost.

🔁 Primary Categories of Recurring Costs

Cost CategoryDescription
FuelCoal purchase, delivery, and storage
Ash HandlingCollection, transport, and disposal of bottom and fly ash
Maintenance & RepairsSoot blowing, descaling, part replacement, pump/burner upkeep
Water TreatmentSoftening, demineralization, chemical dosing, blowdown losses
Labor & SupervisionBoiler operators, maintenance staff, training
Emissions ComplianceMonitoring, flue gas analyzers, FGD reagent, dust collector upkeep
Auxiliary ElectricityFor fans, conveyors, pumps, controls
Insurance/PermitsLegal compliance, certifications, and risk management

📊 Lifecycle Operating Expense Estimates (20-Year Operation, 25 TPH Coal Boiler)

Cost ComponentAnnual Cost Estimate (USD)20-Year Total (USD)% of Lifecycle Cost
Fuel (Coal)$1.6 – $2.2 million$32 – $44 million70–85%
Maintenance$90,000 – $150,000$1.8 – $3.0 million4–6%
Labor$100,000 – $180,000$2.0 – $3.6 million5–8%
Water Treatment$60,000 – $100,000$1.2 – $2.0 million3–5%
Ash Disposal$50,000 – $120,000$1.0 – $2.4 million2–4%
Emission Control (FGD/ESP)$80,000 – $200,000$1.6 – $4.0 million4–8%
Electricity (Auxiliary Load)$40,000 – $70,000$0.8 – $1.4 million2–3%
Others (insurance, training)$20,000 – $40,000$0.4 – $0.8 million1–2%
Total Lifecycle OPEX$40 – $61 million5–10× capital cost

Fuel costs are the dominant recurring expense in coal boiler operation.True

Fuel accounts for more than 70% of annual and total operating expenses, dwarfing other categories.

🪨 Fuel Costs: The Dominant Factor

ParameterExample Value
Boiler Capacity25 TPH
Efficiency82%
Operating Hours/Year6,000
Coal Consumption~13,000–15,000 tons/year
Coal Price (delivered)$120 – $160 per ton
Annual Fuel Cost$1.56 – $2.4 million

Fluctuations in coal market prices, transport logistics, or boiler efficiency can shift costs by hundreds of thousands per year.

🧪 Case Study: Cement Plant Boiler Lifecycle Cost

Setup:

  • 20 TPH boiler

  • 20 years planned life

  • Operates 5,800 hrs/year

  • Uses bituminous coal at $135/ton

Results:

  • Total coal used: 265,000 tons

  • Fuel cost: ~$35.7 million

  • Other O&M: ~$5.3 million

  • Total lifecycle operating cost: ~$41 million

  • Capex for system: $6.2 million

  • OPEX is over 6.6× the initial capital investment

Total operating cost of a coal boiler system can be five to ten times the capital cost over its lifetime.True

Recurring fuel and service needs drive long-term costs far beyond initial installation expenses.

📋 How to Minimize Recurring Operating Costs

Optimization ActionAnnual Savings Potential (%)
Improve Combustion Tuning5–8% fuel savings
Install Economizer4–7% fuel savings
Automate Blowdown System3–5% water and chemical savings
Recover Condensate5–10% water and energy savings
Implement Predictive Maintenance15–25% less unplanned repair costs
Use PLC/SCADA MonitoringReduces labor and improves efficiency

Regular monitoring and optimization can contain and reduce long-term operational expenses by thousands to hundreds of thousands per year.

Summary

The true cost of operating a coal-fired boiler lies not in its installation, but in its daily and yearly consumption of fuel, labor, and maintenance resources. Over a 20-year span, the recurring expenses can add up to 5 to 10 times the system’s purchase price, with fuel representing the lion’s share of the burden. Controlling these costs through efficient operation, proper maintenance, and automation is key to maximizing your return on investment. In boiler systems, your lifecycle cost is determined not by what you spend once—but by what you spend every single day.

How Do Emissions Regulations and Carbon Taxes Affect Long-Term Operating Costs?

For coal-fired boiler operators, emissions are no longer just an environmental concern—they are a significant financial liability. With the global push toward decarbonization, emissions regulations and carbon pricing mechanisms such as carbon taxes or cap-and-trade programs are reshaping the economics of thermal energy production. These policies add direct costs per ton of emitted CO₂ and impose mandatory installation of emissions control technologies, both of which raise the long-term operating expenses of coal boiler systems.

Emissions regulations and carbon taxes increase long-term operating costs by requiring pollution control technologies, compliance monitoring, and financial penalties for CO₂ emissions. Stricter limits on particulate matter, sulfur dioxide (SO₂), nitrogen oxides (NOx), and greenhouse gases lead to higher costs for flue gas treatment systems such as ESPs, scrubbers, and selective catalytic reduction (SCR). Carbon taxes directly charge for CO₂ emissions per ton, increasing annual fuel-related costs by 10–30% or more depending on boiler efficiency and fuel carbon content. Over a 20-year period, these costs can exceed millions of dollars, transforming compliance from a choice into a business-critical investment.

In the age of carbon regulation, your emissions footprint is also your financial footprint.

Carbon taxes and emissions regulations substantially increase the lifecycle operating costs of coal-fired boiler systems.True

They require costly control systems, monitoring, and recurring payments tied to fuel carbon content and pollutant output.

🌫 Key Emissions and Their Cost Implications

PollutantSource in CombustionRegulatory Control System RequiredFinancial Impact
CO₂ (carbon dioxide)Coal carbon contentCarbon tax, offset purchaseAdds cost per ton of fuel burned
SO₂ (sulfur dioxide)Sulfur in coalFlue Gas Desulfurization (FGD)High capital and reagent costs
NOₓ (nitrogen oxides)High combustion tempsLow-NOx burners, SCR, SNCREquipment + ammonia injection costs
Particulate Matter (PM)Ash particlesElectrostatic Precipitator (ESP), baghouseOngoing filter maintenance and upgrades

💰 Example: Carbon Tax Cost Impact

ParameterValue
Boiler Capacity25 TPH
Annual Operating Hours6,000
Fuel: Bituminous Coal25,000 tons/year (~2.4 tons CO₂/ton)
Annual CO₂ Emissions~60,000 tons
Carbon Tax Rate$30 – $70 per ton CO₂
Annual Carbon Tax Cost$1.8 – $4.2 million

Carbon taxes directly penalize fossil fuel usage by assigning a cost to every ton of CO₂ emitted.True

This cost adds to annual operating expenses and can dramatically affect fuel choice and boiler economics.

📊 Lifecycle Impact of Emissions Regulations

CategoryCompliance Cost Range (20 Years)Description
Carbon Tax (CO₂)$30 – $90 millionBased on emissions volume and tax rate
SO₂ Scrubber O&M$4 – $8 millionFGD equipment maintenance + lime/lime stone cost
ESP Maintenance$2 – $4 millionDust collector replacement and cleaning
NOₓ Control (SCR/SNCR)$3 – $6 millionAmmonia or urea dosing and catalyst replacement
Emissions Monitoring$500,000 – $1.5 millionCEMS (Continuous Emissions Monitoring Systems)

These costs are recurring and cumulative, growing as environmental rules become stricter over time.

🧪 Case Study: 20 TPH Coal Boiler in a Carbon Tax Region

Setup:

  • Bituminous coal boiler

  • Annual CO₂ emissions: 52,000 tons

  • Carbon tax: $45/ton

  • Installed FGD + ESP + SNCR

Annual Costs:

  • Carbon Tax: $2.34 million

  • Reagents (lime/ammonia): $220,000

  • Emissions Equipment Maintenance: $180,000

  • Monitoring/Reporting: $75,000

Total Annual Emissions Cost: $2.8+ million
Over 20 Years: ~$56 million in emissions-related expenses

This cost is comparable to or greater than fuel cost, altering the economic viability of coal-based energy.

Emissions control and taxation can double the operating cost of coal-fired boiler systems over time.True

When accounting for carbon taxes and environmental compliance, emissions become one of the largest cost drivers.

📋 Strategies to Mitigate Emissions Cost Impact

StrategyDescriptionCost Benefit
Fuel Switching (to biomass, low-sulfur coal)Reduces SO₂ and CO₂ outputLowers carbon and scrubber tax burden
Efficiency UpgradesImproves combustion, lowers CO₂ per output unitReduces taxed emissions
Carbon Capture and Storage (CCS)High-cost, emerging technologyOffsets some tax exposure long-term
Energy Recovery SystemsImproves heat utilization, lowers fuel demandLess fuel burned = fewer emissions
Blending with RDF or BiofuelReduces fossil fuel fractionMay lower effective emissions tax

A long-term emissions strategy must be technical, financial, and regulatory all at once.

Summary

Emissions regulations and carbon taxes represent a major shift in the economics of coal-fired boiler systems. While the systems themselves are capital intensive, it is the long-term cost of carbon and pollutant compliance that increasingly determines feasibility and profitability. With CO₂ taxed per ton and other pollutants requiring multi-million-dollar control systems, emission-related costs can double total operating expenses over 20–30 years. For operators, compliance is no longer optional—and emissions have become a business-critical cost center.

What Maintenance, Manpower, and Downtime Costs Should Be Budgeted for in a Coal-Fired Boiler System?

Operating a coal-fired boiler is not only about managing fuel—it’s also about keeping the system running safely and reliably through regular maintenance, skilled staffing, and planned downtime. Failing to budget adequately for these areas can lead to unexpected failures, extended shutdowns, and costly emergency repairs. Maintenance and manpower are ongoing needs, and downtime—planned or unplanned—can significantly impact output and revenue. A well-structured budget must account for both scheduled operational support and potential risk mitigation.

Maintenance, manpower, and downtime costs in a coal-fired boiler system should be budgeted as essential, recurring operating expenses. Maintenance includes preventive, predictive, and corrective actions such as soot blowing, descaling, tube inspection, pump repair, and emissions system upkeep. Manpower covers full-time operators, technicians, and training. Downtime costs include production losses during planned overhauls and unplanned outages. Annual budgets should allocate $100,000–$300,000+ for maintenance, $150,000–$400,000 for staffing, and $50,000–$500,000 for downtime-related losses, depending on boiler size and operation frequency.

Skimping on these categories is not saving—it’s delaying the inevitable cost of failure.

Proper budgeting for maintenance and staffing helps reduce unplanned downtime in coal boiler operations.True

Regular inspections and skilled labor reduce the frequency and duration of costly shutdowns.

🧰 Maintenance Cost Categories and Estimates

Maintenance TaskFrequencyAnnual Cost Range (USD)
Soot Blowing & Ash RemovalDaily/weekly$8,000 – $25,000
Tube Inspections & CleaningMonthly to annually$20,000 – $60,000
Burner MaintenanceQuarterly to annually$10,000 – $30,000
Pump & Motor OverhaulsAnnually$12,000 – $50,000
Instrumentation CalibrationBiannually$5,000 – $20,000
Refractory Repair & Re-liningEvery 2–4 years$30,000 – $150,000
Control System Updates (PLC/SCADA)As needed$15,000 – $50,000
Emission Control System UpkeepQuarterly to annually$25,000 – $80,000

Typical Annual Maintenance Budget: $100,000 – $300,000 for mid-sized systems (10–30 TPH)

👷 Manpower and Staffing Costs

Staff TypeRole DescriptionAnnual Cost per Staff (USD)
Boiler Operator (24/7 shift)Control combustion, monitor instruments$45,000 – $65,000
Maintenance TechnicianPerform inspections, cleaning, repairs$35,000 – $55,000
Electrical/PLC TechnicianMaintain automation and alarms$40,000 – $70,000
Water Treatment ChemistMonitor and adjust feedwater chemistry$35,000 – $60,000
Boiler Supervisor/EngineerOversee efficiency, safety, compliance$65,000 – $100,000

Total Manpower Budget: $150,000 – $400,000+ annually, depending on staffing levels and operating hours.

Staffing costs for coal boiler operations can exceed $300,000 per year depending on shift coverage and skills required.True

Round-the-clock operation, technical maintenance, and emissions management require multiple specialized roles.

🕓 Downtime and Outage Cost Considerations

Type of DowntimeDescriptionCost Impact Estimate (USD)
Planned Shutdown (Annual)Scheduled for deep maintenance$20,000 – $100,000 (labor + lost output)
Unplanned DowntimeCaused by part failure, fouling, etc.$5,000 – $50,000/day in losses
Emissions Compliance DelayFailed inspection causes delayFines + $10,000+/day loss
Major Tube Failure EventSudden rupture with weeks of downtime$200,000+ (repair + outage)

A single unexpected shutdown can cost more than an entire year of preventive maintenance.

📊 Example Annual O&M Budget: 20 TPH Coal Boiler

Cost ComponentAnnual Budget (USD)
Preventive Maintenance$160,000
Scheduled Downtime Costs$45,000
Manpower (Full Staffing)$285,000
Emergency Repairs Reserve$50,000
Total Annual O&M Budget~$540,000

This excludes fuel and environmental compliance, which are budgeted separately but greatly affected by maintenance quality.

🧪 Case Study: Maintenance Savings Through Proactive Strategy

Facility: Textile Plant with 15 TPH Boiler
Initial Situation:

  • Reactive maintenance

  • 3 unexpected shutdowns/year

  • Downtime loss: $120,000/year

Solution:

  • Implemented scheduled tube cleaning, soot blowing

  • Added predictive monitoring and spare part inventory

  • Trained 3-person onsite team

Results:

  • Zero unplanned downtime

  • Maintenance cost: +$50,000

  • Downtime cost savings: $120,000

  • Net gain: $70,000/year

Preventive maintenance reduces total cost of ownership by lowering failure frequency and unplanned downtime.True

Even though it increases annual spending, it avoids expensive losses from emergency breakdowns.

Summary

To operate a coal-fired boiler reliably, a facility must plan and budget realistically for three interconnected cost centers: maintenance, manpower, and downtime. These are not optional—they are recurring necessities that determine whether your system operates efficiently or hemorrhages costs. With budgets ranging from $400,000 to over $1 million annually (depending on scale), they demand the same strategic attention as fuel procurement. In high-load boiler operations, failing to maintain is planning to fail—and paying the price for it.

DZL coal-fired boilers(3)

How Can Total Cost of Ownership (TCO) and ROI Be Estimated for Coal-Fired Boiler Investments?

Investing in a coal-fired boiler is a capital-intensive decision with long-term financial implications. To make an informed choice, plant owners and engineers must look beyond the initial purchase price and evaluate the full Total Cost of Ownership (TCO)—which includes fuel, maintenance, labor, emissions compliance, and downtime over the boiler’s lifespan. Equally important is calculating Return on Investment (ROI), which shows how quickly the system will pay back its cost through operational savings or thermal output benefits. TCO and ROI are essential tools for comparing different technologies, fuel options, and project configurations.

Total Cost of Ownership (TCO) is the sum of all expenses incurred over the lifecycle of a coal-fired boiler, including capital expenditure (CAPEX), recurring operating expenses (OPEX), fuel costs, maintenance, emissions compliance, labor, and decommissioning. ROI is calculated by comparing the net gains (cost savings or revenue) to the total investment. Estimating both metrics requires projecting annual costs and savings over 20–30 years and accounting for variables such as fuel prices, downtime risk, and tax incentives. A typical TCO for a 25 TPH coal boiler may exceed $40 million, with ROI break-even typically achieved in 4–7 years depending on fuel cost advantage and operational efficiency.

If you want to own it profitably, you need to plan for everything you’ll pay for.

TCO and ROI calculations are essential for evaluating the long-term value of a coal-fired boiler investment.True

They help compare total costs and returns across equipment, fuel types, and lifecycle strategies.

📊 TCO Breakdown Example: 25 TPH Coal Boiler Over 20 Years

Cost CategoryEstimated Value (USD)% of Total TCO
Capital Cost (CAPEX)$6.5 million15–18%
Fuel (Coal, 25,000 T/year)$40–45 million70–75%
Maintenance & Repairs$3.5 million7–8%
Labor & Operations$4.2 million8–10%
Emissions Compliance$2.5–4 million5–8%
Downtime Loss Reserve$0.5–1 million1–2%
Total TCO (20-Year)$57 – $64 million100%

Even if capital investment is moderate, fuel and operation dominate long-term ownership costs.

📉 Simple TCO Formula (Non-technical version)

TCO = Initial Cost + (Annual Operating Cost × Years of Operation) + Compliance + Downtime Losses

This simplified formula gives you a 360° view of cost over time, not just up front.

💰 Estimating ROI (Return on Investment)

ROI measures how much benefit you receive from your investment compared to what you paid. For boilers, it’s often evaluated based on fuel savings vs. alternatives (like oil/gas), energy output value, or reduced downtime.

Simple ROI Formula:

ROI (%) = (Annual Cost Savings × Years) ÷ Total Investment × 100

Payback Period = Total Investment ÷ Annual Net Benefit

🧪 Case Study: ROI of Coal vs. Oil-Fired Boiler

ParameterOil-Fired BoilerCoal-Fired Boiler
Initial Cost$1.2 million$6.2 million
Fuel Cost/Year$2.3 million$1.6 million
Annual Fuel Savings (vs. oil)$700,000
Maintenance, Compliance, LaborSlightly lowerHigher
Net Annual Benefit$600,000
Payback Period~10.3 years
ROI Over 20 Years~194%

Despite a longer payback, coal provides strong ROI in fuel-intensive operations—especially where oil is volatile or expensive.

ROI for coal-fired boilers depends heavily on fuel savings compared to alternatives like oil or gas.True

In high-load applications, the lower cost of coal can result in substantial net savings over time.

📋 Steps to Estimate TCO and ROI

StepAction
1. Define Boiler SpecsCapacity, pressure, hours/year
2. Calculate CapexBoiler, fuel system, emissions equipment
3. Estimate OpexFuel, maintenance, labor, chemicals
4. Model Emissions CostsTaxes, FGD/ESP O&M, monitoring
5. Include Downtime EstimatesBased on historical data or risk model
6. Project Over 20–30 YearsInclude inflation, fuel escalation
7. Compare With AlternativesGas/oil-fired boilers, renewables
8. Calculate ROI and PaybackBased on cost savings or output value

Use financial modeling tools or Excel to simulate scenarios and compare technologies side-by-side.

🔁 Factors That Affect TCO/ROI Significantly

FactorEffect on TCO and ROI
Fuel Price VolatilityHigher volatility = higher financial risk
Emissions Tax/ComplianceCan increase TCO by 10–30%
Efficiency ImprovementsFaster payback, better ROI
Downtime FrequencyAdds hidden cost to TCO
Local Subsidies or CreditsMay improve ROI substantially

TCO modeling helps identify hidden costs that affect long-term profitability.True

It captures costs like emissions penalties and downtime losses that don't appear in initial project estimates.

Summary

Estimating Total Cost of Ownership and ROI for coal-fired boiler systems is essential to making informed, financially sound investment decisions. While initial capital costs are significant, it’s the cumulative fuel, labor, maintenance, and emissions expenses that shape the system’s economic profile over decades. A complete TCO analysis reveals the true long-term cost, while ROI calculations show whether and when your investment will pay back. For industrial-scale energy users, accurate TCO and ROI modeling isn’t optional—it’s the foundation of sustainable profitability.

🔍 Conclusion

While the initial cost of a coal-fired boiler may seem lower compared to other systems, the long-term financial picture tells a different story. Fuel storage, ash handling, emissions treatment, and labor can drive up operational costs over time. A comprehensive life-cycle cost assessment is the only way to ensure the investment aligns with your operational and environmental goals. With increasing regulatory scrutiny, operators must also weigh the risk of future compliance costs and potential retrofits.


📞 Contact Us

💡 Looking for clarity on the real cost of a coal-fired boiler system? Our engineering team offers TCO modeling, regulatory impact analysis, and ROI forecasting to support smarter investments.

🔹 Talk to us today and make your next boiler investment cost-effective, compliant, and future-ready. 🏭🪨💰

FAQ

What is the average upfront cost of an industrial coal-fired boiler?

Upfront costs typically range from $100,000 to $1 million depending on size, capacity, pressure rating, and compliance features. Installation adds $50,000–$300,000, covering civil works, fuel handling systems, emission controls, and labor.

What are the long-term fuel costs for coal-fired boilers?

Coal is a relatively low-cost fuel, averaging $40–$60 per ton. However, fuel costs depend on boiler efficiency and coal type. A mid-size industrial boiler consuming ~5,000 tons/year could incur $200,000–$300,000 annually in fuel costs.

How much does ongoing maintenance cost?

Annual maintenance costs range from 3–6% of the capital cost. Over a 20–25 year lifespan, total maintenance (including ash handling, tube cleaning, and refractory replacement) can exceed $300,000–$700,000.

What indirect or hidden costs should be considered?

  • Emissions control equipment (e.g., ESP, FGD systems)

  • Compliance costs for environmental permits and reporting

  • Coal storage, handling, and disposal infrastructure

  • Downtime-related productivity losses

  • Insurance and safety upgrades

How do coal-fired boilers compare in lifecycle cost?

While coal boilers have a lower fuel cost than oil or gas options, they involve higher capital costs, more complex infrastructure, and greater environmental compliance expenses. Their total cost of ownership (TCO) depends heavily on fuel availability, emissions regulation, and operational scale.

References

  1. Coal-Fired Boiler Cost Estimationhttps://www.energy.gov

  2. Global Coal Prices and Forecastshttps://www.eia.gov

  3. Boiler Fuel Cost Analysis and Trendshttps://www.researchgate.net

  4. Installation and Operation Cost of Industrial Boilershttps://www.sciencedirect.com

  5. Coal Handling and Ash Disposal Costshttps://www.epa.gov

  6. Emission Compliance for Coal Boilershttps://www.bioenergyconsult.com

  7. Industrial Boiler Maintenance Best Practiceshttps://www.mdpi.com

  8. Comparing Fuel Options in Industrial Boilershttps://www.energysavingtrust.org.uk

  9. Lifecycle Cost Modeling for Thermal Power Systemshttps://www.iea.org

  10. Boiler Operation and Maintenance Economicshttps://www.asme.org

Wade Zhang

CEO of Taishan Group Taian Boao International Trade Co., Ltd. 30 years experience in Global industrial boiler market,  Over 300 boiler projects experience, including 21+ EPC projects. Projects span 30+ countries & regions, involving industries such as nuclear power, energy & electricity, municipal heating, mining, textiles, tires etc.

Upfront and Long-Term Costs of an Industrial Coal-Fired Boiler Read More »

How to Optimize Industrial Steam Boiler Performance for Lower Operating Costs

How to Optimize Industrial Steam Boiler Performance for Lower Operating Costs

Industrial steam boilers are vital to countless processes across manufacturing, power generation, food, and chemical industries. But inefficient operation—caused by poor combustion control, scaling, excess air, or outdated equipment—can lead to excessive fuel consumption, heat loss, and high operating costs. To remain competitive and sustainable, industries must focus on systematic optimization of boiler performance to reduce both energy use and maintenance expenses.

To optimize industrial steam boiler performance for lower operating costs, focus on combustion tuning, proper air-fuel ratio control, heat recovery (economizers and condensate systems), water treatment, load management, and preventive maintenance. By minimizing excess air, maintaining clean heat exchange surfaces, recovering flue gas energy, and using high-quality feedwater, facilities can significantly improve thermal efficiency, reduce fuel use, and extend boiler lifespan. Digital monitoring and automation can further support real-time optimization and cost savings.

Here’s a strategic framework for improving the efficiency and cost-effectiveness of your steam boiler system.

How Does Air-to-Fuel Ratio Tuning Reduce Fuel Consumption and Improve Combustion Efficiency?

In oil-fired combustion systems, fuel efficiency and emissions performance are deeply influenced by the air-to-fuel ratio (AFR). This ratio represents the amount of air provided relative to the fuel being burned. If this balance is off—whether there’s too little air (fuel-rich) or too much air (air-rich)—the result is incomplete combustion, fuel waste, higher emissions, and energy losses. Proper AFR tuning ensures the burner operates in the most efficient combustion zone, delivering full fuel utilization, stable flame, and minimal environmental impact.

Air-to-fuel ratio tuning reduces fuel consumption and improves combustion efficiency by ensuring that the correct amount of air is mixed with the fuel to achieve complete combustion. If there is too much air, excess oxygen cools the flame and carries heat out through the stack, wasting energy. If there is too little air, not all the fuel burns, leading to unburned hydrocarbons and carbon monoxide. Tuning the AFR to optimal levels (usually slightly above the stoichiometric point) maximizes thermal output from each unit of fuel, minimizes stack losses, and reduces operating costs.

In short, combustion efficiency is all about balance—and AFR is the key to that balance.

Proper air-to-fuel ratio tuning increases combustion efficiency and reduces fuel consumption.True

When the correct amount of air is provided, more of the fuel’s energy is converted into usable heat, lowering waste and cost.

🔍 Understanding the Air-to-Fuel Ratio (AFR)

ConditionDescriptionResult
StoichiometricExact air needed to burn all fuel completelyBest combustion chemistry, but not always stable
Excess Air (Lean)More air than neededCooler flame, more flue gas loss
Fuel-Rich (Low Air)Less air than neededIncomplete combustion, high CO/soot

📊 Efficiency vs. Air-to-Fuel Ratio

Excess Air (%)Flue Gas O₂ (%)Approx. Efficiency (%)CO EmissionsFuel Use Impact
00Unstable combustionVery highWaste
10~287–89%LowOptimal
25~485–87%Very lowSlight waste
50~881–84%MinimalHigh waste
100~11<80%MinimalVery high waste

High excess air levels reduce combustion efficiency by carrying heat out of the boiler.True

Too much air absorbs and removes heat that should be transferred to the steam, increasing fuel consumption.

🧪 Case Study: AFR Tuning in a 3 TPH Oil-Fired Boiler

Before Tuning:

  • Flue gas O₂: 7.8%

  • Excess air: ~55%

  • Stack temperature: 255°C

  • Combustion efficiency: ~82%

  • Annual fuel cost: $610,000

After AFR Tuning and Burner Adjustment:

  • Flue gas O₂: 3.4%

  • Excess air: ~20%

  • Stack temperature: 198°C

  • Combustion efficiency: ~88%

  • Annual fuel cost: $553,000

  • Annual savings: $57,000

By simply adjusting air dampers, burner nozzle, and fuel pressure, fuel use dropped by 9.3%.

⚙️ Tools for Accurate AFR Tuning

Tool or SystemPurpose
Flue Gas AnalyzerMeasures O₂, CO, NOx for fine-tuning
Oxygen Trim ControllerAdjusts airflow based on real-time O₂
Modulating BurnerMatches air/fuel to demand level
SCADA/PLC IntegrationAutomates adjustments over time
Combustion Test KitPortable tool for manual tuning checks

Automated systems can maintain tight control of AFR across changing loads, maximizing efficiency.

Oxygen trim systems automatically adjust air input based on flue gas O₂ levels.True

This allows the system to maintain optimal combustion even as fuel quality or load conditions change.

📋 Benefits of AFR Optimization

BenefitDescription
Fuel SavingsLess excess air = lower fuel input needed
Emission ReductionLower CO, NOx, and particulate output
Flame StabilityAvoids blowoff, backfiring, and cycling
Lower Stack TemperatureMore heat stays in the system
Longer Equipment LifeReduces overheating and soot-related damage

Even small adjustments can lead to large cumulative savings in long-running systems.

Summary

Air-to-fuel ratio tuning is one of the simplest yet most powerful ways to improve combustion efficiency and reduce fuel costs in oil-fired boilers. By ensuring the right balance between air and fuel, you maximize the amount of usable heat from each liter of oil while minimizing waste and emissions. With tools like oxygen trim systems and flue gas analyzers, operators can fine-tune AFR dynamically for optimal performance. In modern combustion systems, fuel savings start with smart airflow.

Why Is Boiler Water Treatment Essential for Preventing Scale and Maximizing Heat Transfer?

Boiler systems rely on efficient heat transfer between combustion gases and water or steam. But if untreated or poorly conditioned water enters the boiler, it brings minerals like calcium, magnesium, and silica, which precipitate and form scale on internal surfaces. Even a thin layer of scale acts as an insulating barrier, forcing the system to burn more fuel to achieve the same output. Over time, this not only reduces efficiency but also causes overheating, tube damage, and potential failure. Proper boiler water treatment is critical to prevent scale formation and sustain maximum thermal performance.

Boiler water treatment is essential because it prevents mineral scale buildup on internal heat transfer surfaces. Without proper chemical conditioning, dissolved minerals in water deposit as hard scale inside boiler tubes and walls. This scale reduces heat transfer efficiency, increases fuel consumption, and leads to overheating or equipment failure. Treated water keeps the system clean, extends boiler life, lowers maintenance needs, and ensures consistent energy output. In high-pressure and high-temperature systems, scale prevention is not optional—it’s vital for safe and cost-effective operation.

In boiler operation, clean water means clean heat—and clean heat means savings and safety.

Untreated boiler water causes mineral scale buildup that reduces heat transfer efficiency.True

Minerals like calcium and magnesium form hard deposits inside the boiler, acting as an insulating layer.

🧱 What Is Scale and Why Does It Matter?

Scale ComponentSource in WaterEffect on Boiler
Calcium CarbonateHard water (Ca²⁺)Forms thick white crust
Magnesium HydroxideHard water (Mg²⁺)Reacts at high temperature
SilicaGroundwater, surface waterForms glass-like hard scale
Iron OxidesCorrosion, dissolved ironBlocks flow, causes pitting

Scale reduces heat transfer area, increases fuel demand, and raises the risk of metal overheating and cracking.

📉 Scale Thickness vs. Efficiency Loss

Scale Thickness (mm)Heat Transfer Reduction (%)Fuel Cost Increase (%)
0.33–4%2–3%
1.08–12%6–8%
2.020–25%10–15%

Even a 1 mm layer of scale can increase fuel usage by thousands of dollars per year in an industrial boiler.

Even thin scale deposits of 1 mm can reduce boiler efficiency by over 10%.True

Scale prevents heat from reaching the water efficiently, which forces the boiler to burn more fuel.

🔧 Key Water Treatment Methods

MethodPurposeEquipment Used
Softening (Ion Exchange)Removes calcium and magnesiumWater softener
DeaerationRemoves oxygen to prevent corrosionDeaerator tank
Chemical DosingPrevents scale, controls pH and TDSDosing pump, chemical tank
BlowdownRemoves concentrated dissolved solidsBlowdown valves, tanks
Reverse Osmosis (RO)Removes salts and silicaRO membranes and filters

Each method works together to keep water quality in the safe range for boiler operation.

🧪 Case Study: Water Treatment in a 5 TPH Boiler

A food processing facility operated a 5 TPH oil-fired boiler using untreated well water. After 9 months:

  • Scale thickness: ~1.2 mm

  • Fuel cost increase: ~$29,000/year

  • Steam output dropped by 7%

  • One tube cracked due to overheating

Actions Taken:

  • Installed water softener + dosing system

  • Set up auto-blowdown control

  • Implemented daily water testing

Results:

  • Efficiency improved by 9.1%

  • No more scaling observed after 3 months

  • Annual savings: $26,500 in fuel and repairs

📋 Key Water Parameters for Boiler Protection

ParameterRecommended RangeImportance
Hardness0 ppmPrevents calcium/magnesium scale
Total Dissolved Solids (TDS)< 3,500 ppm (depends on pressure)Avoids carryover and deposits
pH (Boiler Water)10.5–12.5Protects metal surfaces
Oxygen< 0.007 ppm (7 ppb)Prevents corrosion
Silica< 150 ppm (low-pressure)Prevents hard glassy scale

Daily or weekly testing ensures water stays within these safety limits.

Controlling water pH and hardness is essential to avoid scale and corrosion in boiler systems.True

Balanced pH protects metal, and soft water prevents mineral scaling that blocks heat transfer.

🔁 Long-Term Benefits of Water Treatment

BenefitDescription
Improved EfficiencyBetter heat transfer, lower fuel use
Extended Equipment LifeAvoids thermal stress and metal fatigue
Lower Maintenance CostsFewer repairs due to blocked tubes or leaks
Stable Steam OutputConsistent pressure and heat delivery
Compliance with CodesRequired by ASME, NFPA, and insurance firms

A well-maintained water treatment system pays for itself many times over.

Summary

Boiler water treatment is not optional—it is a core requirement for safe and efficient operation. Without it, scale forms quickly, heat transfer drops, fuel costs rise, and equipment failures become inevitable. By removing minerals, adjusting pH, and controlling dissolved solids, water treatment ensures that your boiler runs clean, hot, and reliable. In oil-fired boiler systems, pure water means powerful performance—and powerful performance keeps costs down and uptime high.

How Can Economizers and Condensate Recovery Systems Reduce Thermal Losses?

One of the biggest inefficiencies in boiler operations is thermal energy lost through exhaust gases and unused hot condensate. Flue gas can exit the boiler at temperatures above 200°C, and unused condensate contains a large amount of latent heat. Without recovery, this energy is literally blown out the stack or drained away. Economizers and condensate recovery systems are designed to capture this waste heat and reuse it within the system, dramatically improving thermal efficiency, reducing fuel consumption, and lowering operating costs.

Economizers and condensate recovery systems reduce thermal losses by recovering heat from exhaust gases and hot condensate that would otherwise be wasted. Economizers capture residual heat from flue gases and use it to preheat the boiler’s feedwater, reducing the energy needed to raise steam. Condensate recovery systems collect and return hot water from steam users back to the boiler, conserving both heat and treated water. Together, these systems can improve boiler efficiency by 5% to 20%, significantly lowering fuel consumption and reducing energy waste.

Recovering what’s already been paid for—that’s the essence of efficient boiler operation.

Economizers and condensate recovery systems reduce heat loss and improve boiler thermal efficiency.True

These systems reuse residual heat from flue gases and hot condensate, cutting the energy needed to generate steam.

🔥 What Is an Economizer?

An economizer is a heat exchanger that sits in the flue gas path and uses the outgoing hot gases to warm up incoming feedwater.

ComponentFunction
Finned TubesIncrease surface area for heat exchange
Flue Gas InletSupplies hot exhaust
Feedwater TubesCarry water to be preheated
Outlet to BoilerDelivers pre-warmed water

By preheating the feedwater, the boiler uses less fuel to raise steam, which boosts efficiency and reduces stack temperature.

📊 Efficiency Gain from Economizer Use

Flue Gas Temp (Before)Flue Gas Temp (After)Efficiency Improvement (%)
230°C170°C~4–5%
210°C140°C~6–8%
190°C120°C~9–12%

Economizers reduce the temperature of flue gas, recovering heat that would otherwise be lost.True

Lowering flue gas temperature through heat exchange captures usable energy and improves fuel efficiency.

💧 What Is Condensate Recovery?

When steam delivers heat to a process, it condenses into hot water called condensate. This condensate is:

  • Clean

  • Treated

  • Pressurized

  • ~80–100°C in temperature

Instead of draining it, a condensate recovery system returns it to the feedwater tank or deaerator.

ComponentFunction
Condensate TankCollects return water from process lines
Return PumpsSend condensate back to the boiler system
Flash Steam VesselRecovers steam from high-pressure condensate
Piping and TrapsControl flow and pressure safely

This reduces energy, chemical, and water input, leading to significant cost savings.

📉 Fuel and Water Savings from Condensate Return

Condensate Recovery (%)Fuel Savings (%)Water Savings (%)Chemical Savings (%)
30%5–7%25–30%20–25%
60%10–12%50–60%40–50%
90%15–18%85–90%70–80%

Condensate recovery systems reduce the need for fresh water, boiler chemicals, and reheating energy.True

Reusing hot, treated water saves on fuel, water supply, and chemical treatment costs.

🧪 Case Study: Combined Heat Recovery Upgrade

A chemical plant running a 6 TPH oil-fired boiler had:

  • No heat recovery

  • Stack temperature: 260°C

  • No condensate return

  • Annual fuel cost: $1.8 million

Upgrades Installed:

  • Economizer lowered flue gas to 150°C

  • Condensate recovery added at 75% return

  • Total upgrade cost: $145,000

Results:

  • Efficiency increase: 13%

  • Annual fuel savings: $234,000

  • Water savings: $19,000

  • Chemical savings: $8,500

  • Payback: ~7.5 months

The upgrades paid for themselves in under a year and continue to deliver long-term savings.

📋 Comparison: Boiler With vs. Without Heat Recovery

ParameterWithout RecoveryWith Economizer & Condensate
Flue Gas Temperature260°C150°C
Boiler Efficiency80%92–94%
Fuel Cost (per year)$1.8M$1.56M
Water Use100% of need40% of need
Steam Cycle LossesHighMinimal

Summary

Economizers and condensate recovery systems are two of the most cost-effective upgrades for improving boiler efficiency and reducing heat loss. They capture wasted thermal energy from flue gases and condensate water and redirect it back into the system. The result: lower fuel consumption, reduced operating costs, smaller environmental footprint, and faster return on investment. In boiler operations, every degree of recovered heat saves money—and heat recovery is the smartest path to efficiency.

What Role Does Load Management Play in Preventing Short-Cycling and Energy Waste?

Boiler systems are most efficient when they run at steady, optimized loads. But in many facilities, demand for steam or hot water fluctuates throughout the day due to varying production, equipment cycles, or environmental conditions. If the boiler lacks proper load management, it will frequently cycle on and off—known as short-cycling. This behavior causes repeated startup losses, increased wear on components, and unnecessary fuel consumption. Effective load management smooths out these fluctuations, ensuring that the boiler responds proportionally, rather than reactively.

Load management plays a key role in preventing short-cycling and energy waste by matching boiler output to real-time demand. Without it, the system cycles on and off frequently during low-load periods, causing repeated fuel-rich startups, heat-up losses, and inefficient combustion. Proper load control—using modulating burners, sequencing systems, and predictive algorithms—allows the boiler to run steadily at part load, reducing fuel use, equipment wear, and emissions. A well-managed load profile keeps the system operating in its most efficient range, improving reliability and reducing costs.

A stable load is the foundation of stable combustion and smart energy use.

Short-cycling increases fuel consumption and mechanical wear in boiler systems.True

Repeated starts and stops reduce efficiency, waste fuel during purge cycles, and stress system components.

🔄 What Is Short-Cycling and Why Is It Problematic?

Short-cycling occurs when the boiler turns on and off repeatedly within short intervals. It’s typically caused by:

  • Oversized boiler

  • Lack of load modulation

  • Low turndown ratio

  • Sudden load drops

Effect of Short-CyclingDescription
Purge LossesCold air purge wastes preheated air and fuel
Fuel-Rich StartupsInefficient combustion during flame reignition
Component FatigueRepeated expansion/contraction of parts
Stack Temperature FluctuationsImpacts heat recovery
Inconsistent Steam QualityPressure swings, water carryover

📉 Energy Impact of Unmanaged Load Profiles

ConditionEfficiency (%)Burner Cycles/DayFuel Waste (%)
Steady Full Load87–89%1–2Low
Controlled Part Load84–86%3–5Moderate
Frequent Short-Cycling75–80%10–20+High (10–20%)

Without load management, short-cycling can increase fuel usage by 5% to 20% annually.

Running a boiler at variable loads without modulation increases the risk of short-cycling and fuel waste.True

A boiler without load control cannot adjust output smoothly, leading to frequent shutdowns and restarts.

⚙️ How Load Management Prevents Energy Waste

Load Management FeatureFunctionBenefit
Modulating BurnersAdjust firing rate smoothlyMatches load without cycling
High Turndown Ratio (10:1)Operates efficiently at low demandReduces on/off frequency
Boiler Sequencing SystemAlternates and stages multiple boilersShares load evenly, improves runtime
Load Forecasting (SCADA/PLC)Predicts demand trendsOptimizes burner transitions
Buffer Tanks (for Hot Water)Stores excess heat for peak shavingSmooths demand fluctuations

With these systems, boilers can run longer, cleaner, and more efficiently, even under fluctuating load conditions.

🧪 Case Study: Industrial Laundry Facility

A 2 TPH boiler at a laundry plant experienced:

  • 18–24 cycles/day during off-peak

  • Flue gas temp spiked each startup

  • Efficiency dropped to 76%

  • Excessive wear on flame sensors

Solution:

  • Installed 10:1 modulating burner

  • Added sequencing system with backup boiler

  • Load scheduling aligned with washer/dryer operations

Results:

  • Cycles reduced to 3–5/day

  • Efficiency increased to 85%

  • Maintenance calls cut by 70%

  • Annual savings: ~$28,000

Modulating burners and sequencing systems reduce short-cycling and fuel costs in multi-boiler plants.True

They adjust output smoothly and distribute load evenly across units, maintaining efficiency under varying conditions.

📋 Best Practices for Load Management

ActionWhy It Helps
Size Boiler for Average LoadAvoids oversizing and cycling
Use Turndown BurnersHandles low load without shutdown
Install Real-Time MonitoringDetects load trends, automates response
Integrate Buffer StorageEvens out demand spikes
Schedule Load-Heavy TasksReduces demand swings during peaks

Systems that run efficiently at part load offer longer lifecycle performance and lower total cost of ownership.

Summary

Load management is critical to preventing short-cycling and avoiding the energy losses that come with frequent on-off operation. By matching boiler output to demand through modulation, sequencing, and predictive controls, facilities can keep their systems running in the sweet spot of efficiency. The result is smoother operation, lower fuel consumption, reduced maintenance, and more consistent thermal output. In boiler operations, stable loads equal stable profits.

How Does Routine Maintenance (e.g. Soot Blowing, Descaling) Sustain Optimal Performance?

Boiler systems operate under intense heat and pressure, and over time, they naturally accumulate soot on the fire side and scale on the water side. These deposits act like insulation, blocking heat transfer and forcing the boiler to burn more fuel to produce the same output. The result is lower efficiency, higher fuel costs, increased emissions, and greater wear on components. Routine maintenance practices—like soot blowing, descaling, blowdown, and inspections—are essential to restore thermal conductivity, sustain output, and prevent costly damage or downtime.

Routine maintenance such as soot blowing and descaling sustains optimal performance by removing buildup on heat transfer surfaces that reduces efficiency. Soot from incomplete combustion coats the fire-side surfaces, while minerals in the feedwater form scale inside boiler tubes. These layers act as thermal barriers, requiring more fuel to maintain output and increasing the risk of tube overheating or rupture. Regular cleaning keeps surfaces conductive, ensures consistent heat transfer, lowers fuel use, and extends equipment life.

In boiler systems, cleanliness is the key to efficiency, reliability, and longevity.

Removing soot and scale during routine maintenance restores boiler efficiency and reduces fuel consumption.True

Deposits act as insulators, and their removal ensures maximum heat transfer from combustion gases to water.

🔧 What Does Routine Maintenance Include?

Maintenance TaskSurface AffectedPurposeFrequency
Soot BlowingFire-sideRemoves carbon and ash from tubesDaily to weekly
Descaling (Chemical Cleaning)Water-sideDissolves mineral scale (Ca, Mg, silica)Annually or as needed
BlowdownWater-sideRemoves dissolved solids and sludgeDaily or automatic
Tube BrushingFire-sideMechanical cleaning of stubborn depositsShutdowns or monthly
Boiler InspectionsBothDetect cracks, pitting, corrosionSemi-annually

These practices form the backbone of preventive maintenance, reducing unplanned shutdowns and improving output quality.

📉 Performance Impact of Soot and Scale

Type of DepositThickness (mm)Efficiency Loss (%)Fuel Use Increase (%)
Soot0.53–5%2–4%
Scale1.010–12%6–8%
Mixed Fouling2.0+>20%>12–15%

Even a small amount of buildup adds thousands in fuel cost and risks overheating tubes.

A thin layer of soot or scale can lead to substantial energy loss and performance decline.True

These deposits create thermal resistance, meaning the boiler must work harder to produce the same amount of heat.

🧪 Case Study: Food Processing Plant Boiler

A 4 TPH steam boiler was showing:

  • Stack temperature: 260°C (up from 215°C)

  • Steam output: down 8%

  • Fuel use: up 12%

  • Water hardness issues not addressed

Maintenance Actions:

  • Soot blown daily for one week

  • Descaling with citric acid solution

  • Blowdown automation installed

  • Feedwater softening system serviced

Results:

  • Stack temp reduced to 205°C

  • Output fully restored

  • Fuel use dropped by 10.5%

  • Annual savings: ~$36,000

📋 Signs That Maintenance Is Needed

IndicatorWhat It Means
High Stack TemperaturePoor heat absorption (soot buildup)
Low Steam PressureReduced thermal output (scale or fouling)
Frequent ShutdownsBurnout or overheating risk
Increased Blowdown VolumeSolids in water are too high
Unusual Noise in TubesScale boiling, possible tube blockage

These early warnings can be caught with daily logs and trend monitoring.

📊 Maintenance Frequency vs. Performance

Maintenance FrequencyAverage EfficiencyFailure RiskFuel Cost (Annual)
None (reactive only)75–80%HighHighest
Semi-Annual Only82–85%ModerateHigh
Monthly + Annual85–87%LowModerate
Weekly + Daily Checks88–90%Very LowLowest

More frequent attention = longer boiler life and greater savings.

🔁 Long-Term Benefits of Routine Maintenance

BenefitHow It Helps
Lower Fuel CostsClean surfaces = efficient heat transfer
Fewer RepairsReduces wear from overheating
Longer Equipment LifePrevents corrosion and metal fatigue
Improved SafetyReduces risk of rupture or explosion
Stable Steam ProductionKeeps output consistent and controllable

Routine maintenance improves steam quality and prevents scaling-related failures.True

Descaling and cleaning eliminate the physical barriers that reduce heat exchange and compromise performance.

Summary

Routine maintenance like soot blowing, descaling, and blowdown is essential to keeping oil-fired boilers efficient, safe, and durable. It removes deposits that act as heat-blocking barriers, restores thermal conductivity, and ensures that each unit of fuel delivers maximum value. Boilers that are cleaned and serviced regularly not only consume less energy—they also last longer, fail less often, and produce better quality steam. In heat-based systems, clean equals efficient, and efficient equals profitable.

How Can Automation and Real-Time Monitoring Lower Operating Costs and Prevent Downtime?

In traditional boiler systems, manual control and delayed problem detection often lead to inefficiencies, fuel waste, and unexpected shutdowns. These issues result in production delays, repair costs, and higher energy bills. Modern boiler operations rely on automation and real-time monitoring to transform reactive maintenance into proactive performance management. With the help of smart sensors, PLC systems, and digital analytics, boilers can automatically optimize air-fuel ratios, maintain stable loads, and alert operators before failures occur—lowering operating costs and increasing reliability.

Automation and real-time monitoring reduce operating costs and prevent downtime by continuously adjusting boiler performance, detecting early signs of inefficiency or failure, and enabling immediate corrective actions. Automation systems fine-tune combustion, manage load distribution, control blowdown, and stabilize pressure—all without manual intervention. Real-time monitoring tracks critical parameters like flue gas temperature, water quality, and burner status, allowing operators to address issues before they escalate. Together, these technologies minimize fuel use, reduce labor needs, extend equipment life, and ensure uninterrupted steam or heat supply.

In modern thermal systems, smart control isn’t a luxury—it’s a necessity for cost-effective, reliable operation.

Real-time monitoring and automation improve boiler efficiency and reduce unexpected downtime.True

They provide early warnings of performance issues and automatically adjust controls to optimize operation.

⚙️ Key Features of Boiler Automation Systems

FunctionDescriptionBenefit
Oxygen Trim ControlAdjusts air input to maintain optimal combustionReduces excess air and fuel use
Modulating Burner ControlMatches burner output to real-time demandPrevents short-cycling and saves energy
PID Pressure/Temperature LoopsMaintains stable steam or water conditionsImproves output consistency
SCADA/PLC IntegrationProvides centralized command and diagnosticsEnables remote and safe control
Alarm & Fault NotificationsAlerts operators to critical conditionsPrevents shutdowns and damage

With smart logic, the boiler “thinks ahead” and makes micro-adjustments for peak efficiency every second.

📊 Comparison: Manual vs. Automated Operation

ParameterManual OperationAutomated System
Combustion Efficiency78–83% (variable)85–90% (optimized)
Response Time to Load ChangeSlow (minutes)Instantaneous
Fuel ConsumptionHigher due to lagLower, due to tuning
Downtime RiskHighLow
Labor InvolvementContinuous supervisionMinimal, supervisory only

Real-time data ensures that the system remains balanced, responsive, and efficient—no matter the conditions.

Manual boiler systems are more prone to inefficiency and unexpected failures than automated systems.True

Without real-time adjustments and predictive monitoring, manual systems cannot maintain optimal performance continuously.

🧪 Case Study: Automation Retrofit in a Textile Plant

A 4 TPH oil-fired boiler operated with:

  • Manual valve adjustment

  • No O₂ control or remote alarms

  • 6.4% flue gas O₂ levels

  • 3–4 unplanned shutdowns/year

Retrofit Included:

  • PLC automation

  • O₂ trim system

  • SCADA dashboard with alerts

  • Modulating burner (10:1 turndown)

Results:

  • O₂ reduced to 3.2%

  • Efficiency increased by 7.6%

  • Unplanned downtime: zero in 12 months

  • Fuel savings: ~$42,000/year

  • Payback: < 18 months

📋 Real-Time Monitoring Parameters That Cut Costs

ParameterWhy It Matters
Flue Gas O₂ and COIndicates combustion quality
Stack TemperatureTracks heat loss or fouling
Feedwater TDS/pHPrevents scaling and corrosion
Steam Pressure TrendsDiagnoses load mismanagement
Burner Firing HoursForecasts maintenance and part life

With digital dashboards, operators get early warning signs, reducing both repair cost and risk.

🔁 How Automation Prevents Downtime

Automated FeatureFailure AvoidedPreventive Action Taken
Low Water Cutoff MonitoringTube overheating or dry-firingShuts down safely before damage occurs
Combustion MonitoringFlame failure, CO spikesReignites or adjusts air-fuel mix
Pump Status FeedbackCirculation failureSends alert and switches to backup
Alarm History LogsPattern-based predictionTriggers early service intervention

Prevention is always cheaper and safer than emergency repairs.

Summary

Automation and real-time monitoring transform boiler operation from reactive to proactive, enabling higher efficiency, better reliability, and lower costs. By continuously tracking performance and adjusting key variables, these systems eliminate guesswork, prevent damage, and keep boilers operating at their peak. For energy-intensive operations, the investment in automation pays for itself many times over through fuel savings, uptime gains, and peace of mind. In today’s energy landscape, smart boilers are efficient boilers—and efficient boilers protect your bottom line.

🔍 Conclusion

Optimizing an industrial steam boiler isn’t a one-time upgrade—it’s a continuous process that involves monitoring, maintenance, and modernization. By addressing combustion efficiency, heat loss, and water quality, companies can lower energy bills, reduce emissions, and increase system reliability. Long-term, this means greater profitability, reduced environmental impact, and stronger performance in demanding industrial environments.


📞 Contact Us

💡 Need expert support in optimizing your steam boiler? Our engineering team provides energy audits, combustion tuning, water treatment consulting, and automation solutions designed for industrial steam systems.

🔹 Contact us today to improve your steam boiler’s efficiency and cut operating costs—without compromising output! ♨️📉✅

FAQ

What are the best strategies to optimize industrial steam boiler performance?

Key strategies include:

  • Regular burner tuning and combustion control

  • Proper air-to-fuel ratio management

  • Installing economizers and heat recovery systems

  • Routine maintenance of heat exchange surfaces

  • Insulating steam lines and reducing heat loss

How does combustion control reduce operating costs?

Installing oxygen trim systems and automated burner management ensures precise fuel-air mixing, preventing both fuel waste and incomplete combustion. Efficient combustion can improve boiler efficiency by 2–5%, significantly lowering fuel bills.

Can heat recovery systems help cut energy expenses?

Yes. Economizers recover heat from flue gases to preheat feedwater, while blowdown heat recovery units reduce energy loss during boiler blowdown. These systems can increase overall efficiency by 5–10% and reduce annual fuel consumption.

Why is routine maintenance important for cost savings?

Maintenance prevents scale, soot, and sludge buildup, which reduce heat transfer efficiency. Cleaning boiler tubes, inspecting gaskets, and testing controls help maintain peak performance, reduce fuel use, and prevent costly breakdowns.

How does load management influence boiler efficiency?

Running boilers close to their optimal load (typically 70–90%) maximizes efficiency. Avoiding short-cycling and using modulating burners help match steam output with demand, reducing energy waste and component wear.

References

  1. Industrial Boiler Energy Optimization Guidehttps://www.energy.gov

  2. Combustion Efficiency and Tuning Best Practiceshttps://www.sciencedirect.com

  3. Heat Recovery Techniques for Steam Systemshttps://www.researchgate.net

  4. Steam Boiler Maintenance Checklisthttps://www.epa.gov

  5. Air-to-Fuel Ratio Optimization in Boilershttps://www.bioenergyconsult.com

  6. Insulation and Heat Loss Controlhttps://www.mdpi.com

  7. Steam Load Management Strategieshttps://www.energysavingtrust.org.uk

  8. O₂ Trim Systems and Real-Time Monitoringhttps://www.automation.com

  9. Economizer Efficiency Benefitshttps://www.iea.org

  10. Steam Boiler Optimization Standards (ASME PTC)https://www.asme.org

Wade Zhang

CEO of Taishan Group Taian Boao International Trade Co., Ltd. 30 years experience in Global industrial boiler market,  Over 300 boiler projects experience, including 21+ EPC projects. Projects span 30+ countries & regions, involving industries such as nuclear power, energy & electricity, municipal heating, mining, textiles, tires etc.

How to Optimize Industrial Steam Boiler Performance for Lower Operating Costs Read More »

Upfront and Long-Term Costs of an Industrial Oil-Fired Boiler

Upfront and Long-Term Costs of an Industrial Oil-Fired Boiler

When investing in an industrial oil-fired boiler, many buyers focus on the initial purchase price—but fail to consider the full spectrum of operating, maintenance, and lifecycle costs. While oil-fired systems are known for their high energy density, quick response, and reliability, ignoring long-term expenses can lead to budget overruns, low ROI, or unexpected downtime. Understanding both upfront and ongoing costs is essential to making a smart, financially sound boiler investment.

The upfront costs of an industrial oil-fired boiler include the equipment price, installation, foundation work, auxiliary systems (burners, pumps, chimneys), and compliance-related fees. Long-term costs include fuel expenses, preventive maintenance, spare parts, efficiency losses, emissions compliance, and eventual system upgrades or replacement. Over a typical 15–25 year lifespan, operational and fuel costs often exceed the initial capital investment, making lifecycle analysis crucial for informed purchasing decisions.

Below is a breakdown of the cost structure you need to consider when evaluating an oil-fired boiler investment.

WNS Oil Gas (7)

What Are the Typical Upfront Costs of Purchasing and Installing an Oil-Fired Boiler?

Switching to or installing an oil-fired boiler can provide efficient heating for industrial, commercial, and residential applications—but it also comes with substantial upfront costs. These include not just the boiler itself, but also auxiliary components like oil tanks, burners, controls, piping, chimney upgrades, and installation labor. For buyers and engineers planning a new system or replacing an aging one, understanding these cost drivers is essential for budgeting and selecting the most suitable unit. Total cost varies significantly based on size, pressure rating, application, and site-specific requirements.

The typical upfront cost of purchasing and installing an oil-fired boiler ranges from $4,000 to $25,000 for residential and small commercial systems, and from $50,000 to over $250,000 for larger industrial units. These figures include the boiler unit, oil burner, fuel tank, flue system, and full installation. Additional costs such as permits, plumbing, electrical work, and site modifications can add 10–30% to the base price. System complexity, thermal output (BTU or kW), efficiency rating, and controls integration also influence the final investment.

The right boiler is an investment—not just in heating, but in long-term performance, reliability, and operational savings.

The upfront cost of an oil-fired boiler includes more than just the boiler unit—it also involves installation and auxiliary components.True

Piping, oil tanks, burner systems, controls, and labor all contribute significantly to the total cost.

💰 Typical Cost Breakdown for Oil-Fired Boiler Installation

Component/ServiceResidential/Light Commercial ($)Industrial (2–10 TPH) ($)
Boiler Unit (incl. burner)$3,000 – $10,000$35,000 – $150,000
Fuel Storage Tank (500–5,000 L)$1,000 – $5,000$10,000 – $30,000
Flue/Chimney System Upgrade$500 – $3,000$5,000 – $15,000
Piping, Valves, Fittings$800 – $3,000$10,000 – $30,000
Controls & Safety Devices$500 – $2,000$7,000 – $20,000
Installation Labor$2,000 – $5,000$15,000 – $50,000
Permits/Compliance$200 – $1,000$1,000 – $5,000

Total Typical Range:

  • Residential/Commercial: $7,000 – $25,000

  • Industrial Scale: $50,000 – $250,000+

Installing an oil-fired boiler usually requires flue upgrades and safety system integration, increasing total cost.True

New systems must comply with local codes for exhaust, emissions, and safety shutdown protocols.

🔧 Factors That Influence Upfront Costs

FactorDescriptionImpact on Cost
Boiler Size (Output Rating)Higher BTU/hr or TPH → larger, more expensive unitsMajor
Fuel Storage VolumeOnsite storage capacity for oilModerate
Efficiency RatingHigh-efficiency condensing boilers cost more upfrontModerate
Boiler TypeFire tube, water tube, condensing, low/high pressureMajor
Control System ComplexityPLC/SCADA integration, oxygen trim, modulating burnerModerate–High
Site ConditionsRetrofitting vs. new installationHigh (retrofit)
Permit & Regulatory ComplianceDepends on location and emissions limitsVariable

📊 Example Scenarios

ApplicationBoiler SizeEstimated Installed CostNotes
Home heating80,000 BTU/hr$6,000 – $9,000Basic hot water boiler with tank
Small commercial office250,000 BTU/hr$12,000 – $20,000With 1,000L tank and digital controls
Mid-size factory1.5 TPH$65,000 – $110,000Fire tube with mechanical modulation
Large industrial plant5 TPH$160,000 – $250,000Water tube with advanced control suite

These figures can vary by region, manufacturer, installation contractor, and regulatory environment.

High-efficiency oil-fired boilers cost more initially but can yield long-term fuel savings.True

Condensing and modulating designs can cut fuel use by 10–20%, offsetting higher upfront costs over time.

📋 Additional Cost Considerations

ItemEstimated Cost ImpactRequired?
Oil Pump/Transfer System$1,000 – $5,000 (industrial)Yes (large tanks)
Remote Monitoring Controls$1,500 – $8,000Optional
Thermal Insulation$500 – $3,000Yes
Commissioning & Tuning$1,000 – $3,500Yes
Training & Documentation$500 – $2,000Often required

Industrial users should also budget for annual inspection, spare parts, and extended warranties.

Summary

The upfront cost of purchasing and installing an oil-fired boiler depends heavily on system size, site conditions, fuel storage, efficiency goals, and integration needs. While small systems may cost under $10,000 installed, industrial installations can exceed $250,000. A well-specified system with appropriate burner and control configuration ensures efficient, compliant operation—and reduces fuel waste for years to come. In combustion heating, upfront investment is the foundation of long-term performance.

What Auxiliary Equipment and System Components Add to Capital Expenses?

When budgeting for a new boiler system, focusing solely on the boiler unit itself significantly underestimates the total investment. The real capital cost includes a wide range of auxiliary equipment and system components that are essential for safe, efficient, and reliable operation. From fuel handling and water treatment to control systems, pumps, and stack components, each piece adds to the total installation cost. In many projects, these supporting systems account for 30–70% of total capital expenditures depending on the application and level of automation.

Auxiliary equipment and system components add to capital expenses by providing the critical support functions required for boiler safety, fuel delivery, water conditioning, emissions control, and performance monitoring. These include fuel storage tanks, water treatment units, economizers, air compressors, deaerators, pumps, blowdown systems, and control panels. Together, they ensure that the boiler operates at peak efficiency, meets regulatory requirements, and maintains long-term reliability. While the boiler may be the centerpiece, it is these components that complete the system—and collectively, they often exceed the base cost of the boiler itself.

Capital planning for a boiler system must consider the entire thermal ecosystem—not just the combustion chamber.

Auxiliary equipment for boilers can significantly increase the total capital cost beyond the base boiler unit price.True

Supporting components like tanks, pumps, water treatment systems, and controls are essential and often comprise a major portion of project costs.

🔧 Key Auxiliary Components That Add to Capital Expenses

ComponentPurposeTypical Cost Range (USD)
Fuel Storage TanksStores oil, gas, biomass, or RDF fuel$1,000 – $30,000+
Fuel Pump/Transfer SystemMoves fuel from storage to burner$2,000 – $10,000
Feedwater SystemPumps and preheats water into the boiler$3,000 – $50,000
DeaeratorRemoves oxygen from feedwater to prevent corrosion$10,000 – $60,000
Water Softener/RO SystemPrevents scale and fouling on heat transfer surfaces$5,000 – $50,000
Economizer (Heat Recovery)Recovers flue gas heat to preheat feedwater$8,000 – $80,000
Blowdown SeparatorSafely handles water discharge under pressure$3,000 – $20,000
Condensate Return TankCollects and recycles steam condensate$2,000 – $15,000
Stack/Chimney SystemSafely vents flue gases$5,000 – $40,000
Flue Gas Analyzer/SensorsMonitors O₂, CO, NOₓ for combustion optimization$2,000 – $15,000
Control Panel/PLC SystemManages boiler operation and interlocks$5,000 – $35,000
Air Compressor/BlowerSupplies combustion and atomizing air$3,000 – $25,000

Economizers and water softeners are optional and do not impact overall system efficiency.False

Both are critical components—economizers improve thermal efficiency, and softeners prevent scale buildup that reduces heat transfer.

📊 Example: Capital Breakdown for a 3 TPH Oil-Fired Boiler

Cost ElementApproximate Cost (USD)Share of Total (%)
Boiler Unit + Burner$70,000~40%
Fuel Tank + Transfer System$20,000~11%
Feedwater Pumps + Deaerator$18,000~10%
Water Softening System$12,000~7%
Economizer$15,000~9%
Control & Instrumentation$12,000~7%
Stack and Draft System$10,000~6%
Blowdown & Condensate Systems$8,000~5%
Piping, Insulation, Valves$12,000~7%
Total Installed System~$177,000100%

This example shows that auxiliaries make up 60%+ of total installed cost, especially in industrial settings with high-performance expectations.

📋 Critical Auxiliary Systems by Function

1. Fuel Handling & Delivery

ComponentUse Case
Oil Storage TankEnsures continuous fuel supply
Transfer PumpsMaintain stable burner pressure
Fuel HeaterRequired for heavy oils

2. Water Treatment & Feedwater Management

ComponentFunction
Water SoftenerRemoves calcium/magnesium
RO UnitReduces TDS and silica
DeaeratorEliminates dissolved oxygen
Feed PumpsEnsure constant flow to boiler

3. Heat Recovery & Emissions Control

ComponentFunction
EconomizerRecovers heat from flue gases
Condensing EconomizerFor high-efficiency recovery
Flue Gas MonitorOptimize air/fuel ratio, reduce NOₓ

4. Control & Safety Systems

ComponentPurpose
PLC + SCADAAutomates control and logging
InterlocksEnsures safe startup/shutdown
Flame SafeguardsDetects flameouts, triggers shutdown

Boiler systems must include safety interlocks and automated controls to comply with industrial codes.True

Codes like NFPA 85 and ASME CSD-1 require safety devices that ensure safe operation under all conditions.

🧠 Additional Considerations

Cost DriverDescription
Redundancy RequirementsDual pumps, backup PLCs = higher capex
Emission Compliance EquipmentSCR systems, particulate filters if mandated
Building ModificationsFoundations, roofs, ventilation upgrades
System Integration CostsIntegration with plant-wide SCADA/DCS systems
Commissioning & TestingSetup, tuning, training

These indirect components and services can add 10–20% to the final capital cost.

Summary

While the boiler unit may appear as the centerpiece of a thermal energy system, it is the auxiliary equipment and infrastructure that make it work efficiently and safely. From fuel storage and water treatment to economizers and instrumentation, these components are indispensable—and together, they often exceed the boiler’s own cost. For a successful installation, stakeholders must budget for the entire thermal ecosystem, not just the boiler itself. In combustion systems, the power lies not just in the flame—but in everything supporting it.

How Do Fuel Costs Impact the Long-Term Operating Budget of Oil-Fired Boilers?

In oil-fired boiler systems, fuel is not just a consumable—it’s the dominant operating expense. While the initial cost of buying and installing the boiler is significant, the long-term operating budget is largely shaped by how much oil the system burns, how efficiently it operates, and how much the fuel costs. For facilities that rely on boilers for heating or steam production, even small changes in oil prices or boiler efficiency can lead to massive swings in annual operating expenses.

Fuel costs have a major impact on the long-term operating budget of oil-fired boilers because they make up 70% to 90% of total operating expenses over the system’s lifespan. The more oil the boiler burns—and the higher the price per liter—the more expensive it is to run. Inefficient boilers use more fuel, which increases costs. Over 10 to 15 years, fuel expenses can be several times higher than the original boiler price. Managing these costs through fuel-efficient equipment, regular maintenance, and performance optimization is critical for budget control.

If you’re running an oil-fired boiler, fuel costs are the most important number on your balance sheet.

Fuel costs represent the majority of lifetime operating expenses for oil-fired boilers.True

Fuel often accounts for more than 80% of the total cost of operating an oil-fired boiler over its useful life.

📉 What Portion of the Operating Budget Is Fuel?

Cost CategoryPercentage of Total Operating Budget
Fuel70–90%
Maintenance & Repairs5–10%
Labor/Operation3–7%
Water Treatment1–3%
Permits & Insurance<2%

Fuel is by far the biggest cost driver, especially in boilers that run for thousands of hours per year.

💰 Example: Annual Fuel Cost Calculation

Let’s say a boiler produces 5,000 kg of steam per hour and operates 6,000 hours per year.
The boiler’s efficiency is 85%, and it burns fuel oil with an energy value of 42 MJ/kg.
Fuel price is $0.78 per kg.

Annual Fuel Consumption:

  • Total heat needed per year = 5,000 kg/h × 6,000 h = 30 million kg steam

  • Approximate energy needed = ~67,000 GJ per year

  • Fuel required = 67,000 GJ ÷ (42 MJ/kg × 0.85) ≈ 1.88 million kg

  • Annual fuel cost = 1.88 million kg × $0.78 = $1.47 million

Even a small increase in oil price or drop in boiler efficiency would increase this cost significantly.

📊 Fuel Price Fluctuation Impact

Fuel Price ($/kg)Annual Fuel Cost (USD)
0.70$1.32 million
0.78$1.47 million
0.90$1.70 million
1.00$1.89 million

A 10% increase in fuel price could add $147,000 or more to the annual budget.

Boiler efficiency and fuel price are the two most important factors in controlling fuel cost.True

Lower efficiency means more fuel is burned for the same heat output, and fuel price directly multiplies the total cost.

🔁 How Efficiency Affects Fuel Cost

Boiler Efficiency (%)Annual Fuel Cost (USD)
90$1.39 million
85$1.47 million
80$1.56 million
75$1.66 million

Every 5% drop in efficiency can raise fuel expenses by $80,000 to $100,000 per year.

🧪 Case Study: Industrial Plant Fuel Cost Control

A manufacturing facility operated a 3 TPH oil-fired boiler at 82% efficiency. Annual fuel cost was $760,000.

Upgrades:

  • Installed oxygen trim system

  • Added economizer

  • Tuned burner for lower excess air

Result:

  • Efficiency increased to 88%

  • Annual fuel cost dropped to $695,000

  • Savings: $65,000/year

  • Upgrade payback: Under 2 years

📋 Strategies to Control Long-Term Fuel Costs

StrategyFuel Cost Impact
Install High-Efficiency BoilerReduces fuel use by 5–15%
Add EconomizerRecovers waste heat, improves efficiency
Perform Regular MaintenanceKeeps heat transfer surfaces clean
Tune Burner & ControlsReduces excess air and combustion loss
Use Modulating BurnerImproves part-load performance
Negotiate Fuel Supply ContractsLocks in lower prices, improves budgeting

Improving combustion efficiency by just 5% can save tens of thousands in annual fuel costs.True

More efficient combustion reduces the amount of fuel needed for the same output, lowering total consumption.

Summary

In oil-fired boiler systems, fuel cost is the number one operating expense—and it adds up fast. Systems that burn more oil than needed, operate at low efficiency, or fail to recover waste heat end up costing far more over time. Managing these costs through smart upgrades, good maintenance, and efficient operation isn’t just optional—it’s essential. Over 10 to 15 years, even a small improvement in efficiency can save hundreds of thousands of dollars. In the world of boiler operation, your fuel strategy is your financial strategy.

What Are the Routine Maintenance, Inspection, and Repair Costs for Oil-Fired Boilers?

An oil-fired boiler system is a significant investment—and like any high-performance machine, it must be properly maintained to operate safely, efficiently, and economically. Routine maintenance, inspections, and occasional repairs are essential for preventing breakdowns, extending equipment life, and minimizing fuel waste. While these costs are often smaller than fuel expenses, they can still add up over time, especially if unexpected repairs occur or maintenance is neglected. Understanding the typical costs and service intervals helps operators plan realistic annual budgets and avoid costly surprises.

Routine maintenance, inspection, and repair costs for oil-fired boilers typically range from $500 to $2,000 annually for residential/light commercial units, and from $5,000 to $25,000 or more per year for larger industrial systems. These costs cover scheduled servicing, inspections, parts replacement, cleaning, water treatment, and emergency repairs. Costs vary based on boiler size, duty cycle, fuel quality, regulatory requirements, and the use of service contracts. Preventive maintenance helps reduce repair frequency and improves reliability—protecting both operational uptime and long-term asset value.

Boiler maintenance is not just a technical task—it’s a financial safeguard.

Routine maintenance reduces the risk of costly breakdowns and helps ensure long-term reliability of oil-fired boilers.True

Scheduled inspections and cleaning prevent buildup, wear, and system failures that could lead to expensive emergency repairs.

🧰 Typical Maintenance Tasks and Frequency

Maintenance TaskFrequencyDescription
Burner Inspection & CleaningQuarterly to annuallyClean nozzle, adjust flame pattern, check ignition
Flue and Stack CleaningAnnually or biannuallyRemove soot buildup to restore draft and efficiency
Fuel Filter ReplacementEvery 3–6 monthsPrevent clogging and burner malfunction
Pump & Motor LubricationEvery 3 monthsReduce wear on circulating and fuel transfer pumps
Water Treatment CheckWeekly or dailyPrevent scaling and corrosion
Boiler BlowdownDaily to weeklyRemove impurities and control TDS in water
Safety Valve TestingAnnuallyEnsure overpressure protection system functions properly
Combustion AnalysisSemiannually to annuallyMeasure O₂, CO, and flue gas temp for tuning
Gasket & Seal ChecksEvery service cyclePrevent fuel and flue leaks
Instrumentation CalibrationAnnuallyMaintain accuracy of temperature and pressure readings

Failing to regularly clean burners and flue passages can increase fuel consumption and reduce safety.True

Soot buildup and poor flame control cause incomplete combustion and can lead to dangerous operating conditions.

💰 Typical Annual Maintenance and Repair Cost Ranges

Boiler TypeSystem SizeAnnual Maintenance Budget (USD)
Residential Oil Boiler80,000–150,000 BTU/hr$400 – $800
Small Commercial System250,000–500,000 BTU/hr$800 – $2,000
Industrial Unit (1–3 TPH)1–3 TPH (~700–2,000 kW)$5,000 – $12,000
Large Industrial (>5 TPH)5–20 TPH$10,000 – $25,000+

These estimates include parts, labor, testing, cleaning materials, and consumables (like filters and chemicals).

📉 Cost of Delayed or Inadequate Maintenance

IssueCausePotential Repair Cost
Burner FailureDirty nozzle or pump$1,000 – $3,000
Tube Fouling/ReplacementWater scaling or soot buildup$2,000 – $15,000+
Flue BlockageLack of chimney/stack cleaning$500 – $2,000
Pump FailureSeal or motor degradation$1,200 – $5,000
Control Panel FaultSensor calibration drift or short$1,000 – $8,000

Neglected maintenance can lead to emergency shutdowns, compliance violations, and even boiler explosions in extreme cases.

Proactive maintenance is more cost-effective than reactive repair in oil-fired boiler systems.True

Preventive upkeep reduces total lifecycle costs by minimizing downtime and avoiding emergency service rates.

📋 Inspection and Compliance Costs

Type of InspectionRequired ForEstimated Cost (USD)
Annual Safety InspectionPressure vessel certification$500 – $2,000
Combustion Tuning ReportEmissions compliance (NOₓ, CO)$300 – $1,500
Insurance Boiler InspectionRequired for coverage renewal$200 – $800
Stack Emissions MonitoringRegulated operations (>2 TPH)$500 – $3,000 annually

Some regions require quarterly or semi-annual testing, especially for larger units or those in emission-controlled zones.

🧪 Case Study: Maintenance Contract vs. Ad Hoc Repairs

A hospital operated a 3 TPH oil-fired boiler for laundry and space heating.

Without Contract:

  • 2 emergency burner repairs: $6,400

  • Pump replacement: $3,500

  • Stack blockage: $1,800

  • Total annual cost: $11,700

With Preventive Contract (Next Year):

  • Quarterly service visits

  • Burner tuning and flue cleaning

  • Pump inspection/lubrication

  • Annual cost: $7,400

  • Downtime reduced by 80%

  • Fuel efficiency improved 4.2%

The preventive plan resulted in $4,300 savings and higher system uptime.

Summary

Routine maintenance, inspection, and repairs are essential to the reliable, efficient operation of oil-fired boilers. These costs—though relatively modest compared to fuel expenses—can escalate quickly if ignored. From burner cleaning and water treatment to flue inspections and control calibration, each maintenance action adds years to the equipment’s life and reduces total operating cost. Investing in proactive service plans, skilled technicians, and performance monitoring not only ensures safety but protects the bottom line. In thermal systems, maintenance is not a cost—it’s an investment in uninterrupted performance.

How Do Efficiency Losses, Aging Components, and Scaling Affect Lifecycle Costs?

An oil-fired boiler’s lifecycle cost is determined not just by how much it costs to purchase and install, but by how well it performs over 10, 15, or 20 years of operation. While the initial capital outlay is significant, most long-term expenses are operational—and many are driven by efficiency degradation, scaling, and wear and tear on aging components. Over time, even well-built systems suffer from combustion drift, heat transfer losses, and part fatigue. If these issues are not proactively addressed, they can lead to dramatically higher fuel usage, unplanned repairs, and premature system failure, all of which inflate total lifecycle costs.

Efficiency losses, aging components, and internal scaling significantly affect lifecycle costs by reducing heat transfer performance, increasing fuel consumption, accelerating maintenance needs, and shortening boiler lifespan. As efficiency drops, more fuel is required to produce the same thermal output, leading to higher annual operating costs. Worn-out burners, pumps, and control systems add downtime and repair costs, while scaling on water-side surfaces forces boilers to work harder, degrading both performance and reliability. These factors can increase lifecycle costs by 30–50% if left unmanaged.

In oil-fired systems, the slow, silent erosion of efficiency can cost more than any upfront price tag.

Efficiency degradation and internal scaling can significantly increase total operating costs over the lifecycle of an oil-fired boiler.True

Heat transfer losses force the boiler to burn more fuel, and aging parts increase repair frequency and system downtime.

📉 Efficiency Loss Over Time: The Hidden Cost Curve

Boiler Age (Years)Efficiency (%)*Typical Efficiency LossAdditional Fuel Cost Impact (%)
1–385–88%Baseline0%
4–782–85%–3%+4–6%
8–1278–82%–6–8%+10–12%
13–1575–78%–10%++15–18%

*Assuming no upgrades or deep maintenance. These losses are due to soot, burner drift, scaling, and part wear.

A 10% drop in boiler efficiency can increase fuel costs by over 15% annually.True

As less heat is transferred to water or steam, more fuel is required to achieve the same output.

🧱 Impact of Scaling on Heat Transfer and Costs

Scale Thickness (mm)Heat Transfer Loss (%)Fuel Cost Increase (%)Risk Level
0.5~3–5%~2–4%Moderate
1.0~10–12%~6–8%High (potential overheating)
2.0+>20%>12–15%Critical (may cause tube rupture)

Scaling forms from poor water treatment and high hardness levels, especially in older systems without automatic blowdown or softening systems.

Water-side scale buildup acts as an insulator, reducing thermal efficiency.True

Scale reduces heat transfer and forces the burner to operate longer and at higher loads to achieve the same output.

🔧 Aging Components: Rising Repair Frequency and Cost

ComponentCommon Failure ModeTypical Replacement Cost (USD)Failure Impact
Burner NozzleWear, clogging$500 – $1,200Incomplete combustion, CO spikes
Circulating PumpMotor burnout, seal leak$1,200 – $3,000No water flow, shutdown
Pressure SensorsDrift, calibration loss$200 – $1,000Faulty control feedback
Combustion FanBearing wear, imbalance$1,500 – $4,000Poor air-fuel ratio, flame loss
Control Board/PLCElectronics degradation$2,000 – $8,000Full system shutdown, safety risk

Aging components are not only costlier to maintain—they also reduce system safety and reliability.

🧪 Lifecycle Cost Case Study: 5 TPH Boiler

System Profile:

  • 5 TPH oil-fired boiler

  • Operates 6,000 hours/year

  • Initial efficiency: 86%

  • Fuel price: $0.78/kg

Without Preventive Maintenance (After 10 Years):

  • Efficiency drops to 78%

  • Scaling present: 1 mm

  • Burner misfiring detected quarterly

  • Repairs average $6,000/year

Cumulative 10-Year Cost Difference:

Cost CategoryMaintained Boiler ($)Unmaintained Boiler ($)Difference
Fuel (10 years)$13.8 million$15.6 million$1.8M ↑
Repairs$28,000$60,000$32K ↑
Downtime Loss (est.)$0$75,000$75K ↑
Total Lifecycle Cost$13.83M$15.735M$1.9M ↑

A 10% efficiency drop and sporadic repairs added nearly $2 million in avoidable costs over 10 years.

📋 Long-Term Maintenance and Upgrade Strategies

StrategyCost Range (USD)Lifecycle Benefit
Annual Deep Cleaning$3,000 – $6,000Restores 2–6% efficiency
Water Treatment System Upgrade$10,000 – $30,000Eliminates scaling risks
Burner Retrofit/Replacement$8,000 – $25,000Improves combustion control
Efficiency Monitoring Installation$2,000 – $10,000Enables proactive tuning
PLC/Control Upgrade$5,000 – $20,000Improves system responsiveness and uptime

Upgrading controls and cleaning scaled tubes can recover lost efficiency and lower operating costs.True

Efficiency-focused upgrades reduce fuel use and delay expensive boiler replacement.

Summary

Over a boiler’s lifespan, efficiency losses, internal scaling, and aging parts can quietly but significantly increase total operating costs. These issues force boilers to consume more fuel, fail more frequently, and perform less reliably—creating budget stress and operational risk. Regular descaling, burner tuning, component replacement, and water treatment are essential to avoid the compounding effects of deterioration. By maintaining peak thermal performance and component reliability, operators can preserve efficiency, extend system life, and reduce total lifecycle costs. In oil-fired systems, the cost of inaction is measured in fuel barrels, repair bills, and lost opportunity.

What Is the Estimated ROI or Payback Period for an Oil-Fired Boiler System?

When deciding to invest in an oil-fired boiler system, one of the most important financial questions is: how long will it take to recover the money spent through fuel savings and operational benefits? This is called the payback period. The return on investment (ROI) helps determine how much value the system brings compared to what was spent. These calculations are influenced by the cost of the system, how much fuel it saves every year, how often it’s used, and the price of oil.

The estimated payback period for an oil-fired boiler system is typically between 2 and 7 years. This depends on the cost of the boiler, how much fuel is saved each year, and how often the system is in operation. For larger systems or systems that operate continuously, the payback period is shorter—often between 2 to 4 years. Smaller or less-used systems might take 5 to 7 years. The return on investment improves when the boiler runs efficiently and fuel prices are high.

The faster your system pays itself off, the sooner you begin to benefit from real cost savings.

The payback period of an oil-fired boiler depends on annual fuel savings and system utilization.True

Higher utilization and improved efficiency yield quicker returns through reduced fuel costs.

💡 How to Understand Payback and ROI in Simple Terms

To estimate the payback period, divide the total cost of installing the boiler by how much money you save each year in fuel.

Simple Payback Formula:

  • Payback Period (in years) = Cost of the system ÷ Annual fuel savings

To estimate the ROI (Return on Investment), divide your annual fuel savings by the cost of the system and multiply by 100 to get a percentage.

Simple ROI Formula:

  • ROI (%) = (Annual fuel savings ÷ Cost of the system) × 100

📊 Example Scenarios

Type of InstallationInstalled CostYearly Fuel SavingsPayback PeriodROI (%)
Small Commercial Building$20,000$3,0006.7 years15%
Medium Industrial (3 TPH)$120,000$25,0004.8 years20.8%
High-Efficiency Industrial$200,000$60,0003.3 years30%
Retrofit with Economizer$40,000$14,0002.9 years35%

Larger systems that run more often usually have faster payback and higher ROI.

🛠️ What Helps You Get Faster Payback?

FactorHow It Helps
Using the boiler many hoursMore fuel saved = more money saved
High-efficiency equipmentLess fuel used = lower running cost
Burner with 10:1 turndown ratioAdjusts better to changing loads
Adding a heat recovery systemReuses waste heat to save even more fuel
Fuel price is highEach liter of saved fuel is worth more

Adding a flue gas economizer significantly improves boiler payback by reducing stack heat loss.True

Economizers recover waste heat to preheat feedwater or air, directly reducing fuel consumption.

🧪 Case Study: 5 TPH Boiler Upgrade

Before Upgrade:

  • Efficiency: 78%

  • Annual Fuel Cost: $1,320,000

After Installing New Boiler (85% efficiency + economizer):

  • Annual Fuel Cost: $1,210,000

  • Annual Savings: $110,000

  • Cost of New System: $320,000

Payback Period:
$320,000 ÷ $110,000 = 2.9 years

ROI:
($110,000 ÷ $320,000) × 100 = 34%

This means the system pays itself back in under 3 years and delivers strong financial benefits afterward.

Summary

The payback period and ROI of an oil-fired boiler system help you understand when your investment starts saving money. Most systems recover their cost in 2 to 7 years, depending on usage, fuel efficiency, and oil prices. High-efficiency systems and those used continuously deliver the fastest return. With smart design, good controls, and proper maintenance, your oil-fired boiler can be a high-value asset that pays for itself—and then pays you back.

🔍 Conclusion

An industrial oil-fired boiler represents a significant long-term investment, where the initial purchase price is just the beginning. Operational efficiency, fuel pricing trends, maintenance strategy, and equipment lifespan all play major roles in the total cost of ownership. A well-chosen, high-efficiency boiler—backed by a reliable maintenance plan—can yield substantial long-term savings and performance stability. Always compare total lifecycle costs, not just upfront figures, when making procurement decisions.


📞 Contact Us

💡 Need help evaluating the total cost of a new oil-fired boiler? Our team offers cost modeling, fuel consumption analysis, and ROI forecasting to guide your investment.

🔹 Talk to us today and ensure your oil-fired boiler investment delivers long-term value and performance! 🛢️💰📈

FAQ

What is the average upfront cost of an industrial oil-fired boiler?

The upfront cost typically ranges from $30,000 to $250,000 depending on the boiler’s capacity (TPH or BTU/hr), pressure rating, automation level, and compliance features (e.g., low-NOx). Installation can add $10,000–$100,000, covering piping, controls, and safety systems.

What are the long-term fuel costs for oil-fired boilers?

Fuel accounts for the majority of ongoing expenses. With heating oil prices averaging $3–$4 per gallon, a mid-sized industrial boiler consuming 1,000–3,000 gallons per day can incur $1M+ annually in fuel costs, depending on efficiency and load.

How much does maintenance cost over the boiler’s lifetime?

Annual maintenance—including inspections, burner tuning, tube cleaning, and parts replacement—typically costs 2–5% of the boiler’s capital cost per year. Over a 20-year lifespan, this can total $30,000–$150,000 or more.

Are there hidden or indirect costs to consider?

Yes. Indirect costs include:

  • Downtime and lost productivity during maintenance or failure

  • Emissions compliance upgrades (e.g., SCR or low-NOx retrofits)

  • Insurance and permitting fees

  • Operator training and certifications

How do oil-fired boilers compare with other fuel types in total cost of ownership (TCO)?

Oil-fired boilers have higher fuel costs and moderate maintenance needs, but benefit from reliable heat output and ease of installation. Compared to gas or biomass systems, they generally offer lower upfront cost but higher lifecycle fuel expense. TCO must weigh fuel availability, emissions regulations, and efficiency upgrades.

References

  1. Boiler Cost Estimation Guidehttps://www.energy.gov

  2. Fuel Oil Pricing Trends and Projectionshttps://www.eia.gov

  3. Industrial Boiler Installation and Maintenance Costshttps://www.sciencedirect.com

  4. Oil-Fired Boiler Lifecycle Economicshttps://www.researchgate.net

  5. Heating Oil Market Analysishttps://www.bloomberg.com

  6. Maintenance Best Practices for Oil Boilershttps://www.epa.gov

  7. Boiler Efficiency and Total Cost of Ownershiphttps://www.bioenergyconsult.com

  8. Industrial Boiler Emissions Compliance Costshttps://www.mdpi.com

  9. Long-Term Boiler Operation Planninghttps://www.iea.org

  10. Boiler Fuel Comparison and TCO Analysishttps://www.energysavingtrust.org.uk

Wade Zhang

CEO of Taishan Group Taian Boao International Trade Co., Ltd. 30 years experience in Global industrial boiler market,  Over 300 boiler projects experience, including 21+ EPC projects. Projects span 30+ countries & regions, involving industries such as nuclear power, energy & electricity, municipal heating, mining, textiles, tires etc.

Upfront and Long-Term Costs of an Industrial Oil-Fired Boiler Read More »

Key Factors Influencing Heat Transfer and Combustion Efficiency in Industrial Power Plant Boilers

Key Factors Influencing Heat Transfer and Combustion Efficiency in Industrial Power Plant Boilers

In power generation, industrial power plant boilers are at the core of converting fuel energy into electrical or mechanical power. Achieving high combustion and heat transfer efficiency is essential not only for maximizing output but also for minimizing fuel costs, emissions, and equipment wear. Inefficient combustion or poor heat transfer can result in fuel wastage, reduced output, boiler fouling, and unplanned shutdowns. Understanding the key influencing factors allows operators to optimize performance, reduce operating costs, and meet environmental targets.

The heat transfer and combustion efficiency in industrial power plant boilers are influenced by factors such as fuel quality, air-to-fuel ratio, furnace and burner design, flue gas temperature, slagging and fouling behavior, ash content, and the condition of heat exchanger surfaces. Effective combustion requires precise control of air supply and fuel delivery, while high heat transfer efficiency depends on clean and well-maintained heating surfaces, appropriate boiler loading, and balanced flue gas velocities.

Let’s break down the critical parameters that determine how efficiently power plant boilers operate.

How Does Fuel Type and Calorific Value Affect Combustion Efficiency in Power Boilers?

In power boilers, not all fuels are created equal. Different fuels bring different combustion characteristics, chemical compositions, and energy contents—making them perform very differently under identical conditions. Whether it’s natural gas, coal, biomass, or waste-derived fuels, the type of fuel and its calorific value (CV) directly impact flame temperature, combustion duration, fuel handling requirements, and ultimately, boiler efficiency. Poorly matched fuels can cause incomplete combustion, high emissions, and frequent maintenance, while properly matched fuels support cleaner, more efficient energy conversion.

Fuel type and calorific value affect combustion efficiency by determining how much energy is released per unit of fuel, how completely it can be burned, and how it interacts with boiler heat transfer surfaces. High-calorific fuels provide more thermal energy per unit, reducing fuel input and increasing flame stability. Low-calorific fuels often require higher mass flow, produce more ash, and lower flame temperature, which reduces combustion completeness and efficiency. Matching boiler design and burner configuration to the fuel’s properties ensures optimal heat release and minimal losses.

To maximize efficiency, it’s not just about burning fuel—it’s about burning the right fuel in the right way.

The calorific value of a fuel directly influences how efficiently it can be converted to heat in a boiler.True

Higher calorific value fuels produce more energy per unit mass, enabling higher flame temperatures and more complete combustion.

🔥 What Is Calorific Value (CV) and Why It Matters

Calorific value is the amount of heat energy released when a given quantity of fuel is burned completely. It is typically expressed in MJ/kg or BTU/lb.

Fuel TypeCalorific Value (MJ/kg)Combustion Implication
Natural Gas48–50High efficiency, clean combustion
Bituminous Coal24–30Good flame stability, high ash
Biomass (dry wood)16–19Moderate efficiency, renewable
Wet Biomass8–14Low flame temp, requires drying
RDF (Refuse-Derived Fuel)10–18Variable, often inconsistent composition

The higher the CV, the less mass is needed to deliver a specific amount of energy—resulting in better heat transfer, lower flue gas volume, and reduced emissions.

Low-calorific fuels like wet biomass increase boiler efficiency due to slower combustion.False

Low-CV fuels often reduce combustion temperature and increase the fuel mass needed, lowering efficiency and increasing handling requirements.

📉 How Fuel Type Affects Combustion Efficiency

Fuel PropertyEffect on CombustionEfficiency Impact
Moisture ContentAbsorbs heat to evaporate waterLowers flame temp and efficiency
Volatile MatterAffects ignition and burn rateHigh volatiles = faster, more complete burn
Ash ContentIncreases inert load, reduces heat transferLowers effective heat utilization
Sulfur/NitrogenAffects emissions and burner tuningRequires additional air or sorbents
Particle SizeDetermines surface area for reactionToo coarse = unburned fuel losses

Fuels with high moisture or ash significantly reduce combustion zone temperature and heat exchange efficiency—making them more expensive per unit of usable energy.

📊 Comparison of Fuel Performance in Power Boilers

Fuel TypeCV (MJ/kg)Ash (%)Moisture (%)Typical Efficiency (%)
Natural Gas~500092–94%
Bituminous Coal25–3010–155–1083–88%
Dry Biomass17–191–510–1578–85%
Wet Biomass10–141–530–5065–75%
RDF12–1815–2510–2070–80%

Lower-CV fuels require higher fuel feed rates, increase flue gas volume, and often lead to flame instability, especially during load swings.

Combustion efficiency is not affected by fuel composition as long as temperature is high enough.False

Fuel composition affects flame shape, ignition, burn time, and ash formation—all of which influence combustion efficiency.

🔧 Matching Fuel to Boiler Design

Boiler TypeBest-Suited Fuel TypesWhy It Works Well
Pulverized Coal BoilerBituminous/sub-bituminous coalHigh burn rate, stable flame
CFB BoilerBiomass, coal, sludge, RDF blendsHandles high ash/moisture, long residence time
Grate-Fired BoilerWood chips, bark, agricultural wasteGood for coarse and variable fuels
Gas-Fired Water TubeNatural gas, propaneClean, fast-response combustion

Boilers must be optimized for the physical and chemical nature of the fuel to ensure full combustion and high heat transfer rates.

🧪 Case Study: Biomass vs. Coal Comparison in 50 MW Boiler

Scenario 1 – Coal-Fired Operation:

  • Fuel: Bituminous coal, CV: 27 MJ/kg

  • Efficiency: 87.5%

  • Ash content: 11%

  • Stack temperature: 170°C

Scenario 2 – Biomass-Fired Operation:

  • Fuel: Wood chips, CV: 16.5 MJ/kg

  • Efficiency: 79.3%

  • Ash content: 2%

  • Stack temperature: 210°C

Findings:

  • Required 48% more biomass by mass to match load

  • Increased flue gas volume by 33%

  • Reduced efficiency due to lower flame temp and higher stack loss

Switching from coal to biomass without adjusting combustion settings can lead to efficiency losses.True

Biomass has different burn characteristics and requires tuning of air/fuel ratio, burner settings, and heat exchange strategies.

📋 Combustion Optimization Tips by Fuel Type

Fuel TypeOptimization StrategyPurpose
CoalPulverize for uniform ignition, manage slaggingImprove surface area and combustion control
BiomassPre-dry or blend with drier fuelBoost CV and flame stability
RDFScreen and homogenize compositionReduce volatile peaks and ash fouling
Natural GasUse modulating burners and O₂ trimEnsure tight control and low excess air

Fuel properties also affect burner design, combustion air distribution, and emission controls—all of which are critical to maintaining high efficiency.

Summary

The type of fuel and its calorific value are fundamental factors in the combustion efficiency of power boilers. High-CV, low-ash fuels like natural gas produce more heat per unit and support stable, clean combustion. Lower-CV fuels like wet biomass require more mass, reduce flame temperatures, and increase stack losses, lowering system efficiency. By selecting appropriate fuels, pre-treating when necessary, and aligning combustion strategies with fuel characteristics, operators can maximize energy output, minimize emissions, and control operating costs. In power generation, choosing the right fuel is not just about supply—it’s about efficiency and sustainability.

Why Is Controlling Excess Air and Air-Fuel Ratio Crucial for Complete Combustion?

In industrial combustion systems, achieving complete combustion means converting all fuel into usable heat while minimizing emissions. But combustion doesn’t happen automatically—it depends on having the right balance of fuel and air. Too little air leads to unburned fuel and hazardous emissions. Too much air cools the flame and wastes heat energy through the flue gas. Therefore, precise control of the air-fuel ratio and excess air is not optional—it’s essential for efficient, safe, and clean combustion.

Controlling excess air and air-fuel ratio is crucial for complete combustion because it ensures that every unit of fuel is fully oxidized, maximizing energy output while minimizing emissions. The correct air-fuel ratio supplies just enough oxygen to burn all fuel molecules. A slight amount of excess air (typically 10–20%) is used to compensate for mixing inefficiencies. Too little air causes incomplete combustion, resulting in carbon monoxide and unburned hydrocarbons. Too much air lowers flame temperature and increases stack losses. Maintaining the optimal ratio ensures stable flame, high thermal efficiency, and reduced environmental impact.

In combustion, precision equals performance—and the air-fuel balance is your most powerful tool.

Controlling excess air is necessary to achieve complete combustion and maximize thermal efficiency.True

Correct excess air ensures all fuel is burned while minimizing heat loss and emissions, which are both impacted by poor air control.

🔬 Stoichiometric Combustion: The Ideal Balance

At the stoichiometric point, the air supply contains exactly enough oxygen to react with all the fuel without leaving unburned fuel or unused oxygen.

Fuel TypeStoichiometric Air-Fuel Ratio (mass)O₂ in Flue Gas (Ideal)
Natural Gas17.2:1~2%
Fuel Oil14.5:1~3%
Coal10.5–11.5:1~4%
Biomass5–9:1 (varies with moisture)~5–8%

However, in real-world applications, a slight amount of excess air is necessary to compensate for imperfect mixing and ensure complete combustion.

Operating exactly at the stoichiometric point ensures maximum combustion efficiency.False

Real systems require some excess air to avoid incomplete combustion caused by mixing limitations and air-fuel imbalances.

📉 Effects of Air-Fuel Imbalance

ConditionFlame BehaviorEfficiency ImpactEmissions Risk
Fuel-Rich (Low Air)Yellow, smoky flameIncomplete combustion, energy lossHigh CO, soot, unburned hydrocarbons
StoichiometricHot, stable blue flameMaximum thermal energyMinimal emissions
Excess Air (Lean)Cool, slow flameHeat loss through flue gasHigher NOₓ, unburned O₂

Excess air reduces flame temperature and increases the mass of flue gas, which leads to higher stack temperatures and reduced heat transfer efficiency.

📊 Efficiency Loss from Excess Air

Excess Air (%)Flue Gas O₂ (%)Approx. Efficiency Loss (%)
10~20.5
25~41.5–2
50~83–5
100~115–8

Each additional 1% of O₂ in the flue gas above ideal corresponds to approximately 0.5–1% loss in thermal efficiency, especially in high-temperature applications like power boilers.

High excess air levels increase boiler thermal efficiency by ensuring complete combustion.False

Too much excess air cools the flame and carries heat out through the stack, decreasing overall efficiency.

🔧 Tools and Techniques for Controlling Air-Fuel Ratio

TechnologyRole in Optimization
Oxygen Trim ControllersAdjust airflow in real time based on flue gas O₂
CO/CO₂ MonitoringDetect incomplete combustion
Mass FlowmetersEnsure accurate fuel and air delivery
PID Control SystemsMaintain stable air-fuel balance
Burner TuningCalibrate for specific fuels and conditions

Automated combustion control systems combine these tools to dynamically maintain the optimal ratio, even as load or fuel quality changes.

🧪 Case Study: Industrial Steam Boiler Optimization

A 15 TPH gas-fired boiler at a food processing plant exhibited:

  • Flue gas O₂ at 6.5%

  • Stack temperature: 245°C

  • High fuel use at low loads

Actions:

  • Installed oxygen trim control

  • Tuned burner air/fuel curve

  • Adjusted damper automation

Results:

  • O₂ reduced to 3.2%

  • Stack temperature dropped to 195°C

  • Combustion efficiency increased by 7.4%

  • Annual fuel savings: ~$58,000

  • CO emissions reduced by 60%

Oxygen trim systems adjust combustion air based on real-time flue gas feedback.True

This closed-loop system maintains optimal air-fuel ratios dynamically, preventing combustion drift.

📋 Real-World Benefits of Air-Fuel Ratio Control

BenefitExplanation
Lower Fuel ConsumptionLess excess air = more energy retained
Improved Flame StabilityStable combustion reduces cycling and flameout
Reduced EmissionsLess CO, NOₓ, and unburned hydrocarbons
Higher Heat TransferHigher flame temperature = better efficiency
Increased Equipment LifeFewer hot/cold cycles and corrosion risks

These benefits compound over time, especially in large-scale or continuous operation systems.

Summary

Controlling excess air and the air-fuel ratio is one of the most effective ways to achieve complete combustion and optimize boiler performance. It ensures that all fuel is efficiently converted to heat while minimizing waste and emissions. By preventing both under- and over-aeration, operators can achieve the sweet spot of high combustion efficiency, low flue gas loss, and consistent operation. In any combustion system, air-fuel balance is the heartbeat of efficiency—and controlling it is key to clean, cost-effective energy conversion.

How Do Slagging, Fouling, and Ash Content Impact Heat Transfer Surfaces and Efficiency?

In high-temperature combustion systems, especially those burning solid fuels like coal, biomass, or waste, ash is not just a byproduct—it’s a performance-limiting factor. Ash particles from fuel impurities can deposit on heat transfer surfaces, forming insulating layers that degrade efficiency. In extreme cases, ash melts and forms molten slag, leading to tube erosion, overheating, and system failures. Slagging, fouling, and ash content are therefore critical variables that directly influence boiler performance, fuel costs, and operational reliability.

Slagging, fouling, and ash content impact heat transfer efficiency by forming insulating deposits on boiler surfaces, reducing thermal conductivity and impeding heat flow. Slagging refers to molten or partially molten ash that solidifies on high-temperature surfaces, while fouling is the accumulation of dry, sticky particulates in lower-temperature zones. These deposits reduce the effective surface area for heat exchange, increase flue gas temperatures, elevate pressure drops, and force boilers to work harder to meet demand. High ash content in fuel increases the frequency and severity of these issues, lowering combustion efficiency and raising maintenance costs.

In thermal systems, a clean surface is a performing surface—and managing ash behavior is key to sustaining efficiency.

Ash deposits on boiler surfaces reduce heat transfer efficiency and increase fuel consumption.True

Ash acts as an insulating layer, forcing more fuel to be burned to achieve the same heat output.

🧱 What Are Slagging and Fouling?

TermZone AffectedDescription
SlaggingFurnace and superheaterMolten ash fuses to surfaces and hardens
FoulingEconomizer, convection zoneDry ash particles stick to cooler surfaces
Ash ContentFuel propertyInorganic residue that does not combust, becomes slag/fouling

Slagging occurs at temperatures above 1,200°C, often around burner nozzles and flame cores. Fouling happens downstream, typically between 350–650°C, in areas like economizers and air preheaters.

📉 Efficiency Loss from Deposits

Deposit Thickness (mm)Heat Transfer Loss (%)Flue Gas Temp Increase (°C)Efficiency Loss (%)
0.54–6%+25–402–3%
1.010–12%+50–704–6%
2.0>20%+80–1207–10%

Even a thin ash layer of 1 mm can reduce boiler heat transfer efficiency by more than 10%.True

Ash insulates the tube surface, hindering heat flow into the fluid and increasing stack losses.

🧪 Case Study: Biomass CFB Slagging Impact

A 45 MW CFB boiler burning agricultural waste had:

  • Ash content: ~16%

  • High alkali content (K, Na) → low ash fusion point

  • Superheater slagging every 3–4 weeks

Impact:

  • Superheater heat transfer dropped by 18%

  • Flue gas temperature rose from 210°C to 290°C

  • Steam output dropped by 7.5%

  • Efficiency loss: ~6.2%

  • Cleaning downtime: ~8 hours/month

After switching to a lower-alkali fuel blend and installing soot blowers:

  • Cleaning frequency reduced by 60%

  • Efficiency improved by 5.4%

  • Annual savings: $73,000 in fuel and labor

🔬 Key Fuel Properties Affecting Slagging and Fouling

PropertyInfluenceImpact on Performance
Ash Content (%)More residue post-combustionMore frequent cleaning, wear, heat loss
Ash Fusion TemperatureLower values → slagging riskCauses melting, clinkering, blocked tubes
Alkali Metals (K, Na)React with silica to form slagPromotes sticky deposits and tube corrosion
Volatile MatterAffects flame shape and ash locationAlters where fouling occurs
Chlorine ContentCorrosive ash and slag formationShortens equipment lifespan

Fuels with high alkali and chlorine levels are notorious for fouling and slagging in biomass and RDF boilers.

High alkali content in biomass increases slagging risk in high-temperature combustion zones.True

Alkali metals react with silicates to form low-melting-point slag, which adheres to hot surfaces.

🔧 Mitigation Strategies for Ash-Related Issues

StrategyPurposeImplementation Frequency
Fuel BlendingReduces ash content and balances alkalisBased on fuel availability
Soot BlowersDislodge fouling layersDaily or per shift
Ash Fusion TestingPredicts slagging riskQuarterly or per batch
Additive InjectionBinds ash or changes melting behaviorContinuous
Automated Cleaning SystemsRemote tube cleaning during operationWeekly or as needed

Boiler operators often implement a combination of strategies to balance performance, cost, and downtime.

📊 Ash Content vs. Cleaning Frequency

Fuel TypeAsh Content (%)Typical Cleaning Frequency
Natural Gas0%Rare/None
Pulverized Coal10–20%Weekly to biweekly
Dry Biomass2–6%Weekly
Agricultural Waste15–30%Daily or continuous
RDF20–25%Daily + monthly deep cleaning

Fuels with higher ash content not only reduce combustion efficiency but significantly increase O&M workload and cost.

Switching to low-ash fuels can reduce boiler maintenance costs and improve heat transfer efficiency.True

Less ash means fewer deposits, better heat absorption, and lower cleaning frequency.

🧠 Smart Monitoring and Predictive Cleaning

Modern plants use diagnostic tools to manage slagging and fouling proactively.

Tool/TechnologyUse Case
Infrared CamerasDetect surface hot spots and insulation loss
Tube Wall ThermocouplesTrack deposit growth by temperature gradient
Flue Gas Temperature SensorsMonitor stack loss trends
AI Pattern RecognitionPredict fouling zones before heat drop
Acoustic Cleaning SystemsDislodge ash with sound waves

These tools allow operators to clean only when necessary, preserving boiler uptime and avoiding energy loss.

Summary

Slagging, fouling, and ash content are major factors affecting heat transfer and combustion efficiency in power boilers. Deposits act as insulators that hinder thermal flow, raise flue gas temperatures, and force the boiler to work harder to maintain output. High ash fuels increase cleaning frequency, maintenance burden, and fuel costs. By selecting appropriate fuels, monitoring ash behavior, and implementing proactive cleaning strategies, facilities can maintain clean heat surfaces, minimize energy loss, and reduce downtime. In combustion systems, efficiency is only as good as the cleanliness of the surfaces that transfer heat.

What Is the Role of Flue Gas Temperature in Identifying Heat Losses and Boiler Performance?

In every fuel-burning boiler, not all the energy released from combustion is captured. A significant portion escapes with the hot flue gases, making flue gas temperature a key diagnostic indicator of boiler efficiency and energy loss. By analyzing this temperature at the stack, operators can evaluate how effectively heat is transferred from combustion gases to the working fluid (steam or hot water). Higher-than-expected flue gas temperatures often signal poor heat absorption due to fouling, excess air, poor tuning, or under-loading. Conversely, lower (but safe) flue gas temperatures generally indicate optimal heat recovery.

Flue gas temperature plays a critical role in identifying heat losses and assessing boiler performance by revealing how much thermal energy is leaving the system unutilized. When flue gases exit the stack at high temperatures, it indicates that not enough heat has been transferred to the fluid in the boiler. This represents a direct loss of combustion energy, reducing overall thermal efficiency. Monitoring flue gas temperature helps detect inefficiencies caused by fouling, excess air, low boiler load, or poor burner performance—allowing timely corrective actions that restore efficiency and reduce fuel costs.

Simply put, the hotter your flue gas, the colder your profits.

High flue gas temperature indicates energy is being lost through the stack and suggests poor heat recovery.True

When flue gases retain too much heat, it means less thermal energy has been transferred to the process fluid, reducing efficiency.

🌡️ What Is a Normal Flue Gas Temperature?

Boiler TypeOptimal Flue Gas Temp (°C)Caution Level (°C)Action Threshold (°C)
Natural Gas Boiler120–160>180>200
Oil-Fired Boiler170–220>240>260
Coal-Fired Boiler180–250>270>300
Biomass Boiler150–230>250>280

Ideal flue gas temperatures depend on the fuel type, boiler design, and heat recovery systems. Condensing boilers, for example, aim for stack temperatures below the dew point (~55–65°C for natural gas) to reclaim latent heat.

📉 Efficiency Impact of Flue Gas Temperature

Flue Gas Temp (°C)Approx. Efficiency (%)Heat Loss via Stack (%)
120~91–93%5–6%
160~88–90%7–9%
200~85–87%10–12%
250~80–83%14–17%
300<78%>18%

Every 10°C increase in flue gas temperature corresponds to a 0.5–1% drop in boiler efficiency, especially in mid- to high-efficiency systems.

Reducing flue gas temperature too much can cause corrosion due to acid dew point condensation.True

If flue gas cools below the dew point (especially in sulfur-rich fuels), acidic condensates can form and damage boiler surfaces.

🔧 Causes of Elevated Flue Gas Temperatures

CauseDescriptionEfficiency Impact
Fouled Heat SurfacesSoot, scale, or ash insulationBlocks heat flow to water/steam
Excess Combustion AirMore air = more mass to heatCools flame, increases stack heat loss
Poor Burner TuningFlame not directed at transfer surfacesReduced effective heat transfer
Under-Loaded BoilerLess heat absorbed than designedHigh stack losses due to short residence time
Bypassed EconomizerLess heat recoveryHigher final gas temperature

📊 Flue Gas Temp vs. Stack Loss Chart

Flue Gas Temp (°C)Excess Air (%)Fuel TypeStack Heat Loss (%)
16010Natural Gas7.6
20015Fuel Oil11.2
25025Bituminous Coal15.9
30030Biomass20.4

Stack heat loss is a function of temperature and excess air, both of which should be minimized within safe limits.

Excess air and high flue gas temperature are directly correlated with stack heat losses.True

More air and hotter exhaust mean more energy leaves the boiler without doing useful work.

🧪 Case Study: Food Plant Boiler Optimization

A 10 TPH steam boiler at a dairy facility burned natural gas and showed:

  • Flue gas temperature: 245°C

  • O₂ levels: 6.8%

  • Fuel usage: 12,800 m³/day

Actions Taken:

  • Installed oxygen trim control

  • Added economizer to recover flue heat

  • Cleaned soot from fire-side tubes

Results:

  • Flue gas temp reduced to 165°C

  • O₂ trimmed to 3.5%

  • Boiler efficiency improved by 7.3%

  • Annual fuel savings: ~$49,500

📋 Tools for Monitoring Flue Gas Temperature

Tool/InstrumentPurpose
Stack ThermocouplesContinuous flue gas temp measurement
Infrared ThermographyDetects surface heat anomalies on boilers
Flue Gas AnalyzersMonitor O₂, CO, and temperature
Smart Economizer ControlModulates flow based on real-time temperature
SCADA/PLC IntegrationTracks trends and triggers efficiency alerts

Combining flue gas temperature with O₂ and CO data provides a complete picture of combustion quality and heat recovery effectiveness.

Summary

Flue gas temperature is a powerful and immediate indicator of how well a boiler is capturing and using the energy from combustion. High flue gas temperatures signal lost heat, reduced efficiency, and potential maintenance issues, while lower, stable temperatures indicate good heat transfer and optimized operation. By monitoring and minimizing flue gas temperature through tuning, cleaning, and heat recovery systems, operators can significantly reduce fuel consumption, lower emissions, and improve boiler lifespan. In thermal systems, what goes up the stack reveals what’s being left behind in performance.

How Do Load Fluctuations and Turndown Ratio Affect Thermal and Combustion Stability?

In industrial boilers and combustion systems, demand for steam or heat is rarely constant. Load variations—caused by changing process demands, shifts, or seasonal conditions—require the burner to adjust its firing rate accordingly. If the system lacks the ability to modulate smoothly over a wide range, it becomes unstable during low-load periods. This is where turndown ratio plays a critical role: it defines the system’s flexibility to operate efficiently and stably at partial loads without frequent on-off cycling, flame instability, or thermal inefficiencies.

Load fluctuations and turndown ratio affect thermal and combustion stability by determining how effectively a boiler or burner can match its output to real-time demand. A low turndown ratio limits modulation and causes frequent cycling, leading to flame instability, incomplete combustion, and increased fuel use. A high turndown ratio allows the system to operate continuously at reduced loads, maintaining stable flame conditions, efficient fuel use, and consistent heat transfer. Properly managing load swings with appropriate burner design and controls is essential for maintaining stable and efficient operation.

The better your system can adapt to changing loads, the more stable, efficient, and reliable your combustion performance will be.

A high turndown ratio helps maintain combustion stability during load fluctuations.True

It allows the burner to operate continuously at low loads without shutting down, avoiding cycling-related inefficiencies.

🔄 What Is Turndown Ratio?

Turndown ratio is the ratio of a burner’s maximum firing rate to its minimum stable firing rate.

Burner Size (MMBtu/hr)Minimum Stable Output (10:1)Minimum Stable Output (3:1)
101 MMBtu/hr3.3 MMBtu/hr
202 MMBtu/hr6.7 MMBtu/hr

A 10:1 turndown burner can operate from 100% to 10% capacity continuously, while a 3:1 system must shut off if load drops below 33%.

📉 Thermal and Combustion Impacts of Load Instability

ConditionImpact Without ModulationImpact With High Turndown
Low Load DemandBurner cycles on/off frequentlyBurner modulates to match load
Rapid Load SwingsFlame instability, CO spikesSmooth flame transition
Extended Low Load PeriodsOverheating and short cyclingContinuous, efficient firing
Frequent Start/StopMechanical wear, safety risksReduced maintenance, stable control

Burner cycling not only affects combustion but also leads to thermal stress on components and uneven steam output.

Frequent cycling due to load swings improves burner reliability and reduces fuel use.False

Cycling increases wear and tear, raises purge losses, and reduces efficiency due to start-up fuel consumption and flame instability.

🔧 Why Stability Suffers During Load Fluctuations

FactorResult of Inadequate TurndownStability Consequence
Inaccurate Air-Fuel RatioOver/under-oxygenated flameCO formation, unburned fuel
Incomplete Flame DevelopmentAt low loads, flame doesn’t stabilizeFlameout or burner lockout
Delayed Re-ignitionTime gap between cyclesOutput gaps, thermal shocks
Over-firing After RestartBurner ignites at full loadSteam pressure spikes

Turndown flexibility prevents these problems by allowing the burner to gradually throttle down and up based on real-time demand.

📊 Performance Comparison by Turndown Ratio

Load (%)Efficiency with 3:1 TurndownEfficiency with 10:1 TurndownCombustion Stability
10088%88%Stable
7582%86%Moderate
5076% (cycling starts)84%Stable
2568% (frequent cycling)81%Stable
10Not operable (off)78%Stable

High turndown ratios eliminate combustion drift and minimize efficiency loss at part loads.

🧠 Real-World Solution: Advanced Burner Controls

FeatureFunctionBenefit
Parallel Positioning SystemSeparately controls fuel and airAccurate air-fuel ratio across load range
Oxygen TrimAdjusts excess air in real timeMaintains combustion efficiency
Modulating Controls (PID)Adjusts firing rate smoothlyPrevents thermal cycling
SCADA with Load ForecastingPredicts load swings and adapts in advanceMaximizes uptime and efficiency

Advanced burner modulation systems reduce the need for manual intervention during load changes.True

They adjust combustion parameters automatically to maintain optimal performance across varying loads.

🧪 Case Study: Steam Plant Turndown Upgrade

A 25 TPH gas-fired boiler at a university power plant suffered:

  • Frequent shutdowns during weekends

  • Flue gas O₂ spiking to 7–9%

  • Burner cycling 20+ times per day

Solution:

  • Burner retrofitted from 3:1 to 10:1 turndown

  • Added oxygen trim and PID modulation

Results:

  • Continuous firing down to 15% load

  • O₂ reduced to 3.2%

  • Efficiency gain: 6.8%

  • Annual fuel savings: ~$88,000

  • Burner life extended by ~2 years

📋 Best Practices for Load and Turndown Management

PracticeGoal
Burner Sizing for Lowest LoadAvoid oversizing that forces cycling
High-Turndown Burner SelectionEnable flexibility across load ranges
Real-Time MonitoringTrack and respond to O₂, CO, and load
Regular TuningEnsure air-fuel curves are accurate
Use of Multiple BoilersModular load sharing at high efficiency

Modular systems with lead-lag control are especially effective in highly variable load environments.

Summary

Load fluctuations are inevitable—but combustion instability and efficiency losses don’t have to be. Turndown ratio defines how flexibly your boiler system can respond to real-time demand without cycling or overheating. A higher turndown ratio ensures smooth modulation, consistent flame control, and reduced fuel waste. Combined with advanced burner control technologies, operators can maintain combustion stability, minimize wear, and reduce operational risk across all load conditions. In modern thermal systems, adaptability isn’t just a convenience—it’s a core requirement for sustainable performance.

What Maintenance and Cleaning Practices Are Key to Sustaining Optimal Heat Transfer?

Heat transfer surfaces in boilers, heat exchangers, and furnaces are critical to efficient energy conversion. These surfaces are designed to maximize the flow of heat from combustion gases to water, steam, or process fluids. But over time, they become coated with soot, scale, slag, and other fouling materials that act as insulators, preventing effective heat exchange. If left unmaintained, these deposits cause energy loss, higher flue gas temperatures, increased fuel use, and even equipment damage. That’s why routine maintenance and proactive cleaning are essential for maintaining peak thermal performance.

Maintenance and cleaning practices are key to sustaining optimal heat transfer because they remove insulating deposits such as soot, scale, slag, and ash that reduce thermal conductivity. Regular cleaning of fire-side and water-side surfaces prevents efficiency losses, overheating, and unplanned downtime. Essential practices include soot blowing, chemical descaling, water treatment, thermal imaging inspections, and condition-based maintenance scheduling. These actions ensure that heat transfer surfaces remain clean, functional, and efficient—preserving fuel economy, output reliability, and equipment longevity.

In thermal systems, the more effectively you maintain heat transfer surfaces, the more energy you keep in the system—and out of the stack.

Soot and scale deposits on heat transfer surfaces significantly reduce boiler efficiency by increasing thermal resistance.True

Even thin layers of fouling insulate surfaces and force the system to burn more fuel to reach the desired output.

🔧 Common Fouling Materials and Their Impact

Fouling TypeArea AffectedSourceEfficiency Loss Potential (%)
SootFire-side tubesIncomplete combustion2–5% for 0.5 mm
ScaleWater-side surfacesHard water (Ca, Mg, silica)10–15% for 1 mm
Ash/SlagSuperheater, economizerBiomass/coal ash fusion6–12%
Corrosion ProductsBoth sidesChemical reactions or oxygen ingressVariable

These fouling agents form thermal barriers, forcing boilers and heat exchangers to work harder—raising both fuel use and emissions.

📉 Impact of Fouling on Heat Transfer Performance

Deposit Thickness (mm)Heat Transfer Reduction (%)Flue Gas Temp Increase (°C)Combustion Efficiency Loss (%)
0.3 (soot)2–4%+25–30°C1.5–2%
1.0 (scale)10–12%+40–50°C3–6%
2.0+ (mixed fouling)>20%+70–100°C7–10%

Fouling can raise flue gas temperatures and cause significant stack heat loss.True

Insulating deposits prevent heat from being absorbed by the water/steam, pushing more heat out the stack.

🧰 Essential Maintenance and Cleaning Methods

MethodTarget SurfaceDescriptionFrequency
Soot BlowingFire-side tubesUses steam or compressed air to dislodge sootDaily or per shift
Chemical DescalingWater-side tubesAcid or alkaline treatment to dissolve mineralsAnnually or as needed
Mechanical BrushingTubes and superheatersManual cleaning of hardened depositsDuring shutdown
Ash Hopper CleaningEconomizer/superheaterRemoves accumulated ash manually or via rakeWeekly
Online Cleaning BallsWater-side systemsCirculate abrasive balls to clean tubesContinuous (in some plants)

In biomass and waste-fired systems, online and automatic cleaning is often required to manage high ash and slag loads without shutdowns.

🧪 Case Study: Chemical Plant Boiler Efficiency Restoration

A 25 TPH coal/biomass boiler at a chemical plant showed:

  • Flue gas temp: 275°C

  • Steam output down by 8.5%

  • O₂ levels high (6.5%)

  • Fuel consumption increased by 12%

Diagnostics:

  • 0.6 mm soot on fire-side

  • 1.3 mm scale on water-side

  • Economizer fouling observed

Actions Taken:

  • Soot blowing intensified to twice daily

  • Descaling with EDTA solution

  • Economizer manually brushed and flushed

Results:

  • Flue gas temp reduced to 185°C

  • Steam output restored to nameplate

  • Efficiency gain: 9.4%

  • Annual fuel savings: ~$72,000

Regular cleaning of heat transfer surfaces can lead to measurable fuel savings and output recovery.True

Cleaning removes insulating layers that block heat transfer, restoring thermal performance and reducing fuel consumption.

📋 Water-Side Maintenance Essentials

TaskImportanceInterval
BlowdownRemoves sediment and impuritiesDaily
Softener/RO MaintenancePrevents hardness and silica ingressWeekly
Water TestingMonitors pH, hardness, TDS, conductivityDaily
DescalingRemoves hardened scale depositsAnnually
Deaerator InspectionPrevents oxygen corrosionMonthly

Water chemistry is critical—even well-maintained boilers can scale quickly if water treatment lapses.

🧠 Monitoring Tools for Condition-Based Cleaning

Tool/TechnologyWhat It MeasuresBenefit
Flue Gas Temperature SensorsDetect drop in heat absorptionEarly indicator of fire-side fouling
Differential Pressure GaugesTrack pressure drops across tubesFouling detection in economizers, preheaters
Thermal Imaging CamerasSurface temperature profilingIdentifies hot spots and insulation loss
Ultrasonic Thickness MetersMeasures corrosion, internal scaleTracks long-term wear and fouling buildup
SCADA/Trend MonitoringDetects gradual efficiency driftTriggers cleaning before severe degradation

Modern plants use these tools to implement predictive cleaning, based on actual system behavior rather than a calendar.

Summary

Optimal heat transfer is essential for high-efficiency combustion, and maintenance is the foundation of that performance. Soot, scale, slag, and ash build up over time, insulating key surfaces and lowering heat absorption. Through regular cleaning—both manual and automated—alongside water treatment and diagnostic monitoring, operators can maintain clean surfaces, efficient heat transfer, and low fuel use. In thermal systems, every layer you remove is energy you recover—and profit you protect. Sustained performance comes not from running harder, but from staying clean and running smarter.

🔍 Conclusion

Maximizing combustion and heat transfer efficiency in industrial power plant boilers requires a balanced approach to fuel quality, airflow management, thermal loading, and surface cleanliness. When these factors are well-optimized, the boiler operates more efficiently, consumes less fuel, and generates fewer emissions—all while maintaining output reliability. Regular inspections, predictive maintenance, and combustion tuning are essential for long-term success.


📞 Contact Us

💡 Want to improve the performance of your power plant boiler? Our specialists provide system audits, combustion optimization, heat transfer diagnostics, and efficiency improvement plans for high-capacity boiler systems.

🔹 Connect with us today to ensure your power boiler is running at peak efficiency and output! ⚡🔥📈

FAQ

How does fuel type influence combustion efficiency in power plant boilers?

Fuel properties such as calorific value, moisture, ash content, and volatility directly impact combustion. High-moisture or low-energy fuels require more air and heat to burn, reducing efficiency. Consistent, high-quality fuel improves flame stability and energy output.

What role does flame temperature play in heat transfer efficiency?

Higher flame temperatures promote more complete combustion and better radiation heat transfer to boiler walls and tubes. However, excessive temperatures can cause slagging, NOx formation, and material degradation. Balanced flame conditions are essential for both efficiency and equipment longevity.

Why is boiler design important for efficient heat transfer?

Efficient boilers have optimized surface area, tube arrangement, and flow paths to ensure maximum heat absorption from hot gases. Designs that reduce dead zones and promote turbulence in gas and water/steam flows enhance thermal transfer.

How do flue gas properties affect thermal performance?

High flue gas temperature indicates poor heat recovery. Efficient systems use economizers, air preheaters, or condensing units to extract residual heat. Monitoring oxygen levels, CO, and stack temperature also helps fine-tune combustion.

What operational factors affect boiler efficiency in power plants?

  • Air-to-fuel ratio tuning

  • Burner maintenance and calibration

  • Soot blowing and scale removal

  • Boiler load consistency

  • Real-time performance monitoring
    Maintaining clean heat surfaces and precise combustion control is essential to maximize energy output and minimize fuel consumption.

References

  1. Fuel Quality and Combustion in Boilershttps://www.energy.gov

  2. Boiler Heat Transfer Optimizationhttps://www.sciencedirect.com

  3. Power Plant Boiler Design and Efficiencyhttps://www.researchgate.net

  4. Combustion Control in Industrial Boilershttps://www.epa.gov

  5. Thermal Performance of Steam Generatorshttps://www.iea.org

  6. Economizer and Heat Recovery Systemshttps://www.bioenergyconsult.com

  7. Burner Management for Large Boilershttps://www.mdpi.com

  8. Boiler Maintenance and Performance Monitoringhttps://www.automation.com

  9. Steam System Optimization in Power Plantshttps://www.energysavingtrust.org.uk

  10. ASME Guidelines for Boiler Efficiencyhttps://www.asme.org

Wade Zhang

CEO of Taishan Group Taian Boao International Trade Co., Ltd. 30 years experience in Global industrial boiler market,  Over 300 boiler projects experience, including 21+ EPC projects. Projects span 30+ countries & regions, involving industries such as nuclear power, energy & electricity, municipal heating, mining, textiles, tires etc.

Key Factors Influencing Heat Transfer and Combustion Efficiency in Industrial Power Plant Boilers Read More »

How to Optimize Circulating Fluidized Bed Boiler Performance for Lower Operating Costs

How to Optimize Circulating Fluidized Bed Boiler Performance for Lower Operating Costs

Circulating Fluidized Bed (CFB) boilers are favored in industrial and utility applications for their fuel flexibility, low emissions, and high combustion efficiency. However, without proper operational control and system optimization, these advantages can be undercut by excessive fuel use, ash handling issues, heat losses, and maintenance-related downtime—all of which raise operating costs. Efficient CFB boiler management is key to maximizing output while minimizing energy and maintenance expenses.

To optimize CFB boiler performance for lower operating costs, focus on critical areas such as fuel sizing and quality control, bed temperature management, air distribution tuning, ash handling optimization, and flue gas heat recovery. Additional efficiency gains can be achieved by implementing predictive maintenance, real-time monitoring, and combustion tuning strategies. Ensuring a stable fluidization regime and minimizing erosion or fouling in heat exchangers will also significantly reduce lifecycle costs.

Here’s a targeted guide to enhancing your CFB system’s cost-effectiveness and performance.

How Does Fuel Size, Moisture Content, and Calorific Value Impact CFB Combustion Efficiency?

Circulating Fluidized Bed (CFB) combustion is renowned for its fuel flexibility and low emissions. However, the efficiency of CFB systems heavily depends on the physical and chemical properties of the fuel—particularly particle size, moisture content, and calorific value. Poorly matched fuel can reduce combustion temperature, disrupt fluidization, and lead to incomplete burnout or increased ash handling costs. Understanding and optimizing these parameters is critical to maintaining stable, efficient combustion in CFB systems, especially when using diverse biomass, coal, or waste-derived fuels.

Fuel size, moisture content, and calorific value directly impact CFB combustion efficiency by influencing fluidization behavior, combustion temperature, and residence time. Fine and uniform particle size enhances burnout but may increase elutriation, while large particles reduce surface area and slow combustion. High moisture content lowers flame temperature and increases energy used for drying, reducing net efficiency. Calorific value determines how much useful energy is released; lower-grade fuels require more handling and produce more ash. Optimizing these fuel properties ensures complete combustion, minimizes heat losses, and maintains stable bed operation in CFB boilers.

In flexible-fuel CFB systems, fuel preparation and selection are as important as equipment design for sustained performance and emissions control.

Fuel particle size affects fluidization quality and combustion completeness in CFB systems.True

Smaller particles combust more completely but must be balanced to avoid entrainment; optimal sizing ensures stable bed dynamics and efficient burnout.

🔬 Fuel Particle Size and CFB Combustion

Particle size affects how fuel behaves in the fluidized bed:

Size Range (mm)Combustion ImpactEfficiency Consideration
<1 mm (fine)Rapid burnout but risk of entrainmentMay increase cyclone load, fly ash loss
1–6 mm (optimal)Good fluidization and complete combustionBalanced burnout and minimal losses
>10 mm (coarse)Poor surface area, slow ignitionLeads to unburned carbon and ash

Ideal CFB Fuel Size Distribution:

Fuel TypeTarget Particle Size (mm)Notes
Pulverized coal0.5–3 mmUniform sizing for optimal burnout
Biomass chips3–10 mmPre-shredded to minimize bridging
RDF pellets<15 mmMust be screened to remove oversize

Oversized fuel particles increase combustion efficiency by extending burn duration.False

Oversized particles combust slowly and may not burn completely within the residence time, lowering efficiency and increasing unburned carbon.

💧 Moisture Content: The Hidden Efficiency Killer

High moisture content reduces combustion efficiency by absorbing energy for evaporation before ignition.

Moisture Content (%)Effect on CombustionEfficiency Loss (%)
5–15Ideal range for most fuelsBaseline
20–30Longer ignition time, lower flame temp5–10%
>40Flame instability, risk of bed collapse10–20%

For every 10% increase in moisture, the net calorific value drops by ~5–6%, requiring more fuel to maintain output. High moisture can also increase sorbent consumption and corrosion risk due to lower combustion temperatures.

🔥 Calorific Value and Fuel Energy Density

Calorific value (CV) determines how much usable energy the fuel contains.

Fuel TypeCalorific Value (MJ/kg)Ash Content (%)CFB Efficiency Impact
Bituminous Coal24–3010–15High CV supports stable bed temp
Wood Chips (dry)16–191–3Medium efficiency with good prep
Biomass (wet)8–141–7Lower bed temp, higher consumption
RDF/Sludge10–1815–25High ash, requires combustion tuning

Higher CV fuels provide more thermal energy per unit mass, improving combustion temperatures and supporting better sorbent reactivity for SO₂/NOx control. However, high-CV fuels must be balanced with CFB material flow to avoid excessive temperatures.

Low-calorific fuels require higher mass flow to maintain boiler load, increasing ash production and fuel costs.True

More fuel must be burned to deliver the same energy output, increasing handling requirements and reducing thermal efficiency.

📊 Combined Fuel Property Impact on CFB Efficiency

PropertyIdeal RangeEfficiency Influence
Particle Size1–6 mmEnables complete combustion and good fluidization
Moisture Content10–20%Minimizes drying losses and maintains flame temperature
Calorific Value18–25 MJ/kgProvides stable bed operation and heat recovery potential

Combining high moisture with large particle size and low CV is particularly harmful—leading to incomplete combustion, high unburned carbon, and excessive fuel feeding rates.

🧪 Case Study: Biomass CFB Retrofit

A CFB boiler at a pulp and paper mill was converted from coal to biomass. Initial efficiency dropped by 12%.

Challenges Identified:

  • Fuel size: 20–50 mm, irregular chips

  • Moisture: ~45% (green wood)

  • CV: ~12 MJ/kg

Corrective Measures:

  • Installed shredder to reduce fuel size to <10 mm

  • Added belt dryer to reduce moisture to 15%

  • Blended with RDF to raise average CV

Results:

  • Combustion efficiency improved by 14.6%

  • Bed temperature stabilized at 850–870°C

  • Unburned carbon reduced by 65%

  • Fuel feed rate decreased by 21%

Combustion temperature in CFBs can be stabilized by managing fuel properties like size and moisture.True

Proper fuel preparation ensures predictable burn rates and thermal profiles in the fluidized bed, maintaining efficiency.

🔧 Optimization Strategies for CFB Fuel Management

StrategyTarget ParameterBenefit
Pre-Screening and ShreddingParticle size uniformityEnhances bed fluidity, avoids hot spots
Fuel Drying SystemsMoisture controlImproves net calorific value, reduces corrosion
Calorific Value BlendingEnergy densityStabilizes bed temperature and output
Ash Removal SchedulingUnburned carbon controlMaintains heat exchange and air distribution
Bed Temperature MonitoringReal-time combustionGuides air/fuel ratio and load adjustments

CFB plants with advanced fuel preparation lines often experience 3–5% higher efficiency and 30–50% less fouling and slagging.

Summary

In CFB combustion, fuel properties are not just inputs—they are performance drivers. Particle size, moisture content, and calorific value shape how fuel burns, how heat transfers, and how emissions form. Optimizing these characteristics through preparation, drying, and blending is essential for maintaining high combustion efficiency, bed stability, and fuel economy. In a CFB boiler, the key to sustained performance lies in controlling not just the fire—but the fuel feeding it.

Why Is Bed Temperature Control Crucial for Stable Combustion and Fuel Flexibility?

Circulating Fluidized Bed (CFB) combustion systems are designed for high-efficiency, low-emission performance with the ability to handle a wide range of fuels. But their fuel flexibility and combustion stability are only achievable with precise bed temperature control. If the bed gets too cold, combustion becomes unstable and incomplete. If it gets too hot, agglomeration, slagging, and emission spikes may occur. Bed temperature is the anchor point of the entire combustion process—affecting flame stability, sorbent reactivity, fuel burnout, and ash behavior. Managing it accurately is essential for reliable and efficient operation.

Bed temperature control is crucial in CFB combustion because it ensures stable combustion conditions, enables the efficient burning of diverse fuels, and protects system integrity. The optimal bed temperature (typically 800–900°C) allows complete fuel burnout, effective SO₂ and NOₓ reduction, and avoids agglomeration or defluidization. Deviations from this range can lead to flame instability, increased emissions, incomplete combustion, and operational failures. Temperature control enables fuel flexibility by allowing different fuels to burn under uniform thermal conditions.

In fluidized bed systems, the temperature of the bed is the temperature of success.

Bed temperature control in CFB boilers is essential for achieving complete combustion and stable operation.True

Stable temperatures maintain proper reaction kinetics, sorbent effectiveness, and fluidization characteristics.

🌡️ What Is Bed Temperature in a CFB Boiler?

In a CFB, the bed is a mixture of fuel particles, ash, and inert materials (like sand or limestone) suspended by high-velocity air. Combustion occurs within this fluidized bed, where:

  • Heat is transferred rapidly

  • Combustion reactions take place over extended residence time

  • Sorbents (like limestone) react with acid gases

The bed temperature must be maintained uniformly across the furnace volume—typically between 820°C and 870°C depending on fuel and design.

Temperature Range (°C)Combustion EffectOperational Impact
<750Incomplete combustion, CO spikeFlame instability, unburned carbon
800–850Ideal for most fuelsStable combustion, efficient sorbent use
900–950Agglomeration riskBed sintering, fluidization collapse
>1,000Slagging, tube overheatingEquipment damage, shutdown risk

Bed temperatures above 950°C are beneficial for all fuels in CFB systems.False

Excessive temperatures can cause bed material to sinter, leading to defluidization and severe operational issues.

🔄 Why Temperature Affects Combustion Stability

Parameter InfluencedBed Temperature Role
Fuel BurnoutSufficient temperature ensures complete combustion over extended residence time.
SO₂ Removal EfficiencyLimestone sorbents react best between 820–880°C.
NOₓ Formation ControlUniform lower temperatures limit thermal NOₓ formation.
Fluidization DynamicsStable temperature prevents sticky particles and bed collapse.
Emission ComplianceControls CO, NOₓ, and unburned hydrocarbons.

If temperature fluctuates, combustion reactions slow, and unburned carbon increases, which reduces boiler efficiency and raises emissions.

📉 Impact of Poor Bed Temperature Control

SymptomCauseEfficiency Consequence
Incomplete combustionBed too coldFuel waste, high CO emissions
Agglomeration in bedBed too hotShutdown for cleaning
Increased limestone useSub-optimal SO₂ captureHigher O&M costs
Fly ash carryoverPoor particle conversionHigher particulate emissions
Load swings and flameoutRapid temp changesBoiler instability

In one biomass-fueled CFB plant, poor temperature control caused flame instability during load ramping, forcing operators to reduce turndown capacity by 25%.

🔧 Methods for Controlling Bed Temperature

MethodDescriptionEffectiveness
Fuel Feed Rate AdjustmentMore fuel raises temperature, less lowers itPrimary control method
Secondary Air InjectionEnhances mixing, improves combustion stabilitySupports temperature homogenization
Recycled Flue Gas ControlDilutes oxygen and temp to manage heat releaseHelps with high-CV fuels
In-Bed Heat ExchangersExtracts heat to prevent over-temperature zonesEspecially useful in waste-burning CFBs
Automated PID Control LoopsUses real-time data to modulate operationsMaintains stable thermal profile

CFB systems rely solely on manual fuel adjustments to control bed temperature.False

Modern CFBs use automated systems that integrate feedback from temperature sensors, fuel flow, and air distribution to optimize temperature control.

📊 Case Study: Multi-Fuel CFB Optimization

A 100 MW CFB unit in a pulp and paper plant burns wood chips, sludge, and coal.

Initial Issues:

  • Bed temps fluctuating 790–930°C

  • Poor burnout of wet sludge

  • High limestone usage

Actions Taken:

  • Installed bed thermocouples at multiple zones

  • Implemented fuel-specific feed modulation logic

  • Upgraded PID controller for tighter temperature feedback

Results:

  • Bed temp stabilized at 840 ±15°C

  • Fuel flexibility improved (30% sludge share)

  • Limestone consumption dropped by 18%

  • Overall efficiency rose by 6.3%

Bed temperature control is a key enabler of fuel flexibility in CFB boilers.True

Different fuels require different combustion conditions; maintaining stable temperature ensures all fuels can burn efficiently.

📋 Monitoring and Instrumentation for Temperature Control

ToolRole
In-bed ThermocouplesMeasure real-time temperature at various depths
Infrared CamerasDetect hot spots across bed surface
Fuel Moisture SensorsPredict fuel heating value and drying needs
Air Flow MetersControl primary/secondary air delivery
Combustion Control PLC/SCADAIntegrates all sensors to optimize setpoint control

Advanced CFB systems use digital twins to simulate temperature responses to changing fuels, allowing predictive temperature adjustments before efficiency loss occurs.

Summary

In CFB combustion systems, bed temperature is the foundation of efficiency, stability, and fuel adaptability. It governs everything from fuel burnout and emissions to heat recovery and equipment longevity. Proper control allows diverse fuels—including low-grade biomass, sludge, and refuse—to combust completely and cleanly. Without stable bed temperatures, even high-quality fuel won’t burn effectively. By integrating advanced sensors, fuel modulation, and automated feedback control, operators can keep CFB boilers running at peak efficiency—even under variable load and mixed-fuel conditions. In fluidized bed technology, temperature control isn’t just a parameter—it’s the performance gatekeeper.

How Can Optimal Air Distribution Reduce Excess Air Losses and Improve Combustion?

In combustion systems, air is as important as fuel—but more isn’t always better. Supplying too much air beyond the stoichiometric requirement results in excess air, which carries heat away with the flue gases and lowers system efficiency. Poor air distribution—such as uneven primary, secondary, or tertiary air—can also cause incomplete combustion, flame instability, and increased pollutant formation. Conversely, optimal air distribution ensures efficient fuel burnout, maximizes thermal output, and reduces losses associated with excess air. Mastering airflow control is key to unlocking high-efficiency, low-emission combustion.

Optimal air distribution reduces excess air losses and improves combustion by delivering the right amount of air, in the right place, at the right time. Properly balanced primary, secondary, and tertiary air ensures complete mixing with fuel, stabilizes the flame, and prevents hot and cold zones within the combustion chamber. This minimizes the need for excess air, thereby reducing stack losses, improving thermal efficiency, and lowering emissions such as CO and NOₓ. Real-time airflow control, burner geometry, and feedback systems enable precise distribution to match load and fuel conditions.

Air is free—but moving too much of it through a combustion system comes at a significant energy cost.

Optimal air distribution in combustion systems reduces the need for excess air and improves efficiency.True

Even air delivery ensures complete combustion with minimal heat loss through the stack, maximizing usable energy from the fuel.

🔬 Understanding Air Distribution in Combustion

Air TypeFunctionTypical Air Ratio (of total air)
Primary AirTransports and mixes with fuel initially20–40%
Secondary AirSupports complete combustion, stabilizes flame30–60%
Tertiary AirFinishes burnout, reduces NOₓ0–20%
Excess AirExtra oxygen to ensure complete burnTypically 10–25% above stoichiometric

Each air stream serves a role in the combustion sequence. If misaligned—either over- or under-supplied—it leads to flame instability, incomplete combustion, or unnecessary heat loss.

📉 How Excess Air Reduces Efficiency

Excess air lowers combustion temperature and increases stack losses:

Excess Air (%)Flue Gas O₂ (%)Efficiency Loss (%)Comment
10~2MinimalIdeal zone
25~42–3% lossAcceptable in many systems
50~85–7% lossEfficiency starts to drop
100~1110–12% lossSevere loss and flame cooling

Excess air requires heating more nitrogen and oxygen, which leaves the stack as wasted energy. In gas-fired systems, every 1% O₂ above optimal can reduce efficiency by ~0.5–1%.

Excess air improves fuel efficiency in industrial combustion systems.False

Excess air reduces flame temperature and increases heat loss through flue gases, decreasing overall system efficiency.

🔧 Benefits of Optimal Air Distribution

BenefitDescription
Improved Flame StabilityConsistent ignition and complete fuel burnout
Reduced CO/NOₓ EmissionsUniform temperature reduces thermal NOₓ and CO
Lower Stack TemperatureMore heat is absorbed into the system
Higher Combustion EfficiencyLess air heated unnecessarily
Better Heat TransferEven flame front improves exchanger performance

In solid-fuel boilers, poor air staging often leads to carbon carryover or unburned fuel in ash. Optimized air zones improve carbon burnout and reduce ash disposal costs.

🧪 Case Study: Refinery Furnace Retrofit

A petroleum refinery faced high stack temperatures and CO emissions due to excess air averaging 60%.

Upgrades:

  • Added damper controls for primary/secondary air

  • Installed flue gas oxygen analyzers

  • Rebalanced burner air registers

Results:

  • Reduced excess air from 60% to 18%

  • CO emissions dropped by 65%

  • Stack temperature reduced by 40°C

  • Efficiency improved by 7.2%

  • Fuel savings: $130,000 annually

Better burner air staging improves emissions and fuel economy.True

Air staging enhances combustion completeness and reduces thermal NOₓ and unburned carbon.

📋 Key Tools for Air Distribution Optimization

Tool/TechnologyFunction
Oxygen Trim SystemsAdjusts air delivery based on flue gas O₂
VFD-Controlled FansMatches air flow to burner demand
Damper Control SystemsBalances flow between air zones
CFD Burner ModelingOptimizes burner and air nozzle geometry
Air-Fuel Ratio SensorsMeasures mix accuracy in real-time

With these tools, facilities can minimize excess air while avoiding flameout risks, even during load fluctuations.

📊 Practical Air Distribution Configurations

Combustion System TypeTypical Air Distribution (%)Optimization Notes
Natural Gas BurnerPrimary: 30, Secondary: 70Minimize excess air to 10–15%
Pulverized Coal BoilerPrimary: 25, Secondary: 60, Tertiary: 15Use dynamic O₂ controls
Biomass CFBPrimary: 35, Secondary: 65Ensure deep fuel penetration and even burn
Rotary Kiln BurnerPrimary: 20, Secondary: 50, Tertiary: 30Staging critical for NOₓ reduction

Each fuel and system demands a unique air profile for optimal efficiency. Adjusting air staging per fuel type ensures clean, complete combustion.

🧠 Advanced Approaches: AI and Adaptive Control

TechnologyRoleBenefit
AI Combustion OptimizationLearns from data to tune air-fuel ratioMaintains ideal O₂ and excess air levels
Digital TwinsSimulates airflow impact on combustionHelps design better air staging strategies
Real-Time Thermal ImagingDetects flame and bed temp distributionIdentifies air imbalance or fuel maldistribution

Facilities using AI-based airflow tuning have reported 2–4% gains in efficiency and 30–50% emission reductions under dynamic loads.

Summary

Optimal air distribution is not just about how much air you supply—it’s about how you deliver it. Poor distribution leads to excess air, heat loss, and unstable combustion. Precise control of primary, secondary, and tertiary air flows ensures that fuel and oxygen meet at the right time and place for efficient, complete combustion. With the right monitoring tools and control systems, plants can significantly reduce fuel use, emissions, and maintenance. In combustion engineering, balanced air equals balanced performance—and a balanced budget.

What Role Does Ash Management and Bottom Bed Material Control Play in Reducing Costs?

In Circulating Fluidized Bed (CFB) boilers and other solid-fuel combustion systems, ash is an inevitable byproduct. But how it’s managed—and how the bottom bed material is maintained—has a major impact on operational efficiency, fuel consumption, maintenance costs, and environmental compliance. Improper ash handling leads to buildup, wear, clogging, and unplanned shutdowns. Uncontrolled bed material behavior disrupts combustion and fluidization, requiring more fuel and more maintenance. On the flip side, effective ash management and bed material control lower operating costs and improve combustion stability.

Ash management and bottom bed material control reduce costs by maintaining optimal fluidization, preventing system wear, minimizing unburned carbon losses, and reducing the need for frequent material replenishment. Proper ash extraction ensures continuous operation without slagging or ash buildup, while maintaining the right bed particle size and composition enhances combustion efficiency, stabilizes bed temperature, and prevents damage to cyclones, ash coolers, and feed systems. These practices reduce fuel use, downtime, and disposal expenses, directly translating into lower operating costs and higher reliability.

Efficient combustion doesn’t end with ignition—it continues through the careful management of what remains.

Effective ash and bed material control in CFB systems helps reduce maintenance and operating costs.True

By preventing clogs, slagging, and abrasion, these controls extend component life and reduce the need for shutdowns and cleaning.

🧱 Types of Ash in CFB and Their Impact

Ash TypeLocationCharacteristicsManagement Concern
Bottom AshBed zone and furnace floorCoarse, heavy, contains bed materialCan cause bridging, fluidization issues
Fly AshCaptured in cyclones/ESPFine, light, carries unburned carbonLoss of energy and high emissions
Agglomerated AshFormed from sintered particlesSticky, high-melting ash lumpsCan lead to bed defluidization

If ash accumulates or changes particle size distribution significantly, it leads to reduced fluidization, poor combustion, and uneven temperature distribution.

📉 Cost Consequences of Poor Ash and Bed Control

IssueRoot CauseCost Impact
Bed DefluidizationHigh fines, sticky ash, low airflowBoiler trip, unplanned shutdowns
Abrasive WearLarge ash particles, high velocityTube/piping failure, increased downtime
High Unburned Carbon in AshPoor mixing, temp imbalanceFuel waste, ash reprocessing cost
Ash Handling BlockagesMoisture, inconsistent removalMaintenance time, cleaning labor
Excessive Bed Material RefillImproper control or lossesHigh inert cost, disposal cost

Even small disruptions from poor ash control can halt operations, especially in high-ash fuels like lignite, biomass, or RDF.

Accumulated ash in the bed improves combustion efficiency by insulating the furnace.False

Excess ash disrupts airflow and fluidization, causing combustion instability and reduced efficiency.

🔧 Key Practices for Ash and Bed Material Optimization

PracticeFunctionCost Reduction Mechanism
Continuous Ash ExtractionPrevents ash buildup in furnace bedAvoids defluidization and shutdowns
Ash Cooling and HandlingConditions ash before disposal or reuseReduces mechanical wear and handling downtime
Bed Material SievingSeparates fines and oversize ash particlesMaintains ideal particle size distribution
Inert Addition ManagementReplenishes sand/limestone as neededMinimizes unnecessary material purchases
Ash Quality MonitoringTracks carbon content, temperature, and moistureImproves combustion feedback and reuse

Most modern CFBs now use automated ash control systems with real-time data from cyclone and bed temperature sensors to maintain flow and performance.

📊 Ash and Bed Control Parameters: Ideal Targets

ParameterOptimal RangeMonitoring Tool
Bed Material Size0.5–2.5 mmSieve analysis
Unburned Carbon in Ash<5%LOI (Loss on Ignition) testing
Bed Temperature Stability±10°C of setpoint (e.g. 850°C)In-bed thermocouples
Ash Extraction Rate1–3% of total bed mass/hourAsh hopper flow sensors
Inert Addition FrequencyBased on pressure and wearBed pressure drop sensors

When bed material control is off-target, fluidization weakens, emissions rise, and fuel usage increases.

Uncontrolled ash particle size can cause air distribution and combustion imbalance in CFB boilers.True

Oversized or overly fine particles affect fluid dynamics, flame shape, and heat transfer, reducing combustion stability.

🧪 Case Study: Biomass CFB with High Ash Content

A 50 MW CFB boiler burning agricultural residues experienced:

  • Frequent bed temperature fluctuations

  • High LOI in fly ash (~12%)

  • Overloading of ash removal system

Corrective Actions:

  • Introduced sieving and recirculation for bed material

  • Optimized ash extraction frequency via PLC controls

  • Installed second-stage ash cooler for bottom ash

Results:

  • Bed temperature stabilized ±7°C

  • Unburned carbon reduced to 4.5%

  • Ash handling labor reduced by 40%

  • Net combustion efficiency gain: 5.8%

  • Annual savings: $85,000 in fuel and maintenance

📋 Advanced Ash and Bed Monitoring Technologies

TechnologyPurposeBenefit
Real-Time Ash Flow SensorsMonitor ash removal rates and blockagesPrevents ash surges and overload
LOI MonitoringMeasures carbon in fly ash onlineProvides feedback for combustion tuning
Particle Size AnalyzersDetects fines or large particle accumulationEnsures stable bed fluidization
Bed Pressure SensorsDetect changes in fluidizing dynamicsDetects need for inert addition or cleanup
Automated Ash ValvesTimed or load-responsive ash removalImproves control and minimizes manual labor

Advanced systems reduce manual intervention and avoid downtime by responding dynamically to system conditions.

Summary

Ash management and bottom bed material control are often overlooked but fundamentally important components of cost-efficient combustion. When managed properly, they stabilize fluidization, ensure complete fuel burnout, reduce handling and maintenance costs, and extend system life. Through controlled ash extraction, optimal particle sizing, and monitored inert addition, operators can avoid energy loss, mechanical wear, and unscheduled shutdowns. In a CFB system, managing what’s left behind is just as critical as managing the flame itself. The smarter the ash and bed strategy, the lower the operating cost—and the higher the return on combustion investment.

How Does Flue Gas Heat Recovery (Economizers, Air Preheaters) Improve Thermal Efficiency?

Combustion systems in boilers and furnaces typically waste a significant portion of energy in the form of hot flue gases escaping the stack. These gases still contain usable thermal energy, but without a recovery system, this energy is lost to the environment. Economizers and air preheaters are heat recovery devices designed to capture that waste heat and transfer it back into the process—either by preheating feedwater or combustion air. The result? Reduced fuel demand, lower flue gas temperatures, and improved thermal efficiency. Integrating these systems is one of the most effective ways to increase overall energy performance without increasing fuel input.

Flue gas heat recovery improves thermal efficiency by capturing residual heat from exhaust gases and transferring it to feedwater (via economizers) or combustion air (via air preheaters). This reduces the fuel required to reach desired steam or heat outputs, as the system begins the process at a higher energy state. Heat recovery reduces stack losses, lowers flue gas temperature, and can improve overall boiler efficiency by 5% to 20%, depending on fuel type, system load, and recovery configuration.

In any fuel-fired process, flue gas heat recovery is not just a sustainability step—it’s a smart economic strategy.

Economizers and air preheaters reduce stack losses and improve boiler thermal efficiency.True

By capturing waste heat from flue gases and transferring it to water or air, these devices reduce the energy needed from fuel combustion.

🔁 How Flue Gas Heat Recovery Works

DeviceTarget MediumEnergy Transfer Mechanism
EconomizerFeedwaterTransfers sensible heat from flue gas
Air PreheaterCombustion airTransfers heat from flue gas to air

These devices are installed in the flue gas path after the combustion chamber but before the stack, intercepting heat that would otherwise be wasted.

Diagram of Heat Flow:

Fuel + Air → Combustion → Hot Gases → 
→ Heat Exchanger (Economizer/Preheater) → 
→ Recovered Heat to Feedwater/Air → 
→ Cooler Flue Gases to Stack

Flue gas heat recovery is not viable for modern high-efficiency boilers.False

Even modern boilers benefit from heat recovery, as flue gas still exits at temperatures far above the required levels for water or air heating.

📉 Effect on Thermal Efficiency

Flue Gas Temp Before Recovery (°C)After Recovery (°C)Feedwater/Air Temp Increase (°C)Efficiency Gain (%)
230140+35 (air), +40 (water)6–8%
200110+50 (water)9–12%
17090+60 (air)13–15%
140 (condensing)55+7016–20%

Efficiency gain depends on:

  • Initial flue gas temperature

  • Type of fuel (natural gas, oil, biomass)

  • System load and feedwater return temperature

  • Surface area and configuration of the heat recovery device

🔧 Types of Heat Recovery Devices

Device TypeApplicationKey Benefit
Bare Tube EconomizerStandard gas and oil boilersSimple and durable
Finned Tube EconomizerCompact, high surface areaHigh heat recovery in tight space
Condensing EconomizerNatural gas systemsCaptures latent and sensible heat
Rotary Air Preheater (RAPH)Large utility boilersEfficient and continuous recovery
Tubular Air PreheaterSmaller industrial unitsEasier maintenance, high flow rates

🧪 Case Study: Textile Mill Boiler Retrofit

A textile plant with a 6 TPH natural gas boiler installed a finned tube economizer and a tubular air preheater.

Pre-Retrofit:

  • Flue gas temp: 240°C

  • Feedwater temp: 60°C

  • O₂ level: 5.5%

  • Fuel usage: 9,600 m³/day

Post-Retrofit:

  • Flue gas temp: 135°C

  • Feedwater temp: 95°C

  • Combustion air temp: 120°C

  • Fuel usage: 8,300 m³/day

  • Efficiency gain: 12.6%

  • Annual savings: ~$64,000

Condensing economizers can improve efficiency by recovering both sensible and latent heat from flue gases.True

Condensing economizers operate below the dew point, allowing them to recover additional energy from moisture in the flue gas.

📋 Advantages of Flue Gas Heat Recovery

BenefitDescription
Reduced Fuel ConsumptionLess energy needed to heat feedwater or air
Lower Flue Gas TemperatureReduces stack losses and thermal pollution
Improved Steam ProductionQuicker pressure ramp-up and higher throughput
Enhanced CombustionPreheated air supports flame stability
Emissions ReductionLower fuel use means less CO₂, NOₓ, and CO
Lower O₂ in Flue GasMore complete combustion, less unburned fuel

📊 Impact by Fuel Type

Fuel TypeRecovery PotentialCommon Recovery Device
Natural GasHigh (condensing)Condensing economizer + air preheater
Heavy Fuel OilMediumNon-condensing economizer
BiomassMedium–HighAsh-resistant tubular preheater
CoalMediumRotary or regenerative air preheater

In systems burning high-moisture fuels, such as biomass or RDF, flue gas heat recovery also helps evaporate fuel moisture, improving combustion quality.

🧠 Monitoring and Controls for Optimal Performance

TechnologyRole
Flue Gas Temp SensorsEnsure target heat recovery is achieved
O₂ Trim SystemsOptimize combustion and minimize excess air
Condensate Drainage ControlsManage acidic water in condensing systems
Fouling DetectorsAlert when heat exchanger surfaces need cleaning
SCADA or PLC IntegrationAutomates adjustments for dynamic loads

Maintenance is essential to ensure heat exchanger surfaces remain clean and effective, especially in ash-laden systems.

Summary

Flue gas heat recovery through economizers and air preheaters offers one of the most effective and affordable pathways to increase thermal efficiency in combustion systems. By reclaiming waste heat and using it to preheat feedwater or combustion air, these systems reduce fuel consumption, improve combustion quality, and lower emissions. With potential efficiency gains of 5–20%, flue gas heat recovery is a proven, scalable solution for any boiler or furnace operator aiming to lower energy costs and improve performance. In thermal systems, the energy you reuse is the energy you don’t have to buy.

How Do Automation, Diagnostics, and Predictive Maintenance Lower Operational Risks?

In industrial combustion and thermal systems, equipment failures and process disruptions can result in significant losses—from fuel waste and unplanned downtime to costly repairs and safety hazards. Traditional maintenance strategies, such as time-based or reactive approaches, leave operations vulnerable to unexpected breakdowns. Fortunately, modern automation, real-time diagnostics, and predictive maintenance technologies enable operators to anticipate and prevent failures before they occur, lowering risk and improving system resilience.

Automation, diagnostics, and predictive maintenance lower operational risks by continuously monitoring system performance, identifying early warning signs of faults, and enabling proactive interventions. Automation ensures process stability by reducing human error and maintaining optimal operating parameters. Diagnostics use real-time data to detect anomalies, while predictive maintenance leverages historical trends and machine learning to forecast failures. These strategies minimize unplanned downtime, reduce maintenance costs, extend equipment life, and enhance operational safety and reliability.

Smart, data-driven systems don’t just react—they predict, protect, and prevent.

Predictive maintenance reduces operational risks by identifying equipment issues before failure occurs.True

By using real-time and historical data to predict failures, predictive maintenance enables proactive repair and prevents unplanned outages.

🤖 The Role of Automation in Operational Risk Reduction

FunctionAutomation RoleRisk Reduction Impact
Air-Fuel Ratio ControlMaintains optimal combustionPrevents fuel waste and unstable flames
Boiler Load ControlAdjusts firing rate based on demandAvoids overpressure and low-load cycling
Alarm and Shutdown LogicTriggers safety actions on critical faultsPrevents catastrophic failure or explosions
Feedwater and Pressure ControlEnsures consistent steam outputProtects turbines, heat exchangers, and pipes
Combustion OptimizationReduces emissions and energy useImproves compliance and efficiency

By replacing manual intervention with logic-driven control systems, human error is minimized, and response times are greatly improved.

Automation reduces human error and speeds up fault response times in industrial systems.True

Automated systems consistently manage processes and respond faster than manual operations, preventing process deviation and failure.

🔍 Diagnostics: Real-Time Fault Detection

Diagnostics refer to the detection, analysis, and interpretation of system anomalies using sensor data and analytics tools.

Examples of Diagnostic Parameters:

ParameterMeasured ByWhat It Detects
O₂ and CO LevelsFlue gas analyzersIncomplete combustion, burner malfunction
VibrationAccelerometersPump or motor bearing wear
Temperature DriftThermocouples, IR camerasFouling, insulation loss, hot spots
Pressure DropDifferential pressure sensorsTube fouling or blockage
Stack TemperatureThermocouplesHeat exchanger inefficiency, soot buildup

Early detection enables operators to correct problems before they escalate, avoiding unscheduled downtime.

🧠 Predictive Maintenance: From Data to Prevention

Predictive maintenance uses AI, machine learning, and historical trends to forecast when components are likely to fail and schedule maintenance accordingly.

TechnologyUse CasePredictive Benefit
Digital TwinsSimulate real-time equipment behaviorTest “what-if” failure scenarios
Machine Learning ModelsAnalyze past failures to predict future issuesPrevent unplanned outages
Condition-Based MonitoringTrack wear indicators in real timeExtend equipment service life
SCADA with AnalyticsCentralize data for trend analysisSupport risk-informed decision-making

In one study, predictive maintenance reduced unscheduled downtime by up to 45% and maintenance costs by 30–40% annually.

Predictive maintenance increases overall maintenance costs due to more frequent repairs.False

It reduces costs by replacing parts only when necessary, avoiding unnecessary preventive maintenance and emergency repairs.

📉 Operational Risks Without Smart Monitoring

Operational RiskRoot CauseResulting Consequence
Unplanned ShutdownUndetected component failureLost production, restart delays
Safety IncidentOverpressure or flame instabilityInjury, regulatory penalties
Fuel WasteFaulty burners or airflow imbalanceHigh operating cost, high emissions
Heat Exchanger RuptureFouling or scaling left uncheckedEquipment damage, steam leaks
Environmental ViolationEmission spike from inefficient combustionFines, permit suspension

Each failure not only increases cost, but also undermines reliability, sustainability, and stakeholder confidence.

🧪 Case Study: Chemical Plant Boiler Optimization

A 30 TPH gas-fired boiler was prone to CO spikes, refractory failures, and emergency shutdowns.

Challenges:

  • No combustion feedback loop

  • No predictive failure tracking

  • Reactive maintenance only

Implemented:

  • Real-time combustion diagnostics

  • Predictive maintenance software for burner nozzles

  • PLC-integrated alarm logic

Results:

  • Unplanned shutdowns reduced by 60%

  • Fuel use optimized (O₂ trimmed from 6.2% to 3.4%)

  • Maintenance labor costs down by 33%

  • 98.7% equipment availability achieved

AI-driven predictive systems help prioritize maintenance activities based on actual risk levels.True

They assess component health and recommend actions, reducing downtime and focusing resources where most needed.

📋 Comparison: Maintenance Strategies

StrategyTriggerProsCons
ReactiveAfter failureLow upfront costHigh downtime, costly emergencies
PreventiveTime or usage intervalPredictable schedulingMay replace parts unnecessarily
PredictiveBased on condition and trendsOptimized resource use, fewer failuresRequires sensor/data infrastructure

Predictive strategies offer the best balance between cost, uptime, and reliability—especially for large-scale combustion systems.

Summary

Automation, diagnostics, and predictive maintenance are essential tools for reducing operational risks in modern combustion and thermal systems. They eliminate guesswork, minimize failure impacts, and enable proactive management of assets. Real-time monitoring and intelligent controls maintain process stability, while data-driven analytics ensure timely interventions and extend equipment life. The result is lower fuel use, fewer shutdowns, improved safety, and better long-term ROI. In today’s high-demand energy environment, your best defense against failure is foresight powered by data.

🔍 Conclusion

Optimizing a Circulating Fluidized Bed boiler system requires an integrated approach that aligns fuel properties, combustion control, air management, and heat recovery. When properly maintained and tuned, CFB boilers deliver stable, efficient, and low-emission performance—even with low-grade or variable fuels. By addressing these efficiency drivers and integrating smart controls, operators can realize significant savings in fuel, maintenance, and emissions-related costs.


📞 Contact Us

💡 Need expert help optimizing your CFB boiler? Our engineering team offers fuel analysis, bed fluidization tuning, heat recovery integration, and maintenance planning customized to your operating conditions.

🔹 Contact us today and turn your CFB boiler into a high-efficiency, low-cost power solution! 🔄🔥📉

FAQ

What are the top strategies to optimize CFB boiler performance?

Key strategies include:

  • Maintaining optimal bed temperature (typically 800–900°C)

  • Balancing primary and secondary air distribution

  • Controlling fluidization velocity

  • Monitoring and adjusting fuel feed rate

  • Implementing advanced control systems for air-fuel ratio and bed pressure

How does bed temperature affect combustion efficiency in a CFB boiler?

Bed temperature must be kept within the ideal range to ensure complete combustion while minimizing NOx formation and avoiding ash agglomeration. Deviations can cause incomplete burning or operational instability.

What role does fuel management play in CFB boiler cost reduction?

CFB boilers can burn a wide range of fuels—including biomass, coal, petcoke, and waste. Proper fuel blending, pre-drying, and sizing enhance combustion stability, reduce unburned carbon, and lower fuel costs per unit of steam generated.

How can heat recovery systems improve efficiency and reduce fuel consumption?

Installing economizers, air preheaters, and steam reheaters helps recover waste heat from flue gas, improving thermal efficiency by 5–10%. This lowers the boiler’s fuel demand and reduces emissions.

What maintenance practices ensure consistent boiler performance?

  • Frequent inspection and cleaning of cyclone separators and heat exchanger surfaces

  • Monitoring for erosion of tubes and refractory wear

  • Calibrating pressure, temperature, and O₂ sensors regularly

  • Maintaining proper ash handling and removal systems
    These actions reduce unplanned downtime and ensure optimal combustion and heat transfer.

References

  1. CFB Boiler Optimization and Operation Manualhttps://www.energy.gov

  2. Combustion Control in Fluidized Bed Boilershttps://www.sciencedirect.com

  3. Advanced CFB Fuel Management Techniqueshttps://www.researchgate.net

  4. Thermal Efficiency in Industrial Boilershttps://www.epa.gov

  5. Heat Recovery Solutions in CFB Plantshttps://www.bioenergyconsult.com

  6. Air Distribution and Combustion Efficiency in CFBshttps://www.mdpi.com

  7. CFB Boiler Maintenance Best Practiceshttps://www.energysavingtrust.org.uk

  8. Boiler Performance Monitoring Technologieshttps://www.automation.com

  9. Fluidization and Fuel Flexibility in CFB Boilershttps://www.iea.org

  10. CFB Boiler Emissions and Efficiency Trendshttps://www.asme.org

Andy Zhao

Senior Sales Manager
30+ boiler projects experience, focus on high-end customization, non-standard & special fuel boiler sales. Representative projects include waste heat boilers for Russian EVRAZ Steel, Coal CFB Boiler for Indonesia QMB New Energy Materials, HP drum & LP drum For Italian Nooter/Erisken, MP drum for Korean Hyundai Steel, LP drum for Korean POSCO Steel, 2 sets Air Cooling Coil for Finland Metso. Boiler Sales in Africa, Central Asia, Taiwan, etc.

Wade Zhang

CEO of Taishan Group Taian Boao International Trade Co., Ltd. 30 years experience in Global industrial boiler market,  Over 300 boiler projects experience, including 21+ EPC projects. Projects span 30+ countries & regions, involving industries such as nuclear power, energy & electricity, municipal heating, mining, textiles, tires etc.

How to Optimize Circulating Fluidized Bed Boiler Performance for Lower Operating Costs Read More »

Key Factors Influencing Heat Transfer and Combustion Efficiency in Industrial Gas-Fired Boilers

Key Factors Influencing Heat Transfer and Combustion Efficiency in Industrial Gas-Fired Boilers

Industrial gas-fired boilers are known for their high combustion efficiency, fast response times, and clean-burning characteristics. However, to fully leverage their advantages, it’s critical to understand the factors that influence both heat transfer and combustion efficiency. If these elements are neglected, it can result in increased fuel consumption, heat loss, uneven flame patterns, and higher operational costs. Optimizing efficiency starts with identifying what affects it most—and taking corrective action.

The heat transfer and combustion efficiency in industrial gas-fired boilers are primarily influenced by the burner type, air-to-fuel ratio, flue gas temperature, heat exchanger cleanliness, flame stability, and boiler load patterns. Combustion efficiency depends on how completely the fuel is burned with minimal excess air and CO emissions. Heat transfer efficiency is affected by how well the boiler captures and transfers heat from combustion gases into the steam or water. Maintaining proper burner settings, cleaning heat surfaces, and minimizing heat losses are essential for ensuring stable, energy-efficient boiler operation.

Let’s explore the technical factors that affect performance and how to manage them effectively.

How Does Burner Design and Mixing Quality Affect Combustion Efficiency?

In industrial and commercial combustion systems, burner inefficiency often hides in plain sight. Even with premium fuels and advanced controls, poor burner design or inadequate fuel-air mixing can lead to incomplete combustion, excessive fuel use, and high emissions. These inefficiencies increase operational costs, violate environmental limits, and stress downstream equipment. The geometry and mechanics of the burner, along with the quality of air-fuel interaction, directly determine how completely fuel is converted into useful heat. Optimizing these elements is key to maximizing energy output and minimizing waste.

Burner design and mixing quality are critical to combustion efficiency because they control how well fuel and air are combined before ignition. Effective mixing ensures a stable, uniform flame and complete combustion, which maximizes heat release and minimizes unburned fuel, carbon monoxide, and particulate emissions. Advanced burner designs, such as swirl-stabilized or staged-air burners, enhance turbulence and ensure proper stoichiometry across the flame zone. Poor designs or uneven mixing lead to hot spots, flame instability, and higher fuel consumption.

Whether you’re operating a gas turbine, steam boiler, or industrial furnace, burner design is not just a mechanical detail—it’s a foundational driver of thermal and economic performance.

Poor air-fuel mixing leads to incomplete combustion and energy losses.True

Incomplete mixing results in localized fuel-rich or fuel-lean zones, which burn inefficiently and emit pollutants.

🔥 How Burner Design Influences Combustion Performance

Burners are not just nozzles—they are engineered systems that control:

  • Fuel injection pattern

  • Air swirl and turbulence

  • Flame anchoring

  • Thermal recirculation

Key Burner Components and Their Roles:

ComponentFunctionImpact on Efficiency
Swirl VanesCreate turbulent air flowImproves mixing and stabilizes flame
Flame HoldersAnchor the flame to prevent blowoutEnsures combustion continuity
Primary/Secondary Air ZonesControl staged combustionReduces NOx, improves burnout
Nozzles/Spray TipsDetermine droplet size and distributionAffects evaporation and ignition
Combustion Head GeometryShapes the flame cone and recirculation zoneDirects heat back into reaction zones

For example, a low-NOx burner may use staged air injection and a central swirl core to maintain combustion at lower peak temperatures—reducing both NOx and unburned fuel.

📉 Effects of Poor Mixing on Combustion

Air-Fuel ConditionResulting Flame IssueEfficiency Consequence
Poorly Mixed – Fuel RichSoot, CO formationIncomplete combustion, energy loss
Poorly Mixed – Air RichLow flame temp, slow burnHeat loss, unburned O₂ in exhaust
Poor Flame AnchoringFlame instability, blowoutSystem trips, burner cycling
Low TurbulenceStratified combustion zonesUneven heat distribution, hotspots

High turbulence in the combustion zone improves mixing and flame stability.True

Turbulence increases the contact surface area between fuel and air, accelerating the combustion reaction and stabilizing the flame.

📊 Case Comparison: Burner Designs and Efficiency Metrics

Burner TypeEfficiency (%)CO Emissions (ppm)NOx Emissions (ppm)Stability Range (%)
Conventional Jet Burner84.511015070–100
Swirl-Stabilized Burner91.2408050–110
Staged-Air Low-NOx Burner93.0255560–120

In one retrofit project for a district heating boiler, replacing a conventional burner with a swirl-stabilized version increased efficiency by 6.7%, reduced CO by over 60%, and improved part-load stability.

🔧 How to Improve Burner Mixing and Performance

StrategyApplicationBenefit
Use Swirl Vanes or Bluff BodiesInduce vortex motionPromotes turbulence and recirculation
Pre-Mixed Fuel-Air SystemsBlend air and fuel before injectionEnsures uniform stoichiometry
Staged Combustion ZonesIntroduce air or fuel in stagesControls peak temperature and pollutant formation
Automated Air-Fuel Ratio ControlsAdjust mix in real timeMaintains ideal combustion conditions
CFD-Optimized Burner ShapesSimulate flow and flame before fabricationMinimizes trial-and-error, boosts design performance

For multi-fuel systems (e.g., biomass/gas co-firing), flexible burners with adaptive air-fuel delivery can dynamically adjust to fuel properties.

Swirl burners achieve better mixing and flame stability than straight-flow designs.True

Swirl burners create recirculation zones that stabilize the flame and enhance air-fuel mixing, improving combustion efficiency.

🧪 Engineering Insight: Mixing Quality Index (MQI)

In burner design, engineers use a metric called Mixing Quality Index (MQI) to evaluate how evenly air and fuel are distributed across the flame:

  • MQI > 0.9 → Excellent, homogeneous mixing

  • MQI 0.6–0.9 → Acceptable but can cause localized inefficiencies

  • MQI < 0.6 → Poor mixing, prone to instability and emissions

Advanced burners are CFD-tuned to maintain an MQI of 0.9 or higher across their operating range.

📋 Real-World Example: Industrial Furnace Upgrade

A steel reheat furnace had uneven temperature profiles due to poor burner mixing. After switching from conventional burners to staged-air swirl burners:

  • Combustion efficiency increased by 9.4%

  • Fuel consumption dropped by 12.7%

  • Flame distribution became uniform across furnace width

  • NOx emissions cut by 46%

Payback was achieved in under 18 months through fuel savings alone.

Summary

Burner design and air-fuel mixing quality are core drivers of combustion efficiency. Properly mixed fuel and air ensure complete combustion, stable flames, and optimal heat release with minimal emissions. Whether through advanced burner geometry, staged combustion, or smart automation, modern burner technologies can dramatically reduce energy waste and improve thermal system reliability. For any heat-intensive operation, investing in better burners and mixing strategies isn’t just technical—it’s financially and environmentally essential.

WNS Oil Gas (7)

Why Is Air-to-Fuel Ratio Tuning Critical for Optimal Flame Temperature and Stability?

In combustion systems—from power boilers to industrial furnaces—the secret to consistent performance, high efficiency, and low emissions lies in a deceptively simple concept: the air-to-fuel ratio. When this ratio is off balance, it leads to cold flames, unstable operation, excess oxygen loss, or dangerous levels of unburned fuel and carbon monoxide. But when it’s precisely tuned, the flame burns cleanly, hotly, and consistently—maximizing energy output and minimizing waste. Air-to-fuel ratio tuning is the fine control that makes the difference between optimized combustion and chronic inefficiency.

Air-to-fuel ratio tuning is critical for optimal flame temperature and stability because it determines the exact balance of oxygen and fuel required for complete combustion. Too much air cools the flame and increases stack losses, while too little air leads to incomplete combustion and emissions of carbon monoxide. A properly tuned ratio ensures a stable, high-temperature flame with minimal pollutants and consistent heat transfer. It also reduces equipment wear, improves fuel economy, and enhances combustion control across load variations.

Whether in natural gas systems, biomass boilers, or diesel-fired engines, precise air-to-fuel control is the cornerstone of efficient and safe combustion.

The correct air-to-fuel ratio ensures complete combustion and optimal flame temperature.True

When the air-to-fuel mix is precisely tuned, all fuel is oxidized efficiently, creating a stable, hot flame with minimal emissions.

🔬 Understanding the Air-to-Fuel Ratio (AFR)

The stoichiometric air-to-fuel ratio is the exact amount of air required to completely burn a given amount of fuel. Real-world systems often operate with slight excess air to ensure complete combustion, accounting for imperfect mixing and variable fuel quality.

Typical Stoichiometric Ratios:

Fuel TypeStoichiometric AFR (mass basis)Excess Air Target (%)O₂ in Flue Gas (%)
Natural Gas17.2:110–15%2–3%
Fuel Oil14.5:115–20%3–4%
Biomass (Wood)5–7:125–35%5–8%
Coal9.5–12:120–25%4–6%

The “ideal” excess air provides a buffer that ensures all fuel molecules find enough oxygen—without sending heat up the stack.

📉 Effects of Incorrect Air-Fuel Ratios

Air-Fuel ConditionFlame CharacteristicEfficiency/Emission Impact
Too Much Air (Lean)Cool, slow flameHeat loss, high O₂ in exhaust, low efficiency
Too Little Air (Rich)Yellow, unstable flameCO/HC emissions, soot, fouling
Ideal Ratio (Stoichiometric + Excess Air)Blue/white, stable flameMaximum heat transfer, lowest emissions

Operating a burner at a rich air-to-fuel ratio improves combustion efficiency.False

Rich conditions lead to incomplete combustion, generating carbon monoxide and unburned fuel, which reduce efficiency.

🔧 How Tuning Affects Flame Temperature and Stability

Flame Temperature Response to AFR:

ConditionFlame Temperature (°C)Flame Stability
Rich (Too Little Air)1,700–1,850Unstable, smoky
Stoichiometric~2,000Stable, efficient
Lean (Too Much Air)1,400–1,600Weak, fluttering

The maximum flame temperature occurs near stoichiometric conditions. Lean or rich conditions reduce thermal energy, increasing fuel demand and decreasing heat transfer efficiency.

📋 Common AFR Tuning Challenges

ProblemCauseEffect
Sensor DriftWorn O₂ analyzers or miscalibrated sensorsIncorrect AFR tuning
Variable Fuel CompositionBiogas, biomass, or mixed fuelsInconsistent flame, efficiency drop
Air LeakageCracked seals or gasketsArtificially high O₂ readings
Fan Speed InstabilityInconsistent airflowAFR fluctuation, flame instability

Effective AFR tuning must adjust in real time to these variables to maintain combustion quality.

🧠 Tools for Accurate AFR Tuning

Tool/TechnologyFunctionBenefit
Oxygen Trim ControllersAdjust air dampers based on flue gas O₂ levelsKeeps excess air within optimal range
CO/CO₂ SensorsDetect incomplete combustion in flue gasVerifies fuel burn completeness
Fuel FlowmetersEnsure consistent and measured fuel deliveryEnables precise fuel-air calibration
Stack Temperature SensorsIdentify heat loss trendsDiagnoses over- or under-fired systems
Automated Burner Management SystemsSync air and fuel adjustmentsMaintains stable operation across loads

Using an oxygen trim system helps maintain optimal combustion by adjusting for excess air.True

Oxygen trim systems fine-tune air flow based on real-time flue gas O₂ data, maintaining efficient and clean combustion.

📊 Real-World Impact of AFR Tuning

Before TuningAfter AFR OptimizationResult
O₂: 6.5%, CO: 220 ppmO₂: 3.2%, CO: <10 ppm+6% efficiency, stable flame
Flue Gas Temp: 240°CFlue Gas Temp: 190°CLower stack losses
Fuel Usage: 1,200 m³/dayFuel Usage: 1,080 m³/day$18,000 annual savings

These improvements came from a mid-sized commercial boiler after installing a real-time O₂/CO sensor and tuning the burner air-fuel curves.

🔍 Case Study: Glass Furnace Application

In a glass manufacturing facility, flame instability caused yield losses due to inconsistent melting. After installing:

  • Flue gas analyzers

  • Automated AFR control system

  • Low-NOx burners with swirl vanes

Results:

  • Flame stabilized across load swings

  • Combustion efficiency increased by 7.4%

  • NOx reduced by 39%

  • Product uniformity improved

Flame stability is enhanced when the air-to-fuel ratio is tuned to match load variations.True

Load-dependent tuning ensures that the burner maintains an ideal flame even as demand changes, preventing fluctuations.

Summary

Precise air-to-fuel ratio tuning is vital for achieving optimal flame temperature, combustion efficiency, and system stability. When tuned correctly, it ensures that every unit of fuel is fully utilized, the flame burns hot and steady, and emissions are minimized. Whether through manual adjustments, automated trim systems, or sensor-based feedback loops, effective AFR tuning transforms combustion from a reactive process into a finely controlled energy conversion system. For any thermal operation, tuning the air-to-fuel ratio isn’t optional—it’s fundamental to performance and profitability.

How Does Flue Gas Temperature Reflect the Effectiveness of Heat Transfer?

In thermal systems such as boilers, furnaces, and heat exchangers, the temperature of the flue gas isn’t just a number—it’s a powerful indicator of how much energy is being transferred to the working fluid and how much is being wasted. High flue gas temperatures suggest that a large portion of the combustion heat is escaping up the stack instead of being absorbed by the heat exchanger surfaces. This not only increases fuel consumption but also raises emissions and operational costs. Monitoring and managing flue gas temperature is therefore one of the most effective ways to assess and optimize heat transfer performance.

Flue gas temperature reflects the effectiveness of heat transfer because it indicates how much thermal energy remains in the combustion gases after passing through the heat exchange surfaces. Lower flue gas temperatures generally mean more heat has been successfully transferred to the process fluid (like water or steam), improving system efficiency. Higher flue gas temperatures point to poor heat absorption due to fouling, under-loading, or inadequate surface area, which leads to energy waste. Optimizing flue gas temperature helps reduce fuel usage, emissions, and stack losses.

In short, the cooler the flue gas (above the dew point), the more heat is being recovered and utilized—making it a vital metric in any combustion-based system.

High flue gas temperature indicates that less heat is being absorbed by the system.True

If flue gases exit the system too hot, it means not enough energy has been transferred to the working fluid, reducing thermal efficiency.

🌡️ The Role of Flue Gas Temperature in the Thermal Equation

During combustion, fuel releases energy in the form of high-temperature gases. These gases pass over or through heat exchange surfaces—transferring energy to water, steam, or process fluids. The difference between flame temperature and flue gas temperature tells us how much energy has been captured.

ZoneTemperature RangeFunction
Flame/Core Combustion Zone~1,800–2,000°C (natural gas)Heat generation
Heat Transfer Zone300–600°CEnergy absorbed by tubes/walls
Flue Gas Exit Stack120–250°C (typical)Remaining heat (stack loss)

When the flue gas temperature is closer to the flame temperature, it indicates poor heat extraction. Conversely, a significant drop means good heat transfer performance.

📉 Efficiency vs. Flue Gas Temperature

Flue Gas Temperature (°C)Efficiency Loss (Stack Loss %)Boiler Efficiency (%)
1209.5~90.5
16013.5~86.5
20017.0~83.0
24021.0~79.0
28024.5~75.5

This shows a strong inverse correlation: as flue gas temperature increases, efficiency drops, primarily due to wasted heat escaping into the atmosphere.

Lower flue gas temperatures usually mean higher system efficiency, provided they stay above the dew point.True

Keeping flue gas temperature just above dew point prevents corrosion while ensuring more heat is recovered into the system.

⚠️ What Causes High Flue Gas Temperature?

CauseDescriptionImpact on Heat Transfer Efficiency
Fouled Heat SurfacesSoot, scale, or ash insulates transfer surfacesReduces heat absorption
Improper Burner TuningFlame not optimized for heat contactPoor flame impingement
Low Boiler LoadFewer surfaces active, less energy transferredInefficient operation under partial load
Bypassed EconomizersHeat recovery not fully engagedFlue gas remains hotter
Damaged Baffles or TubesGas flow short-circuits around transfer areasHeat “slips by” instead of transferring

Flue gas temperature cannot be used as a reliable efficiency indicator.False

Flue gas temperature is a proven metric for assessing heat transfer effectiveness and system efficiency in combustion systems.

🔧 How to Optimize Flue Gas Temperature

Optimization ActionMethod/ToolResult
Clean Heat Exchange SurfacesManual or automated soot blowersImproves thermal conductivity
Use EconomizersAdd heat recovery to preheat waterDrops flue gas temp by 40–80°C
Tune Air-Fuel RatioOxygen trim systemsEnsures complete combustion without excess air
Monitor Stack Temperature TrendsDigital sensors and alarmsDetects fouling and efficiency loss early
Add Condensing Heat RecoveryCapture latent heat from vaporReduces temp below 90°C (in gas systems)

A 15°C drop in flue gas temperature can improve overall thermal efficiency by 1%–2%, translating to thousands of dollars in annual fuel savings in large industrial settings.

🧪 Case Study: Chemical Plant Boiler Optimization

A chemical processing facility running a 12 MW steam boiler recorded flue gas temperatures averaging 245°C and inconsistent steam output.

Diagnostics revealed:

  • Soot buildup on fire tubes (0.9 mm thick)

  • Improper air-fuel tuning (O₂ at 6.5%)

  • Economizer bypass valve stuck open

Actions Taken:

  • Tube brushing and soot blowing

  • Air-to-fuel ratio retuned (O₂ to 3%)

  • Economizer line repaired and re-engaged

Results:

  • Flue gas temperature reduced to 175°C

  • Boiler efficiency increased by 7.2%

  • Fuel savings: $56,000/year

  • CO emissions cut by 58%

Economizers and soot cleaning can significantly lower flue gas temperature and improve heat recovery.True

These measures increase surface area efficiency and allow more energy to be extracted from the combustion gases.

📋 Monitoring Tools for Flue Gas Temperature

InstrumentUse Case
Stack ThermocouplesReal-time measurement of flue gas temp
Digital Flue Gas AnalyzersCorrelates temp with O₂, CO, NOx readings
Thermal Imaging CamerasDetects heat leaks or hot spots visually
AI-Based Efficiency ModelsPredicts performance based on temp trends

In automated systems, flue gas temperature is constantly compared to setpoints, triggering alerts or control responses when efficiency drifts.

Summary

Flue gas temperature is one of the most important indicators of how effectively a combustion system is transferring heat. Lower temperatures (within safe limits) mean more energy has been captured and utilized, while higher temperatures signal inefficiency and waste. By monitoring and optimizing this parameter through cleaning, tuning, and heat recovery systems, operators can improve energy efficiency, lower fuel costs, and reduce emissions. In any boiler or furnace, the heat that escapes up the stack is the heat you paid for and never used—flue gas temperature helps you stop that loss.

What Role Do Soot, Scaling, and Fouling Play in Lowering Thermal Efficiency?

In combustion-based systems like boilers, heat exchangers, and furnaces, thermal efficiency depends on the direct transfer of heat from the combustion gases to the working fluid (such as water or steam). But this critical heat pathway is often blocked—coated with soot, scale, or other fouling materials. These deposits act as thermal insulators, reducing heat absorption and forcing the system to burn more fuel to maintain output. The result? Higher operational costs, reduced capacity, and unnecessary emissions. Understanding and controlling these buildup mechanisms is essential to preserving system performance and energy efficiency.

Soot, scaling, and fouling lower thermal efficiency by forming insulating layers on heat transfer surfaces, preventing effective heat exchange between combustion gases and the process fluid. Soot results from incomplete combustion and collects on fire-side surfaces, scale forms from mineral deposits in water systems, and fouling includes various residues like dust, oil, or biofilms. Even thin layers of these materials can drastically reduce heat transfer rates, causing higher flue gas temperatures, increased fuel consumption, and reduced output efficiency. Regular cleaning and water treatment are crucial to maintaining optimal thermal performance.

These unwanted layers might be invisible on the outside—but they have a visible impact on your energy bills and system reliability.

Fouling on heat transfer surfaces acts as an insulating layer and reduces thermal efficiency.True

Deposits such as soot, scale, or corrosion resist heat flow, forcing combustion systems to use more fuel to achieve the same output.

🔬 What Are Soot, Scale, and Fouling?

TypeSourceSurface AffectedTypical Composition
SootIncomplete combustionFire-side tubesCarbon, unburned hydrocarbons
ScaleHard water mineralsWater-side tubesCalcium carbonate, magnesium
FoulingExternal contaminants or internal corrosionBoth sidesDust, oil, corrosion products

Each deposit type reduces the rate at which heat moves from the combustion gases into the process fluid. Over time, this forces the boiler or heat exchanger to work harder, increasing fuel consumption and maintenance frequency.

📉 Efficiency Loss vs. Deposit Thickness

Deposit TypeThickness (mm)Heat Transfer Efficiency Loss (%)Fuel Use Increase (%)
Soot0.32–4%3–5%
Scale1.010–15%12–20%
Fouling Mix1.5+20–25%25–30%

Even minimal deposits can have a significant impact. A 0.7 mm soot layer can raise flue gas temperatures by 50°C, while 1 mm of scale can insulate metal tubes so effectively that boiler efficiency drops by 12% or more.

Removing soot and scale has minimal impact on fuel savings.False

Cleaning these deposits restores heat transfer pathways, improves combustion efficiency, and directly reduces fuel consumption.

⚠️ Additional Effects on System Performance

Beyond thermal loss, soot, scale, and fouling cause a host of operational issues:

  • Increased Flue Gas Temperature → Indicates poor heat absorption

  • Higher Stack Losses → More heat wasted through exhaust

  • Pump Overload → Water-side fouling increases hydraulic resistance

  • Soot Fires or Tube Failures → Hot spots caused by poor heat distribution

  • Reduced Steam Output → Longer heating cycles or lower process throughput

  • Corrosion Under Deposits (CUI) → Moisture trapped beneath deposits degrades metal

In biomass and coal systems, fouling also includes ash, slag, and clinkers—hard residues that bond to heat exchanger surfaces and are difficult to remove.

🔧 Prevention and Cleaning Strategies

MethodTarget DepositFrequencyBenefit
Soot BlowersFire-side sootDaily/WeeklyMaintains heat exchange efficiency
Chemical DescalingWater-side scaleQuarterly to AnnuallyDissolves mineral buildup
Online Tube Cleaning BallsInternal foulingContinuousPrevents buildup during operation
Manual BrushingMixed foulingDuring shutdownThorough mechanical cleaning
Water TreatmentScale preventionContinuousReduces mineral deposits at the source

Water-side scale buildup is prevented through chemical water treatment.True

Softening, demineralization, and dosing control reduce the risk of mineral precipitation that leads to scaling.

📊 Case Study: District Heating Boiler

A 10 MW biomass-fired district heating boiler exhibited high flue gas temps (265°C) and low steam output. Inspection revealed:

  • Soot buildup: ~0.5 mm

  • Ash fouling in superheater

  • Economizer water-side scaling (~1.2 mm)

After maintenance:

  • Flue gas temperature dropped to 190°C

  • Steam output increased by 9.8%

  • Annual fuel savings: ~$76,000

  • Efficiency gain: 8.5%

These improvements came solely from cleaning, without changing any core hardware.

📋 Monitoring and Detection Tools

ToolUseInsight Provided
Flue Gas ThermometerStack temperature trackingEarly warning of fouling
Infrared CameraSurface temperature inspectionDetects hot spots and blocked tubes
Ultrasonic Thickness GaugeWall loss detectionMonitors scale or corrosion effects
Combustion AnalyzerO₂, CO, and flue gas compositionVerifies combustion efficiency

Thermal efficiency tracking is now often part of automated boiler management systems, with AI-based alerts for soot accumulation or scale-induced resistance.

Summary

Soot, scale, and fouling are silent saboteurs in thermal systems, steadily degrading efficiency by blocking heat transfer. These deposits raise flue gas temperatures, increase fuel consumption, reduce steam output, and accelerate wear and corrosion. Even small accumulations can cut thermal efficiency by over 10%. Through proactive cleaning, monitoring, and preventive maintenance like water treatment and soot blowing, facilities can sustain peak performance, reduce operational costs, and extend equipment lifespan. In thermal engineering, a clean surface is an efficient surface—and that principle pays dividends in every run cycle.

How Do Load Variation and Turndown Ratio Influence Efficiency During Part-Load Operation?

Most industrial and commercial boilers rarely operate at full capacity for extended periods. Instead, they respond dynamically to fluctuating demand. However, combustion systems aren’t naturally efficient when throttled back. If the turndown ratio—the range over which the boiler can modulate its output—is too low, the boiler will cycle on and off to meet demand, leading to inefficiency, premature wear, and unstable operation. If properly designed and matched to the load profile, a high turndown ratio allows for efficient, continuous operation even at part-load, maintaining combustion efficiency and reducing operating costs.

Load variation and turndown ratio influence part-load efficiency because they determine how well a boiler can match output to fluctuating demand without cycling. A limited turndown ratio forces the system to shut off and restart frequently at low loads, wasting fuel during purges and reheating. In contrast, a higher turndown ratio allows continuous burner operation at reduced capacity, maintaining combustion efficiency and reducing excess air and thermal losses. This ensures stable flame control, lower emissions, and improved energy performance under varying load conditions.

In facilities with daily or seasonal demand swings, matching boiler modulation to the load profile is critical for sustained thermal efficiency.

Low turndown ratios lead to inefficient on-off cycling during part-load operation.True

Without the ability to modulate, boilers with low turndown must restart frequently, leading to purge losses, inefficiency, and equipment stress.

🔄 Understanding Load Variation and Turndown Ratio

Definitions:

TermMeaning
Load VariationFluctuations in heat or steam demand over time
Turndown RatioMaximum to minimum burner firing rate (e.g., 10:1)
Part-Load OperationBoiler runs at less than full capacity

For example, a 10:1 turndown ratio means a 10 MMBtu/hr boiler can modulate down to 1 MMBtu/hr. A 3:1 ratio would require cycling off below 3.3 MMBtu/hr demand.

📉 Efficiency vs. Turndown Ratio at Part Load

Load (%)Efficiency (Low Turndown, 3:1)Efficiency (High Turndown, 10:1)
10087%87%
7583%85%
5078%84%
2571%81%
1064% (cycling)79% (continuous)

These numbers illustrate the significant efficiency drop when a low turndown system cycles frequently under low-load conditions.

High turndown ratio burners maintain better combustion efficiency during low-load periods.True

They allow continuous modulation at low output levels, avoiding purge and reheat losses associated with on-off cycling.

🔥 How Cycling Affects Boiler Performance

Frequent on-off cycling causes:

  • Purge losses: Each startup blows cold air through the system, wasting heat

  • Delayed re-heating: Restarting takes time and energy

  • Increased emissions: Startup conditions often burn fuel less cleanly

  • Thermal stress: Expanding and contracting components reduce system life

  • Control instability: Difficulty maintaining consistent output temperature or pressure

In some cases, cycling can increase fuel use by 10–20%, especially in systems with low mass or poor insulation.

⚙️ Matching Load Profile to Turndown Design

Load Profile TypeBest Turndown RatioRecommended Boiler Strategy
Flat/Steady Load3:1 or 4:1Conventional burner with basic controls
Daily Load Swings8:1 or higherModulating burner with feedback controls
Low Base, High Peaks10:1 or higherMultiple small boilers (modular plant)
Seasonal Variation≥10:1One high turndown + one small base-load unit

Modular boiler systems with master sequencing can load-share based on real-time demand, optimizing both turndown and runtime hours per unit.

Burner cycling improves boiler system reliability over time.False

Cycling introduces mechanical stress, increases maintenance needs, and shortens component lifespan. Continuous operation is more reliable.

🧠 Technologies That Improve Part-Load Efficiency

TechnologyFunctionBenefit
Oxygen Trim ControlAdjusts air-fuel ratio in real timeMaintains ideal combustion at low loads
Parallel Positioning SystemSeparates fuel and air valve controlImproves ratio precision during modulation
VFDs for Blowers and PumpsMatch flow to loadReduces parasitic energy losses
Condensing EconomizersRecover latent heat at low loadsEnhances efficiency during low-temperature return
Modular Boiler ArraysTurn units on/off based on loadKeeps each unit near peak efficiency

📊 Case Study: Food Plant Boiler Optimization

A food processing facility operated a 6 MMBtu/hr boiler with a 3:1 turndown ratio. Night-shift demand dropped to ~1.2 MMBtu/hr, forcing the boiler to cycle every 12 minutes.

Problems:

  • Flue gas temps high (~270°C) during recovery

  • CO spikes during startups

  • Frequent blower faults

Solutions Implemented:

  • Burner retrofit to 10:1 turndown

  • Installed oxygen trim and VFD blower

  • Added sequencing logic to allow longer low-fire hold

Results:

  • Efficiency improvement: +6.5%

  • CO reduced by 78%

  • Fuel savings: ~$29,000/year

  • Unplanned downtime reduced by 40%

High turndown burners help maintain flame stability during rapid load changes.True

They allow smooth modulation without shutoffs, preventing instability and reducing the risk of flameout.

Summary

Load variation is a reality in most combustion systems, but its negative effects on efficiency can be mitigated through appropriate turndown ratio design and smart control strategies. High turndown ratios allow boilers to operate continuously at reduced output, avoiding the inefficiencies and mechanical stress of on-off cycling. With proper burner technology, oxygen trim, and modulation controls, even part-load operation can be efficient, stable, and clean. In dynamic load environments, the key to maintaining high performance is the ability to turn down—not shut down.

What Maintenance and Monitoring Practices Help Sustain High Combustion and Heat Transfer Efficiency?

Even the best-designed combustion and heat transfer systems lose efficiency over time—not from design flaws, but from neglect. Without regular maintenance and continuous monitoring, soot, scale, corrosion, and equipment drift begin to degrade performance. Combustion efficiency drops as burners fall out of tune. Heat transfer becomes sluggish as surfaces foul. Fortunately, these losses are preventable. With the right practices in place, facilities can sustain peak efficiency, reduce emissions, and avoid unplanned downtime. Effective maintenance and monitoring are the front-line defense against energy waste.

Maintenance and monitoring practices sustain high combustion and heat transfer efficiency by keeping burners properly tuned, ensuring heat transfer surfaces are clean, and detecting performance issues before they escalate. Essential actions include flue gas analysis, oxygen trim system calibration, regular soot and scale removal, infrared thermography, and condition-based inspections. These practices optimize air-fuel ratio, restore heat exchanger performance, and prevent efficiency losses due to fouling or equipment wear. By implementing a proactive maintenance plan, facilities can maintain consistent energy output with lower fuel use and reduced emissions.

In high-performance thermal systems, maintaining efficiency is not a one-time event—it’s a continuous process of inspection, adjustment, and refinement.

Regular burner tuning and cleaning of heat exchange surfaces are essential for sustaining thermal efficiency.True

These tasks ensure complete combustion and effective heat transfer, preventing energy loss and fuel overuse.

🔧 Key Maintenance Practices for Combustion and Heat Transfer Systems

TaskPurposeFrequency
Burner TuningOptimize air-fuel ratioQuarterly or seasonally
Soot BlowingRemove carbon buildup on fire-side surfacesDaily to weekly
Chemical DescalingRemove mineral scale from water-side surfacesAnnually or as needed
Refractory InspectionEnsure thermal containment and safetyAnnually
Control Sensor CalibrationMaintain accuracy of combustion dataQuarterly
Pressure and Temp Gauge ChecksVerify safe and consistent operationMonthly

Burner tuning alone can improve combustion efficiency by 2–5%, especially when oxygen levels are brought within the optimal 2–4% range in flue gas.

🔍 Essential Monitoring Tools

Monitoring ToolMeasurementBenefit
Flue Gas AnalyzerO₂, CO, CO₂, NOxOptimizes combustion settings
Stack ThermocoupleFlue gas temperatureTracks heat transfer efficiency
Infrared ThermographySurface temperature profilesDetects insulation loss and fouling zones
Ultrasonic Thickness GaugeWall thinning and corrosionPrevents structural failure and inefficiency
Combustion Efficiency MetersCombined analysis of multiple parametersReal-time performance feedback

Flue gas analysis is only useful during system startup.False

Continuous flue gas monitoring provides valuable insights into combustion quality and helps optimize air-fuel ratio at all times.

📊 Efficiency Impact of Neglected Maintenance

Issue DetectedCauseEfficiency Loss (%)Fuel Cost Impact (est.)
Excess O₂ (>6%) in Flue GasPoor burner tuning3–8%$15,000–$50,000/year
Soot Layer (0.5 mm)Incomplete combustion4–6%$12,000/year
Scale Layer (1 mm)Poor water treatment10–15%$20,000–$60,000/year
Uncalibrated SensorsInaccurate combustion dataVariablePerformance drift

Without proactive maintenance, energy waste compounds over time, driving up operational costs and emissions—even with premium equipment.

🧠 Smart Monitoring and Predictive Maintenance

Modern facilities are now integrating digital and AI-driven systems to transition from preventive to predictive maintenance.

TechnologyFunctionExample Use Case
O₂ Trim SystemsAuto-adjust air flow to maintain ideal O₂Keeps combustion efficient under load swings
AI Anomaly DetectionPredicts faults from real-time data trendsDetects fouling or flame instability early
Thermal Imaging DronesVisualize heat loss from large equipmentFinds leaks, insulation gaps
Digital Twin SimulationModels boiler performance virtuallyTests parameter changes without downtime
Cloud-Based SCADARemote performance tracking and alarmsMulti-site management with historical data

Facilities using real-time monitoring have reported up to 40% fewer unplanned outages and 15–20% improvement in average combustion efficiency.

AI-based monitoring systems can predict equipment degradation before it causes efficiency loss.True

By analyzing data trends from sensors, AI can forecast performance issues and recommend preventive action.

🧪 Case Study: Cogeneration Plant Maintenance Program

A 35 MW cogeneration plant with four gas-fired boilers faced rising fuel costs and emissions penalties. Investigations showed:

  • O₂ levels fluctuating between 6.5–8%

  • Flue gas temperatures rising steadily

  • Economizer fouling every 8–10 weeks

Solutions implemented:

  • Quarterly burner tuning and calibration

  • Installation of real-time O₂/CO sensors

  • Thermal imaging for economizer inspection

  • Transition from manual to automatic soot blowing

Results:

  • Boiler efficiency improved by 7.8%

  • Annual gas savings: $180,000

  • Emissions reduced by 14%

  • Maintenance-related downtime cut by 55%

📋 Maintenance Scheduling Framework

TimeframeMaintenance Task
Daily/WeeklySoot blowing, flue gas checks, ash removal
MonthlyPressure, temperature, and water quality inspections
QuarterlyBurner tuning, O₂ trim test, safety valve check
AnnuallyTube descaling, thermography, refractory inspection

A structured plan like this ensures that no performance-limiting issue goes unnoticed or unaddressed.

Summary

High combustion and heat transfer efficiency don’t come from equipment alone—they depend on vigilant maintenance and data-driven monitoring. Practices like burner tuning, flue gas analysis, and heat surface cleaning are essential to ensure complete combustion and optimal heat transfer. When combined with modern monitoring technologies such as infrared thermography and AI-powered analytics, facilities can move from reactive to predictive maintenance. The result: lower fuel bills, better emissions compliance, and consistent energy performance year-round. In combustion systems, performance is preserved by precision—and precision starts with maintenance.

🔍 Conclusion

To achieve optimal combustion and heat transfer efficiency in gas-fired boilers, operators must balance precise air-fuel control, clean heat exchange surfaces, and well-tuned burners. These factors work together to reduce energy losses, cut emissions, and maximize steam output. Regular efficiency audits and proactive system adjustments ensure that your gas-fired boiler remains a low-cost, high-performance asset in your energy infrastructure.


📞 Contact Us

💡 Looking to improve your gas-fired boiler’s efficiency? Our experts provide combustion tuning, thermal performance audits, and system upgrades designed to optimize fuel usage and heat recovery.

🔹 Let us help you unlock the full efficiency potential of your industrial gas-fired boiler! 🔥📈✅

FAQ

How does burner performance influence combustion efficiency?

Efficient burners provide a stable flame, proper atomization, and balanced fuel-air mixing. Modulating burners and oxygen trim systems help maintain optimal combustion conditions, ensuring complete fuel burn and minimizing energy losses and emissions.

Why is the air-to-fuel ratio critical in gas-fired boilers?

The air-to-fuel ratio affects flame temperature, combustion completeness, and oxygen availability. Too much excess air reduces flame temperature and increases heat loss via flue gas. Too little air leads to incomplete combustion, forming CO and soot.

What impacts heat transfer efficiency in gas-fired boilers?

Key factors include:

  • Clean heat exchanger surfaces

  • High temperature differentials between flue gas and water/steam

  • Turbulent water and flue gas flow

  • Proper boiler design and sizing
    Fouling or scaling on heat transfer surfaces greatly reduces thermal efficiency and increases fuel demand.

How do flue gas characteristics affect efficiency?

High flue gas temperature indicates that heat is not being fully transferred to the working fluid, pointing to poor efficiency. Monitoring flue gas O₂, CO₂, and temperature allows real-time combustion adjustments for improved fuel usage.

What operational practices can improve both heat transfer and combustion?

  • Perform regular maintenance and tube cleaning

  • Use oxygen trim systems for real-time combustion control

  • Install economizers or condensing heat exchangers

  • Optimize boiler cycling to minimize start-stop energy losses

  • Conduct routine flue gas analysis to fine-tune burner settings

References

  1. Gas Boiler Efficiency Optimization Guidehttps://www.energy.gov

  2. Combustion Tuning and Burner Performancehttps://www.sciencedirect.com

  3. Air-Fuel Ratio Effects in Gas Boilershttps://www.researchgate.net

  4. Heat Transfer Dynamics in Boilershttps://www.epa.gov

  5. Flue Gas Analysis for Efficiency Improvementhttps://www.bioenergyconsult.com

  6. Industrial Boiler Maintenance Best Practiceshttps://www.mdpi.com

  7. Using Economizers for Heat Recoveryhttps://www.energysavingtrust.org.uk

  8. Gas Boiler Design and Efficiency Trendshttps://www.iea.org

  9. Automated Controls in Gas-Fired Boilershttps://www.automation.com

  10. ASME Standards for Boiler Efficiencyhttps://www.asme.org

Wade Zhang

CEO of Taishan Group Taian Boao International Trade Co., Ltd. 30 years experience in Global industrial boiler market,  Over 300 boiler projects experience, including 21+ EPC projects. Projects span 30+ countries & regions, involving industries such as nuclear power, energy & electricity, municipal heating, mining, textiles, tires etc.

Key Factors Influencing Heat Transfer and Combustion Efficiency in Industrial Gas-Fired Boilers Read More »

How to Optimize Industrial Biomass Boiler Performance for Lower Operating Costs

How to Optimize Industrial Biomass Boiler Performance for Lower Operating Costs

Industrial biomass boilers offer a sustainable alternative to fossil-fuel-based systems, but to be economically viable, they must be optimized for maximum efficiency and minimum operational expense. Poor fuel quality, improper combustion control, and inadequate maintenance can result in unnecessary fuel waste, unplanned downtime, and increased emissions. With rising energy costs and tighter environmental regulations, achieving optimal boiler performance is essential for long-term profitability and sustainability.

To optimize industrial biomass boiler performance for lower operating costs, focus on key strategies such as using consistent, high-quality biomass fuel, maintaining proper combustion air control, minimizing heat losses, cleaning heat exchanger surfaces regularly, and utilizing automation and monitoring systems. Improvements in fuel handling, ash management, and flue gas heat recovery can significantly enhance boiler efficiency and reduce fuel consumption. Preventive maintenance and real-time performance monitoring further ensure stable operation and cost control.

Here’s a practical guide to key areas where performance improvements can lead to tangible savings.

biomass power station

How Does Biomass Fuel Quality and Moisture Content Affect Combustion and Fuel Costs?

Biomass energy systems offer a renewable alternative to fossil fuels, but their performance is highly sensitive to the quality and moisture content of the fuel. When biomass has high moisture levels or inconsistent quality, combustion becomes inefficient, emissions rise, and operating costs increase dramatically. These challenges not only reduce energy output per ton of fuel but also cause mechanical problems such as slagging, fouling, and corrosion in the combustion system. In contrast, using high-quality, low-moisture biomass ensures stable flame characteristics, cleaner burning, and lower fuel consumption per unit of energy produced.

Biomass fuel quality and moisture content significantly affect combustion efficiency and fuel costs because wet or poor-quality fuel requires more energy to evaporate water before combustion can occur. High moisture reduces flame temperature, causes incomplete combustion, increases emissions, and reduces boiler efficiency. As a result, more fuel is needed to produce the same amount of heat, increasing operational costs. Consistent, low-moisture, high-density biomass improves fuel economy, combustion stability, and overall plant performance.

Whether you’re operating a small biomass boiler or a utility-scale bioenergy plant, controlling fuel quality is key to maintaining economic and environmental efficiency. Below, we explore the critical relationship between biomass properties and system performance.

Biomass fuel with high moisture content increases energy output during combustion.False

High moisture biomass absorbs energy for water evaporation before combustion occurs, reducing the net energy output and efficiency.

🌲 Understanding Biomass Fuel Properties

Biomass fuel can include wood chips, pellets, agricultural waste, or energy crops. The properties that most affect combustion are:

PropertyIdeal RangeEffect on Combustion
Moisture Content10–20% (by weight)Higher values reduce net calorific value
Ash Content<2% for wood, <6% for agri-fuelsHigh ash causes slagging and fouling
Volatile Matter70–80%Affects ignition and flame quality
Bulk Density600–750 kg/m³ for pelletsInfluences feeding and storage
Particle Size5–50 mm (for most systems)Affects combustion rate and uniformity

High moisture content is the most critical issue because it reduces the net calorific value (NCV)—the actual usable heat from the fuel after accounting for the energy lost in evaporating water.

📉 How Moisture Content Reduces Combustion Efficiency

Every kilogram of water in biomass fuel must be evaporated before the fuel can burn. This consumes energy that would otherwise be used for heating.

Moisture Content (%)Net Calorific Value (MJ/kg)Boiler Efficiency (%)Fuel Usage Increase (%)
1016.585Baseline
2513.278+20%
4010.169+39%
508.260+60%

A biomass boiler burning wood chips with 50% moisture will need up to 60% more fuel to generate the same heat output compared to burning chips at 10–15% moisture.

Low-moisture biomass fuels result in higher combustion temperatures and better efficiency.True

Drier fuels burn more easily and produce higher flame temperatures, improving heat transfer and reducing excess air requirements.

🔥 Combustion Challenges with Wet Biomass

High moisture affects combustion in multiple ways:

  • Lower Flame Temperature: Reduces heat transfer rate and slows combustion reactions.

  • Incomplete Combustion: Wet fuel can lead to higher CO and unburned hydrocarbons.

  • Slagging & Corrosion: Low combustion temperatures encourage deposition and acid formation.

  • Delayed Ignition: Especially in systems with batch-fed or fixed-grate combustors.

  • Increased Particulate Emissions: Due to poor burnout and unstable combustion zones.

Systems designed for dry pellets may not tolerate moisture well. In contrast, fluidized bed combustors and rotary kilns can better handle variable moisture but still suffer efficiency loss.

💸 Economic Impacts of Poor Fuel Quality

High moisture biomass directly raises fuel costs in two ways:

  1. More fuel per unit energy: You burn more material to achieve the same thermal output.

  2. Higher auxiliary energy consumption: Fans, conveyors, and dryers must work harder.

Cost Example:

Biomass TypeMoisture (%)Required Fuel (tons/day for 10 MW output)Estimated Daily Fuel Cost ($)
Wood Pellets10%45$4,500
Wood Chips (25%)25%62$5,580
Green Wood (50%)50%83$7,050

Over a year, switching from 10% to 50% moisture fuel could increase operating costs by $900,000 or more for a medium-scale plant.

🔍 Fuel Quality Control and Best Practices

PracticePurposeTools/Methods
On-Site Moisture TestingValidate fuel before feedingMoisture analyzers, drying ovens
Fuel Storage ManagementPrevent re-wetting from rain or humidityCovered silos, dry storage sheds
Fuel Drying SystemsReduce moisture to optimal rangeBelt dryers, rotary drum dryers
Supplier Quality AgreementsEnforce fuel specsMoisture/ash/particle size contracts
Fuel Blending StrategiesMix wet and dry fuels for consistencyReal-time mixing conveyors or feed hoppers

In biomass CHP (combined heat and power) plants, using sensors and AI-driven control systems helps adjust air-fuel ratios dynamically to account for real-time fuel moisture changes, improving combustion stability.

Biomass fuels should always be used as-received to minimize processing costs.False

Processing such as drying and screening improves combustion efficiency and reduces operational costs in the long term.

🧪 Case Study: Biomass District Heating Plant

A 5 MW district heating system in Northern Europe initially burned fresh wood chips with 40% moisture content. Combustion was unstable, with visible smoke and high flue gas temperatures (~220°C). After installing a fuel dryer to reduce moisture to 15%, results included:

  • Boiler efficiency increase: from 69% to 87%

  • Flue gas temperature drop: from 220°C to 145°C

  • Fuel use reduction: ~38%

  • Payback period for dryer investment: 18 months

This example underscores the economic and operational importance of moisture control.

Summary

Biomass fuel quality and especially moisture content play a critical role in combustion efficiency, system reliability, and fuel cost. High-moisture fuel absorbs energy needed for water evaporation before burning can begin, lowering flame temperatures and increasing the amount of biomass required. In contrast, low-moisture, clean, and uniform biomass ensures efficient heat transfer, complete combustion, and lower emissions. For any biomass energy system to perform optimally, fuel quality must be actively monitored and managed—not just accepted.

Why Is Combustion Air Management Critical for Reducing Excess Air and Improving Efficiency?

Industrial boilers and combustion systems are often less efficient than they could be—not due to poor fuel or burner design—but because of ineffective combustion air management. Without careful control of air supply, too much air (excess air) can enter the system, cooling the flame, wasting energy, and increasing stack losses. Conversely, too little air results in incomplete combustion, producing carbon monoxide, soot, and other pollutants. Effective combustion air management is the key to striking the right balance, achieving complete combustion with minimal waste and maximum efficiency.

Combustion air management is critical because it directly controls the amount of excess air entering a combustion system. Proper management ensures just enough oxygen for complete combustion, avoiding energy losses from overheating unnecessary air and reducing stack losses. When excess air is minimized without compromising combustion quality, flame temperatures rise, fuel use decreases, and emissions are reduced. Tools like oxygen trim controls, variable speed drives, and dampers help fine-tune air flow in real time, boosting boiler or furnace efficiency by 5% to 15%.

Mastering this balance between fuel and air is one of the most powerful—and cost-effective—ways to improve thermal system performance.

Excess air above optimal levels increases combustion efficiency by enhancing oxygen availability.False

While a small amount of excess air is needed, too much cools the flame and increases heat loss through the exhaust, reducing efficiency.

🌬️ What Is Excess Air and Why Does It Matter?

Excess air is the additional air supplied beyond the theoretical stoichiometric requirement for complete combustion.

Key Definitions:

TermDefinition
Stoichiometric AirThe exact amount of air needed for complete combustion
Excess Air (%)Extra air above stoichiometric (usually 10–25%)
O₂ in Flue Gas (%)Used as an indicator of excess air

For most combustion systems, the target is to keep excess air between 10–20%, which corresponds to 2–4% O₂ in flue gas. Higher levels result in:

  • Lower flame temperatures

  • Increased heat losses through stack gases

  • Higher fuel consumption

📉 The Efficiency Cost of Too Much Air

Excess Air (%)Flue Gas O₂ (%)Stack Heat Loss (%)Estimated Boiler Efficiency (%)
51.115.286.5
153.017.584.0
306.221.580.0
509.525.076.0

Every 10% increase in excess air can reduce combustion efficiency by 1% to 2%, depending on the system. Over time, this can amount to tens or hundreds of thousands of dollars in fuel costs for large facilities.

Flue gas oxygen content is used to estimate the level of excess air in combustion systems.True

Measuring O₂ in flue gas provides a reliable way to calculate how much excess air is being supplied to the combustion process.

🔧 Tools and Techniques for Air Management

Modern air management systems combine sensors, actuators, and intelligent controllers to continuously optimize combustion conditions.

Components of an Efficient Air Management System:

ComponentFunction
O₂ SensorsMonitor oxygen in flue gas to determine excess air
Oxygen Trim ControllersAdjust dampers or fan speeds to maintain target O₂
Variable Speed FansModulate combustion air delivery based on demand
Damper PositionersAdjust air flow to burners precisely
Burner Control SystemsIntegrate fuel and air controls for optimal stoichiometry

By automatically adjusting air inputs based on real-time feedback, these systems maintain optimal combustion conditions even as fuel quality, load demand, or environmental conditions change.

🧪 Practical Effects of Poor Air Management

Poor combustion air management results in:

  • Excess fuel consumption: Due to flame cooling and incomplete heat transfer

  • High stack temperatures: Indicating wasted heat energy

  • CO formation and visible smoke: Caused by too little air or poor mixing

  • NOx spikes: From hot spots caused by uneven or fluctuating air supply

  • Increased maintenance: From soot buildup and corrosion

For example, a paper mill that installed an oxygen trim system on its biomass boiler saw:

  • Fuel use reduction: 6.8%

  • Boiler efficiency gain: From 80.2% to 86.1%

  • Return on investment: Achieved within 14 months

Oxygen trim systems reduce combustion efficiency when installed.False

Oxygen trim systems improve combustion efficiency by adjusting air flow based on flue gas oxygen levels to maintain optimal excess air.

📋 Best Practices for Combustion Air Optimization

PracticePurpose
Calibrate O₂ sensors regularlyEnsure accurate air adjustments
Clean burner and air pathsRemove obstructions that skew air-fuel ratios
Set air-fuel ratio by loadCustomize ratios for low, medium, and high loads
Install parallel positioning systemsMatch air/fuel valves separately for precision
Use flue gas analyzers for tuningConfirm combustion health and optimize system setup

These methods ensure that combustion remains efficient and compliant across all operational conditions.

🔍 Case Study: Hospital Boiler Retrofit

A large metropolitan hospital relied on a 6 MMBtu/h gas-fired boiler that operated year-round with load swings of 30–90%. Before optimization:

  • Excess air: 40–50%

  • O₂ levels: >7%

  • Stack temp: 260°C

  • Combustion efficiency: ~77%

After installing a variable-speed combustion air fan, oxygen trim system, and new burner controls:

  • Excess air reduced to 15%

  • O₂ levels held at 3%

  • Stack temp dropped to 185°C

  • Efficiency rose to 85.5%

  • Annual gas savings: ~$48,000

This demonstrates how even moderate improvements in air management can yield substantial cost and performance gains.

Summary

Combustion air management is at the heart of efficient and clean-burning systems. Controlling excess air through real-time measurement and adjustment ensures the right balance for complete combustion without wasting energy. Whether through basic damper control or advanced oxygen trim systems, managing air intelligently improves thermal efficiency, reduces fuel use, and enhances emissions compliance. In every combustion process, air is free—but mismanaging it can be very expensive.

Biomass boilers (9)

How Does Cleaning Soot and Ash from Heat Transfer Surfaces Impact Fuel Consumption?

In thermal systems like boilers, furnaces, and heat exchangers, energy efficiency is all about transferring heat effectively. But over time, soot and ash deposits form on heat transfer surfaces, creating a thick, insulating barrier between the flame and the process fluid. This fouling doesn’t just look bad—it blocks heat, forces longer burner operation, and consumes more fuel to meet the same energy demand. Without regular cleaning, these layers can cost facilities thousands of dollars annually in wasted fuel and maintenance downtime.

Cleaning soot and ash from heat transfer surfaces significantly reduces fuel consumption by restoring the system’s ability to transfer heat efficiently. Soot and ash act as insulators that block thermal energy from reaching the working fluid, causing longer burner run-times and increased flue gas temperatures. Even a thin layer of soot (as little as 1 mm) can reduce heat transfer efficiency by up to 10%, which forces the system to burn more fuel to achieve the same output. Regular cleaning can improve boiler efficiency by 5–15%, lowering fuel costs and emissions.

Whether your system runs on coal, oil, biomass, or gas, soot and ash removal is one of the simplest and most cost-effective ways to improve thermal performance.

Soot and ash deposits increase the heat transfer rate in boilers.False

These deposits act as thermal insulators, preventing efficient heat transfer and reducing system performance.

🔍 Why Do Soot and Ash Form?

Soot and ash are combustion byproducts:

  • Soot is made of unburned carbon particles and hydrocarbons.

  • Ash comes from mineral content in solid fuels like coal, wood, and biomass.

These particles settle on fire-side surfaces like:

  • Boiler fire tubes

  • Economizer tubes

  • Superheaters

  • Air preheaters

They cling tightly to metal and form a crust that traps heat inside the flue gases instead of passing it to water or steam.

📉 Impact on Fuel Consumption and Efficiency

Even small deposits can cause big losses. Here’s a breakdown:

Deposit ThicknessEfficiency DropExtra Fuel Use (%)Flue Gas Temp Rise
0.5 mm2–4%+3–5%+15–25°C
1.0 mm7–10%+8–10%+35–50°C
2.0 mm12–15%+15–18%+60–80°C

These figures are based on real-world combustion systems. In one large boiler burning heavy oil, just 1 mm of soot increased fuel consumption by 9%, raising operating costs by over $90,000 per year.

Removing soot from boiler tubes has no effect on fuel economy.False

Soot insulates the heat exchange surfaces, and its removal significantly improves thermal conductivity and reduces fuel use.

🔧 Cleaning Methods and Maintenance Frequency

Common Soot and Ash Removal Techniques:

MethodDescriptionBest For
Soot BlowersSteam or compressed air jets clean tubesLarge coal or biomass boilers
Manual BrushingTechnicians scrub tubes during maintenanceFire-tube boilers, economizers
Rotary CleanersMotorized brushes for internal tube cleaningShell-and-tube exchangers
High-Pressure WashingWater or solvent jets remove sticky ashBiomass and waste-fired units
Chemical CleaningSolvents dissolve hard deposits and corrosionOil-fired systems

📋 Recommended Cleaning Intervals

Fuel TypeCleaning IntervalNotes
Natural GasAnnuallyLess soot, but still subject to fouling
Heavy OilMonthly to QuarterlyHigh soot generation
Biomass (wood)Weekly to MonthlyAsh content and variability require frequent checks
CoalWeekly to Bi-weeklyHeavy slagging potential

In plants with online soot blowing systems, cleanings may occur several times per day automatically to prevent buildup.

🧪 Real-World Example: Biomass Boiler Case Study

A biomass boiler in a European district heating plant experienced:

  • Flue gas temps rising from 160°C to 235°C over two months

  • Combustion air fans running at 25% higher capacity

  • Boiler efficiency dropping from 84% to 75%

  • Increased fuel usage: 1.2 extra tons/day

After manual soot and ash cleaning:

  • Flue gas temperature dropped by 60°C

  • Fan power consumption normalized

  • Fuel savings of $45,000/year realized

The cleaning took just two days and paid back in less than two weeks.

Ash from biomass combustion can stick to heat exchanger surfaces and lower efficiency.True

Ash in biomass contains sticky components like potassium that bond to surfaces and form insulating layers, requiring frequent cleaning.

📈 Monitoring and Detection of Fouling

To optimize cleaning schedules and detect soot/ash buildup early, use:

ToolFunction
Flue Gas ThermometersMonitor for rising exhaust temperatures
Infrared CamerasDetect hot spots and heat transfer inefficiencies
Draft Pressure SensorsIndicate buildup via air resistance changes
Combustion AnalyzersCheck for declining efficiency and CO levels
AI Performance ModelsPredict fouling trends from operational data

A sudden increase in flue gas temperature without increased load usually signals that heat transfer surfaces need attention.

Summary

Cleaning soot and ash from heat transfer surfaces is one of the most effective and low-cost methods to reduce fuel consumption and restore boiler performance. These deposits act as insulation, preventing the efficient transfer of heat to the working fluid. Regular cleaning lowers stack temperatures, shortens burner run time, reduces emissions, and improves thermal efficiency—often by 5% to 15%. Whether manual, automated, or predictive, maintenance that targets fouling delivers rapid payback and sustained energy savings across all combustion-based systems.

What Role Do Economizers and Heat Recovery Systems Play in Cutting Energy Waste?

Every unit of heat lost up the stack is money wasted—and in industrial systems, that can mean millions of dollars annually. Boilers and thermal plants typically discharge flue gases at temperatures between 160°C and 300°C. Without any recovery, this energy exits unused. Economizers and heat recovery systems are designed to reclaim that lost heat and redirect it into the process, boosting overall system efficiency and dramatically reducing energy waste. These devices represent one of the most cost-effective strategies for improving fuel economy and sustainability in any thermal system.

Economizers and heat recovery systems reduce energy waste by capturing residual heat from flue gases or exhaust air and transferring it to incoming feedwater, combustion air, or process fluids. This reuse of energy lowers the required fuel input for steam or heat generation, improving overall efficiency by 5% to 20%. The result is reduced fuel costs, lower emissions, and extended equipment life. Economizers are especially impactful in high-temperature operations where flue gas heat would otherwise be lost.

In industries with thermal loads—power generation, food processing, chemicals, paper—heat recovery systems are a cornerstone of energy optimization and emissions control.

Economizers work by cooling the flue gas to below its dew point to recover energy.True

Condensing economizers cool the flue gas enough to recover both sensible and latent heat, increasing energy recovery efficiency.

🔁 What Is an Economizer?

An economizer is a heat exchanger that recovers waste heat from boiler flue gas and uses it to preheat:

  • Boiler feedwater

  • Combustion air

  • Process fluids in thermal systems

There are two main types:

TypeHeat Recovery MechanismEfficiency GainApplication
Non-CondensingRecovers sensible heat above dew point4–7%Natural gas, light oil boilers
CondensingRecovers sensible + latent heat by cooling below dew point10–15%Gas-fired systems with low return water temperature

Condensing systems are more efficient but require corrosion-resistant materials due to the acidic condensate formed from flue gas moisture.

📈 Energy Savings From Heat Recovery

Flue Gas Temp Before Economizer (°C)After Economizer (°C)Feedwater Temp Increase (°C)Fuel Savings (%)
220130+408–10
18095+5010–12
16085+6012–15
140 (condensing)55+7016–20

These savings depend on system load, burner design, and economizer size. For example, in a 10 MW boiler running 8,000 hours/year, improving efficiency by 8% could save $180,000–$240,000 annually in natural gas costs.

Economizers reduce the required fuel input by using waste heat to preheat boiler feedwater.True

By raising the temperature of feedwater before it enters the boiler, economizers reduce the energy required to generate steam.

🔧 Heat Recovery System Components

A heat recovery system may consist of:

ComponentFunction
Economizer coil/tubesTransfer heat from flue gas to water
Flue gas bypass damperAllows temperature control and protection during startup/shutdown
Condensate drainHandles acidic liquid in condensing economizers
Air preheaterTransfers flue gas heat to combustion air
Heat recovery steam generator (HRSG)Captures exhaust from turbines or engines to produce steam

These components are engineered to withstand high temperatures, pressure cycles, and corrosive environments. Stainless steel, inconel, and finned tubes are commonly used for durability and heat transfer efficiency.

📋 Additional Benefits Beyond Fuel Savings

BenefitExplanation
Reduced Flue Gas TemperatureLowers stack loss and environmental heat discharge
Lower EmissionsReduced CO₂, NOx, and particulate matter
Shorter Warm-Up TimesPreheated water or air speeds startup
Improved Steam QualityStable heat input results in better temperature control
Smaller Boiler SizingReduced fuel demand enables downsizing

For combined heat and power (CHP) systems, heat recovery increases total system efficiency from 35–40% (electricity only) to over 75–85% when thermal energy is captured.

🧪 Real-World Case Study: Food Processing Plant

A food processor installed a condensing economizer on a 15 MMBtu/hr boiler. Baseline flue gas temperature was 205°C, and return feedwater was 60°C. After installation:

  • Flue gas temperature dropped to 85°C

  • Feedwater temperature rose to 95°C

  • Annual gas savings: $210,000

  • Efficiency improvement: 13.2%

  • Payback period: 18 months

Maintenance was simplified by adding self-cleaning features and stainless steel construction to handle wet flue gases.

Air preheaters in heat recovery systems improve efficiency by pre-warming combustion air.True

Preheated combustion air supports better flame stability, faster ignition, and more complete combustion, reducing fuel use.

📊 Comparative Table: Heat Recovery Methods and Impact

System TypeRecovery TargetTypical Efficiency GainBest Use Case
Feedwater EconomizerFlue gas → feedwater5–10%Boilers with high feedwater volume
Condensing EconomizerFlue gas → feedwater + condensate10–15%Gas-fired low-temp return systems
Air PreheaterFlue gas → combustion air3–5%Oil/gas-fired high-capacity systems
HRSG (Steam Generator)Turbine exhaust → steam20–40%CHP and gas turbine systems

These methods are often combined for cumulative benefits, especially in large, multi-unit operations.

Summary

Economizers and heat recovery systems are essential tools for cutting energy waste in industrial combustion systems. By capturing heat that would otherwise escape through the exhaust stack, these systems preheat incoming water or air, significantly reducing the fuel required to generate heat or steam. The result is a measurable improvement in efficiency—often between 5% and 20%—with additional benefits in emissions, startup speed, and system lifespan. For any facility seeking cost-effective energy savings, heat recovery isn’t just an upgrade—it’s a necessity.

How Can Fuel Feeding Systems and Ash Handling Be Optimized for Smooth Operation?

In biomass and solid fuel combustion systems, two seemingly simple processes—feeding the fuel in and getting the ash out—can be the biggest sources of breakdowns, inefficiency, and operating headaches. When fuel isn’t fed evenly or ash removal is inconsistent, the boiler can’t maintain stable combustion. This leads to energy losses, high emissions, clogs, corrosion, and unplanned downtime. Optimizing these systems is essential not only for reliability but also for ensuring combustion efficiency, reducing maintenance costs, and increasing equipment lifespan.

Fuel feeding systems and ash handling processes can be optimized through proper design, automation, real-time monitoring, and preventive maintenance. Smooth fuel feeding ensures a consistent and controllable burn, which improves combustion stability and efficiency. Meanwhile, reliable ash removal prevents blockages, pressure buildup, and equipment wear. Using technologies like variable-speed feeders, level sensors, automated rotary valves, and continuous ash conveyors helps synchronize fuel input and waste output, ensuring seamless boiler operation.

For operators of biomass plants, solid fuel boilers, or waste-to-energy systems, mastering fuel delivery and ash disposal is a key to consistent performance and reduced operating costs.

Uneven biomass fuel feeding can cause fluctuations in flame stability and combustion temperature.True

Inconsistent feed rates lead to unstable combustion zones, resulting in incomplete combustion, emissions spikes, and thermal cycling.

🔄 Understanding Fuel Feeding Systems: Components and Functions

Fuel feeding systems are responsible for transporting solid fuels—wood chips, pellets, RDF, coal—from storage to the combustion chamber.

Key Components:

ComponentFunctionOptimization Tips
Fuel HoppersStore and buffer fuelUse anti-bridging devices to prevent blockages
Screw FeedersMeter and transport fuelApply variable speed control for flow adjustment
Rotary ValvesSeal combustion chamber and meter feedEnsure wear-resistant sealing surfaces
Fuel ConveyorsMove bulk material from silo to feederEnclose to minimize dust and moisture
Level SensorsMonitor hopper fuel levelsUse radar or ultrasonic for continuous accuracy

A well-designed feeding system ensures:

  • Constant fuel flow

  • Uniform particle distribution

  • Reduced air leakage into combustion chamber

  • Minimized mechanical wear

Inconsistent fuel feeding causes air-to-fuel ratio fluctuations, which disrupt combustion and reduce thermal efficiency.

📉 Fuel Feeding Problems and Their Consequences

ProblemCauseConsequence
Fuel BridgingHigh moisture or improper particle sizeInterrupts flow, flame instability
OverfeedingLack of feedback controlOverheating, emissions, unburned fuel
UnderfeedingMechanical blockages or misalignmentIncomplete combustion, low output
Dust LeakageWorn seals or open conveyorsDust accumulation, fire hazard

Fuel overfeeding improves combustion efficiency by providing more energy.False

Overfeeding leads to excess fuel in the chamber without enough oxygen, causing incomplete combustion and energy loss.

🔧 Optimizing Fuel Feeding: Practical Approaches

  1. Install Variable Speed Drives (VSDs): Match feed rate to boiler load in real time.

  2. Automate Based on Flue Gas Sensors: Adjust fuel flow in response to O₂ or CO levels.

  3. Use Dual Screw Feeders: Prevent bridging and ensure redundancy in case of failure.

  4. Control Fuel Moisture: Install inline moisture sensors or fuel dryers upstream.

  5. Regularly Calibrate Load Cells and Flowmeters: Ensure accurate mass flow control.

A paper mill that installed a sensor-based VSD-controlled screw feeder cut fuel consumption by 7% and reduced O₂ spikes by 45%, improving boiler stability.

🔥 Ash Handling Systems: Types and Challenges

Ash is the incombustible residue left after combustion. It must be efficiently collected and removed to prevent accumulation and equipment damage.

Ash Types:

TypeDescriptionSource
Bottom AshCoarse ash collected below the furnaceGrate or stoker-fired boilers
Fly AshFine particles carried in flue gasCyclone or baghouse captured
ClinkerHardened ash from high-temp fusionPoor-quality fuels or hot zones

Common Ash Handling Systems:

System TypeMethodSuitable For
Screw ConveyorsRotating blades move ash mechanicallyMedium to large boilers
Pneumatic SystemsUse air to transport fly ashHigh-volume, dry fly ash
Drag Chain ConveyorsSlow-moving chain drags ash forwardCoarse or sticky ash
Wet Ash HoppersQuenches and collects bottom ashBiomass and coal plants

Continuous ash removal systems reduce equipment wear compared to batch dumping.True

Continuous removal prevents buildup that can overheat and damage grates, tubes, and refractory linings.

⚙️ Ash Handling Optimization Techniques

Optimization PracticeBenefit
Automated Ash Level MonitoringPrevents overfilling and system blockage
Sealed Ash Discharge ValvesPrevents air ingress and pressure loss
Moisture-Controlled Ash QuenchingReduces dust and slag formation
Vibratory Ash ConveyorsReduces maintenance and handles varied particle sizes
Ash Cooling SystemsPrevents thermal damage to mechanical parts

🧪 Case Study: Biomass CHP Plant Optimization

A combined heat and power (CHP) plant burning wood chips experienced frequent grate blockages and flame instability. Investigations revealed:

  • Uneven fuel feeding due to bridging in the hopper

  • Ash build-up under grates from infrequent removal

  • Manual ash dumping led to hot spots and slag

Optimizations included:

  • Dual auger feeders with bridging breakers

  • Real-time moisture sensors for fuel drying control

  • Continuous drag-chain ash removal system

Results:

  • 13% increase in combustion stability

  • 9.5% reduction in unburned carbon

  • $62,000 annual savings on maintenance and fuel losses

Manual ash dumping provides more reliability than automated continuous ash systems.False

Manual dumping is labor-intensive, less consistent, and allows ash to accumulate, increasing risk of overheating and system inefficiencies.

📈 Optimization Tools and Monitoring Technologies

ToolFunctionRole in Optimization
SCADA IntegrationReal-time monitoring of feeds and ashEnables remote diagnostics and alerts
Load Cell Feed MonitoringMeasures live weight of fuel hopperPrevents bridging and overfeeding
Infrared Flame CamerasDetect combustion anomaliesLinks feeding rate to flame performance
Ash Sensor ProbesTrack buildup in real-timeAutomates ash removal scheduling
AI-Based Fuel Flow ControlAdjusts feeding dynamicallyLearns patterns to optimize feed/combustion

Summary

Efficient fuel feeding and ash handling are essential for the reliable and economical operation of biomass and solid fuel combustion systems. When these subsystems are optimized with the right technology and design, combustion becomes stable, fuel use drops, emissions are minimized, and system maintenance is reduced. Automated, sensor-driven, and intelligently controlled systems outperform manual or outdated approaches, delivering smooth operation and long-term cost savings. In any solid-fuel-based energy system, the path to peak efficiency begins at the hopper—and ends with clean, continuous ash removal.

How Does Automation and Performance Monitoring Reduce Downtime and Maintenance Costs?

In industrial thermal systems—whether in power plants, biomass boilers, or chemical processing—unscheduled downtime and reactive maintenance are costly and disruptive. Equipment failures not only interrupt production but also increase safety risks, shorten component lifespan, and waste energy. Traditionally, maintenance was scheduled by calendar or triggered only after a breakdown. Today, automation and real-time performance monitoring enable smarter maintenance by detecting issues early, minimizing failures, and optimizing system efficiency. These technologies transform boiler rooms from reactive to predictive operations, where downtime is rare and performance is maximized.

Automation and performance monitoring reduce downtime and maintenance costs by continuously analyzing key operating data to detect abnormalities before they cause failures. Automated systems adjust parameters in real time to maintain optimal efficiency, while condition-based monitoring identifies wear, fouling, and performance drift. This proactive approach reduces emergency repairs, extends equipment life, and enables predictive maintenance scheduling. Facilities using advanced monitoring systems report up to 50% reductions in unplanned downtime and 20–40% lower maintenance costs.

For any energy-intensive facility, integrating automation and monitoring tools isn’t just an upgrade—it’s a foundational strategy for cost control and operational reliability.

Automation helps reduce downtime by enabling early detection and real-time adjustments to system parameters.True

By analyzing sensor inputs, automated systems can detect deviations from optimal conditions and make corrections before failures occur.

🤖 Key Automation Technologies for Thermal Systems

TechnologyFunctionBenefit
PLC/SCADA SystemsReal-time control and data acquisitionEnables auto-adjustments and remote monitoring
Oxygen Trim SystemsAdjust air flow based on flue gas oxygen levelsMaintains combustion efficiency
VFDs (Variable Frequency Drives)Control motor speeds for fans, pumpsMatch output to load, reduce energy use
Burner Management Systems (BMS)Sequence startup, shutdown, and safety interlocksPrevent unsafe conditions and reduce manual errors
Control Valves with PositionersAdjust steam or fuel flow preciselyMaintains stable output and reduces strain

By automating these subsystems, plants reduce the likelihood of human error, improve consistency, and respond instantly to changing load conditions.

📊 Performance Monitoring: What Should Be Tracked?

ParameterWhat It IndicatesAction Triggered by Deviation
Flue Gas TemperatureHeat transfer efficiency, foulingClean heat surfaces or inspect exchangers
O₂ and CO LevelsCombustion qualityAdjust air-fuel ratio or tune burners
Steam Pressure/TemperatureProcess stabilityAdjust feedwater or firing rate
Fuel Flow RateFuel economy and system loadingTune feed systems or correct flow imbalance
Blower and Pump VibrationMechanical health of motors and bearingsSchedule maintenance before failure

Advanced monitoring platforms integrate these variables into a dashboard, allowing operators to visualize system health and efficiency in real time.

Manual-only performance monitoring reduces unnecessary maintenance costs compared to automated monitoring.False

Manual systems rely on periodic checks, which can miss emerging issues. Automated monitoring provides continuous visibility and early warnings.

🔧 From Reactive to Predictive Maintenance

Maintenance Strategy Comparison:

Strategy TypeTriggerProsCons
ReactiveFailure occursLow upfront costHigh repair cost, unscheduled downtime
PreventiveTime-based schedulesReduces major breakdownsCan lead to unnecessary maintenance
PredictiveBased on actual equipment conditionOptimized scheduling, lower costsRequires sensors and analytics setup

Predictive maintenance, enabled by automation and monitoring, uses real-time data to forecast when maintenance is needed. For example, detecting a gradual increase in pump vibration may indicate bearing wear—allowing repairs before failure.

A manufacturing facility using predictive analytics reduced unplanned downtime by 47% and maintenance costs by 28% within the first year.

🧪 Case Study: Power Boiler Optimization

A 100 MW power boiler in a paper mill struggled with:

  • Unexpected shutdowns (~3 times/month)

  • High stack temperatures (>250°C)

  • Frequent burner maintenance

Upgrades Included:

  • SCADA-based burner and airflow control

  • Real-time monitoring of O₂, CO, and temperature

  • Integration of AI model for predicting fouling buildup

Results:

  • Reduced shutdowns from 3/month to <1/quarter

  • Flue gas temp reduced by 60°C

  • Maintenance labor hours cut by 35%

  • Fuel consumption reduced by 6.2%

Boiler systems using real-time monitoring can detect fouling before efficiency is affected.True

Monitoring trends in flue gas temperature and pressure drop helps identify fouling early, enabling timely cleaning.

⚙️ Automation-Driven Efficiency Improvements

System FunctionManual Operation ResultAutomated Control Result
Combustion ControlFluctuating flame and air mixStable flame, low emissions
Feedwater Flow ManagementOver/under supplyReal-time matching to demand
Burner CyclingFrequent start-stopsLoad-based modulation
Soot BlowingOn fixed scheduleTriggered by actual fouling
Alarm ManagementDelayed responseInstant alerts and diagnostics

Automated systems adapt to process dynamics instantly, improving safety and minimizing process variability.

🧠 Emerging Technologies in Performance Monitoring

TechnologyRole in Maintenance Optimization
AI/ML Predictive ModelsLearn from operational data to predict faults and inefficiencies
Digital TwinsVirtual replica of boiler to test control strategies
Cloud AnalyticsCentralized, remote monitoring of multi-site operations
Infrared ThermographyDetects heat losses and insulation issues
Ultrasound and Vibration SensorsDetect mechanical wear and misalignment early

These innovations help shift from calendar-based inspections to data-driven decision-making, reducing unnecessary downtime and improving asset utilization.

Summary

Automation and performance monitoring are essential tools for modern thermal systems aiming to reduce downtime and control maintenance costs. By enabling real-time adjustments, early detection of wear or inefficiencies, and condition-based scheduling, these technologies transform maintenance from a reactive burden into a strategic advantage. With reduced breakdowns, optimized fuel use, and longer equipment lifespan, facilities equipped with advanced monitoring and control systems experience measurable gains in reliability, safety, and operational efficiency. In the competitive world of energy and process industries, automation isn’t optional—it’s the backbone of sustainable performance.

🔍 Conclusion

Lowering the operating costs of an industrial biomass boiler involves more than just using renewable fuel—it requires strategic control of combustion, heat transfer, fuel handling, and maintenance. By fine-tuning these systems, facilities can reduce fuel consumption, prevent performance losses, and extend equipment life. A well-optimized biomass boiler becomes not only a green investment but also a competitive, cost-saving asset.


📞 Contact Us

💡 Want to maximize the efficiency and ROI of your biomass boiler? Our team offers combustion tuning, fuel analysis, heat recovery integration, and maintenance support tailored to your biomass system.

🔹 Let’s help you run a cleaner, more cost-efficient biomass boiler system—built for performance and savings. 🌿🔥📉

FAQ

What are the best ways to optimize biomass boiler performance?

Key strategies include:

  • Using consistent, low-moisture biomass fuel

  • Optimizing air-to-fuel ratios for clean, complete combustion

  • Maintaining clean heat exchange surfaces

  • Using flue gas recirculation or oxygen trim controls

  • Monitoring real-time boiler data for performance tuning

How does fuel quality impact biomass boiler efficiency?

Moisture content, particle size, and calorific value all affect combustion. High-moisture fuels reduce flame temperature and increase flue gas losses, while inconsistent fuel size leads to incomplete burn and ash buildup. Aim for <20% moisture and uniform particle size.

What role does maintenance play in reducing operating costs?

  • Regular cleaning of ash, soot, and deposits from heat exchanger surfaces

  • Inspection and replacement of worn grates, sensors, and blowers

  • Checking for air leaks or insulation degradation
    Proper maintenance extends equipment life, improves heat transfer, and reduces fuel use.

How can combustion be controlled for better efficiency?

Install automated air-fuel controls like oxygen trim systems or variable-speed blowers. These dynamically adjust combustion air supply, ensuring optimal efficiency under varying loads and fuel conditions.

Can heat recovery systems lower biomass boiler fuel costs?

Yes. Installing an economizer to preheat feedwater or an air preheater to warm combustion air using exhaust gases can improve overall thermal efficiency by 5–10%, directly reducing biomass fuel demand.

References

  1. Biomass Boiler Performance Optimization Guidehttps://www.energy.gov

  2. Fuel Quality and Moisture Content Effectshttps://www.sciencedirect.com

  3. Industrial Biomass Boiler Maintenance Practiceshttps://www.researchgate.net

  4. Combustion Control in Biomass Systemshttps://www.epa.gov

  5. Using Oxygen Trim and FGR in Biomass Boilershttps://www.bioenergyconsult.com

  6. Boiler Heat Recovery and Economizer Systemshttps://www.mdpi.com

  7. Real-Time Boiler Monitoring Technologieshttps://www.automation.com

  8. Energy Efficiency in Biomass Heating Plantshttps://www.iea.org

  9. Industrial Boiler System Optimizationhttps://www.energysavingtrust.org.uk

  10. Thermal Efficiency Standards and Trendshttps://www.asme.org

Wade Zhang

CEO of Taishan Group Taian Boao International Trade Co., Ltd. 30 years experience in Global industrial boiler market,  Over 300 boiler projects experience, including 21+ EPC projects. Projects span 30+ countries & regions, involving industries such as nuclear power, energy & electricity, municipal heating, mining, textiles, tires etc.

How to Optimize Industrial Biomass Boiler Performance for Lower Operating Costs Read More »

Scroll to Top

Get Quick Support

Taishan Group
Make an appointment with us to meet at exhibition
Quick Contact