Waste heat recovery boilers sit at the intersection of two unforgiving realities: the upstream process never stops for them, and the heat source — whether it’s kiln exhaust, arc furnace off-gas, or reformer flue gas — doesn’t negotiate on temperature or flow rate. When fouling creeps up on a tube bundle undetected, or when a thermocouple drifts by 15°C and nobody notices for a week, the efficiency loss is quiet at first. Then it isn’t. Unplanned shutdowns in cement or steel applications routinely cost anywhere from $40,000 to well over $200,000 per incident depending on plant capacity and downstream buffer stock, and a significant portion of those incidents trace back to instrumentation gaps or maintenance programs that are still running on paper checklists and gut feel.
Digital monitoring systems improve waste heat recovery boiler reliability primarily through continuous IIoT-based sensor networks, predictive analytics, and AI-assisted thermal performance modeling. These tools can detect tube fouling and heat transfer degradation up to roughly 72 hours before conventional inspection cycles catch the same problem, cutting unplanned downtime by 15–30% and reducing overall maintenance costs by 20–35% depending on plant operating hours and baseline maintenance maturity.
What’s less obvious is how much variation exists in which tools actually deliver that return — and how badly mismatched digital systems can make things worse, not better. A pressure transmitter poorly located on a high-dust flue gas duct, or a machine-learning model trained on the wrong process analog, gives operators false confidence. The gap between a well-instrumented WHRB running a genuine predictive maintenance loop and one that just has a SCADA dashboard with colored dials is enormous, and it’s worth understanding exactly where that gap lives.
IIoT Sensor Networks and Real-Time Data Acquisition Architectures for WHRB
A waste heat recovery boiler is, by nature, a passive recipient of whatever the upstream process throws at it — variable flue gas flows, fluctuating temperatures, entrained particulates that change with raw material quality or furnace load. That variability is exactly why a static, schedule-based inspection regime fails so often on these units. The sensor network isn’t an add-on; it’s the foundation that makes everything else — predictive analytics, remote diagnostics, optimized cleaning cycles — actually work.
Critical Measurement Points Across the WHRB Thermal Circuit
Flue gas inlet temperature is the single most operationally consequential measurement on most WHRBs, and it gets instrumented more carelessly than almost any other point. In cement kiln or steel EAF applications, inlet gas can swing 80–150°C within minutes during process upsets. Type S thermocouples (platinum-rhodium) handle sustained temperatures above 1,000°C reliably, while Type K thermocouples are adequate for lower-temperature zones — typically the economizer outlet and flue gas exit, generally below 600°C. Infrared pyrometers work well where thermocouple insertion is physically awkward or where response speed matters, though dust loading in cement-plant flue gas can skew pyrometer readings badly if the optical path isn’t kept clean. That’s a maintenance habit that gets neglected more than it should.
Steam drum pressure and level transmitters need redundancy — two-out-of-three voting configurations are standard practice on any WHRB above roughly 25 t/h. Drum level in particular is safety-critical and also a key fouling indicator: unexplained feedwater demand increases often signal tube scaling well before thermal efficiency numbers degrade visibly.
Tube wall thermocouples, embedded or clamped on superheater and evaporator tubes, catch localized overheating that bulk flue gas temperature measurements completely miss. One tube running 40°C hotter than its neighbors is early warning of internal scaling or a flow distribution problem — caught early, it’s a cleaning job; missed for a few weeks, it can be a tube failure.
Exhaust gas O₂ and CO analyzers at the WHRB outlet close the loop on heat transfer performance. A rising exit O₂ alongside a falling steam output usually means flue gas bypassing — warped baffles or duct seal failures. CO excursions in units recovering heat from incomplete-combustion processes flag upstream burner issues before they damage the convective tube bundles.
IIoT Gateway Architecture and Data Transmission
Edge computing nodes — industrial-grade PLCs or dedicated IIoT gateways — collect raw sensor data at 1–10 second scan rates depending on the criticality of the measurement loop. Drum level and tube wall temperature warrant the faster end; feedwater flow totalization can tolerate slower polling. The edge node handles local alarming, basic trend calculation, and data buffering if the network connection to the plant historian drops.
OPC-UA has become the de facto standard for SCADA integration in new WHRB installations, partly because of its security model and partly because most DCS vendors support it natively now. MQTT is more common where data is being pushed to cloud-based analytics platforms or third-party asset performance management systems, since its lightweight publish-subscribe architecture handles intermittent connectivity better. Encrypted transmission matters — plant historians sitting on unsegmented networks are a real cybersecurity exposure that procurement managers rarely factor into digital upgrade budgets.
Surviving the Physical Environment
WHRB environments abuse sensors in ways that standard process instrumentation wasn’t designed for. Fly ash in cement and steel applications is abrasive and accumulates on sensor housings, thermowell tips, and analyzer sample probes at rates that can render a measurement unreliable within weeks if the installation isn’t properly designed. Hardened thermowell materials — high-chromium alloys or ceramic protection tubes — add cost upfront but last three to five times longer than standard stainless in high-ash flue gas streams.
Vibration from large induced-draft or forced-draft fans transmits through ductwork and can fatigue sensor wiring connections over 12–18 months. Armored, vibration-resistant cable and proper conduit routing aren’t glamorous, but they’re what separates a sensor network that actually works two years post-commissioning from one that’s generating nuisance alarms and half-dead channels.
Ambient temperature in the boiler house regularly exceeds 50°C in tropical plant locations or near hot duct surfaces, which pushes transmitter electronics toward their rated limits. Transmitters rated for 85°C ambient or higher are worth specifying even if they cost 20–30% more per unit.
Redundancy Strategy and Cost Benchmarks
For a mid-size WHRB in the 20–50 t/h steam capacity range, a fully instrumented IIoT sensor network — covering 40 to 80 measurement points with edge computing, local SCADA integration, and cloud historian connectivity — typically runs somewhere between $80,000 and 200,000$ installed, depending heavily on flue gas conditions, plant location, and whether cabling infrastructure already exists. That range is wide because a greenfield cement plant in a remote location with corrosive flue gas chemistry costs fundamentally more to instrument than a straightforward steel plant WHRB retrofit in an industrialized area.
Predictive maintenance programs integrating IIoT sensors on WHRBs typically reduce maintenance costs by 20–35% and extend tube bundle service life by 18–36 months compared to time-based maintenance schedules.True
These figures are consistent with published results from asset performance management deployments in heavy industry and align with operational data from cement and steel sector WHRB programs; the range reflects variation in flue gas conditions, baseline maintenance quality, and sensor coverage density.
Return on investment is usually driven by avoided unplanned outage cost rather than maintenance savings alone. A single unplanned WHRB outage on a cement line running at, say, 4,000–6,000 USD per hour in lost production can pay back a significant fraction of the sensor network cost in one event. Plants that have experienced even one unexpected tube failure tend to be much easier to convince on this point than those shopping purely on capital budget.
Redundant sensor configurations — dual transmitters on critical loops, with automatic switchover logic in the edge node — eliminate the single-point failure risk that undermines confidence in the data stream. During scheduled sensor calibration or replacement, the redundant channel maintains continuous data availability to the SCADA historian, which matters when the monitoring platform is also feeding maintenance planning decisions. In practice, most plants start with full redundancy on drum level and tube wall temperature, then extend it to other loops as operating experience highlights where measurement gaps actually hurt them.
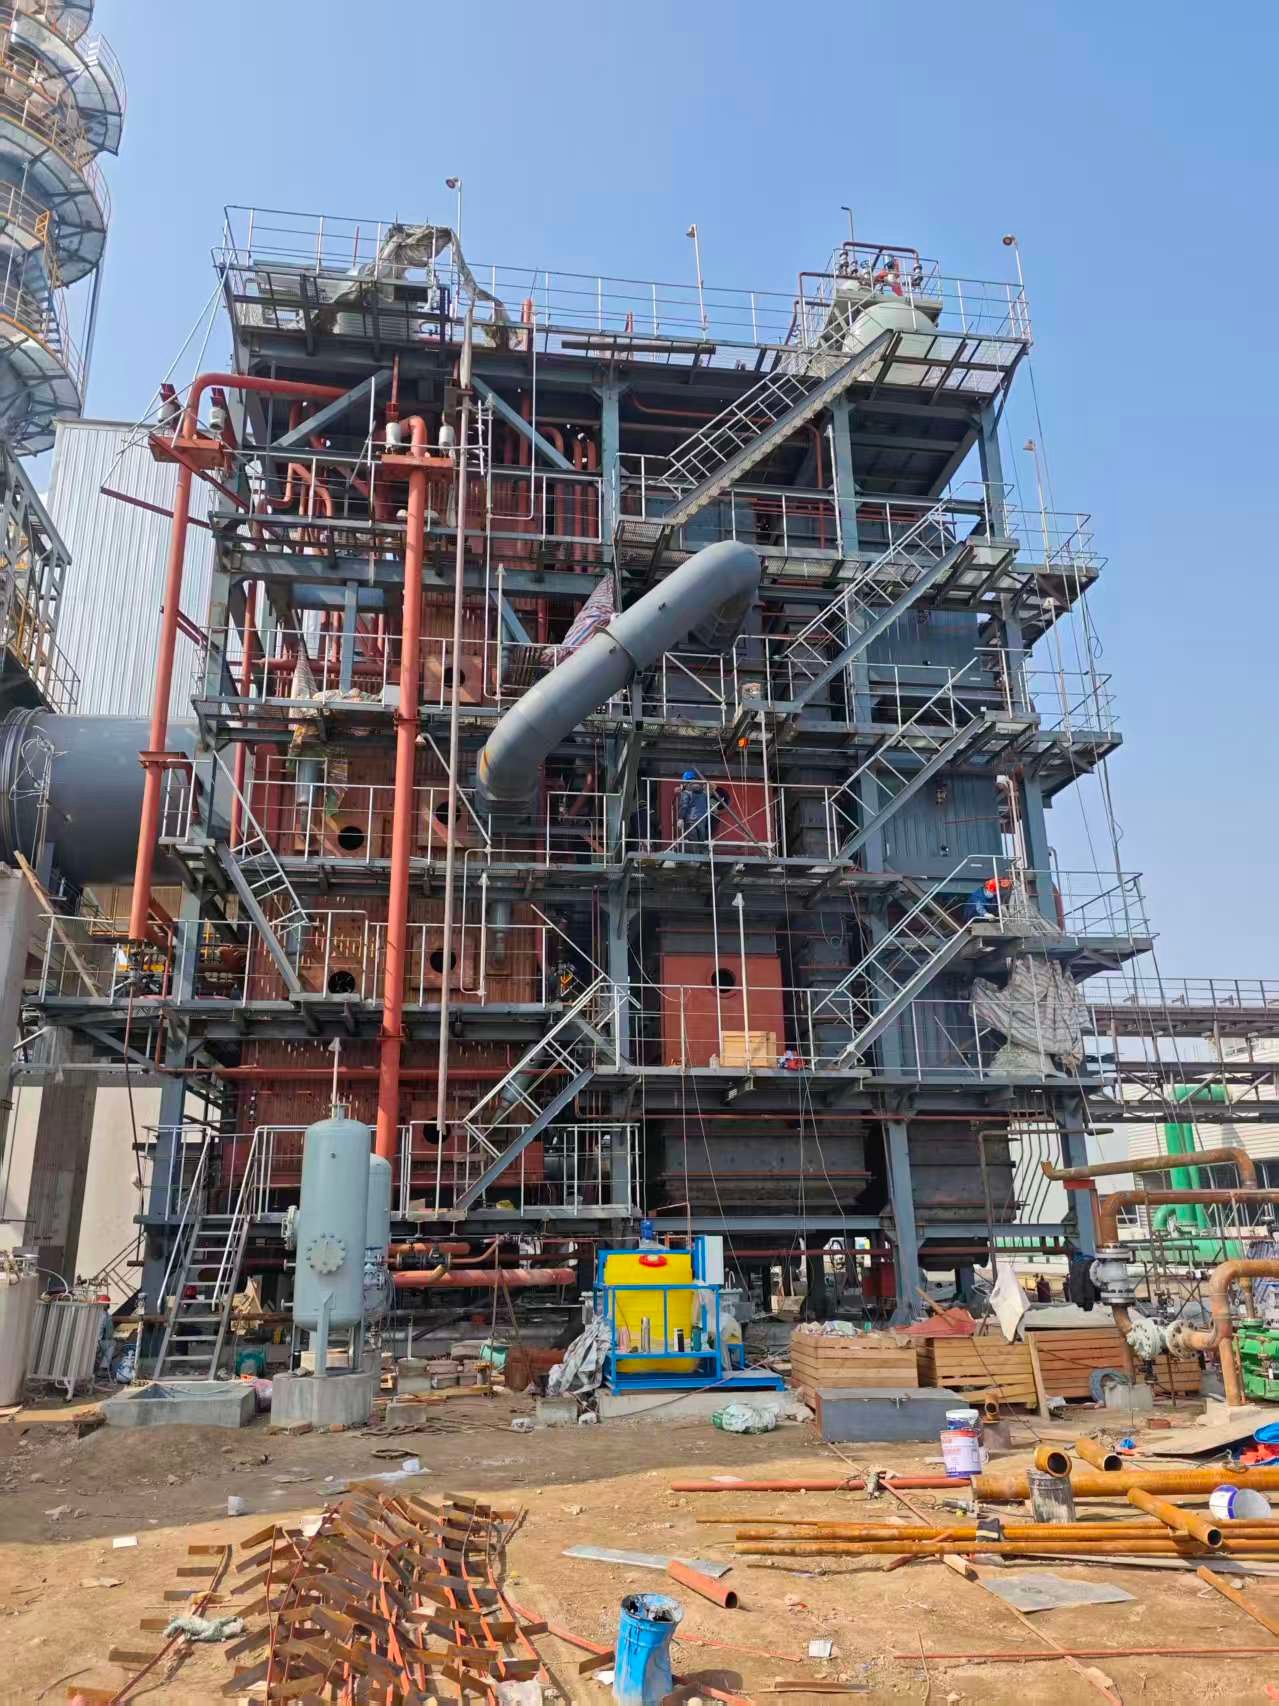
Continuous Flue Gas Composition Monitoring and Combustion-Side Diagnostics
Waste heat recovery boilers don’t generate their own combustion — they’re slaves to whatever the upstream process is doing. That’s what makes flue gas monitoring so different here compared to a fired boiler. You’re not controlling the flame; you’re reading the exhaust of someone else’s process and reacting fast enough to protect a pressure vessel that has no margin for thermal surprises.
CEMS Component Placement and Why Position Matters
A properly configured Continuous Emission Monitoring System for a WHRB isn’t a single instrument at the stack. You need measurement points at the flue gas inlet (immediately downstream of the process off-gas duct or kiln exit), at the economizer outlet, and at the final stack discharge. Each location tells you something different.
At the inlet, zirconia oxygen probes give you real-time excess O₂ readings — typically targeting somewhere between 2% and 6% O₂ depending on the upstream process, fuel type, and WHRB design spec. Non-dispersive infrared (NDIR) analyzers for CO and CO₂ sit alongside them. Extractive analyzers handle SO₂ and NOₓ, pulling a conditioned sample through heated lines to avoid condensation artifacts — a detail that gets skipped during low-budget commissioning and causes endless calibration headaches later. Particulate opacity monitors, usually transmissometer-based, round out the inlet measurement suite.
At the economizer outlet you want at minimum an O₂ probe and a dew point sensor. Stack instrumentation feeds the compliance reporting side.
Reading Upstream Process Health Through O₂ Trends
Excess oxygen drift is one of the earliest signals that something has changed upstream. In a cement kiln application, a steady 1–2 percentage point drop in inlet O₂ over a 4–6 hour window often indicates a fuel-to-air ratio shift or raw meal chemistry change — both of which reduce available heat input to the WHRB and destabilize steam generation. Operators who watch only steam pressure miss the upstream cause entirely and end up chasing symptoms.
Glass furnaces are particularly prone to oxygen excursions during batch charging. The WHRB sees those as heat input spikes and valleys that, left unmanaged, accelerate thermal fatigue in superheater and evaporator tube bends.
CO Spike Detection and Bypass Damper Logic
A CO spike at the WHRB inlet is a warning, not just a compliance event. Incomplete combustion in the upstream process — a kiln upset, a furnace burner malfunction, a gasification system stumble — sends a slug of chemically active, oxygen-deficient gas into the boiler. In extreme cases this gas can partially combust inside the WHRB gas passes, creating localized hot spots that exceed tube design temperatures by 80–150°C.
The correct response is fast: divert flue gas via bypass damper, notify the upstream process control team, and avoid loading cold feedwater into a suddenly overheated convective section. A CEMS-linked control logic block can trigger bypass damper positioning automatically within 30–90 seconds of a CO threshold breach — response times that manual operation simply can’t match.
Modern CEMS-linked control systems can detect CO breakthrough events and initiate bypass damper action in under 90 seconds, significantly faster than manual operator response.True
Fly Ash Loading and Sootblower Scheduling
Particulate concentration at the WHRB inlet correlates directly with convective tube fouling rate — roughly, higher fly ash loading means faster deposit buildup, higher tube wall temperatures, and degraded heat transfer coefficient. In cement WHRBs the inlet dust loading can range from 30 g/Nm³ to over 100 g/Nm³ depending on kiln type and whether a prededusting cyclone is installed.
Rather than running sootblowers on a fixed time cycle (a wasteful habit that also erodes tube surfaces unnecessarily), linking particulate opacity readings to sootblower activation logic lets you blow when fouling is actually accumulating. In practice, this approach can extend tube bundle service intervals meaningfully — the 18–36 month extension range cited in predictive maintenance programs is real, though the actual gain depends heavily on fly ash composition, gas temperature, and tube material selection.
Dew Point Monitoring in Sulfur-Bearing Flue Gases
Economizer cold-end corrosion is a slow killer. In flue gases containing SO₃ — common in sulfuric acid plant WHRBs and some sintering off-gases in steel plants — the acid dew point can sit anywhere between 120°C and 160°C depending on SO₃ concentration and moisture content. Running economizer outlet gas temperatures too close to that dew point to squeeze out efficiency is a common mistake that results in accelerated tube wastage and unplanned outages within 18–30 months.
Continuous dew point sensors (electrochemical or condensation-type) at the economizer outlet let operators and control systems maintain a meaningful margin — usually 15–25°C above the measured dew point — and catch seasonal or process-chemistry shifts before corrosion takes hold.
Compliance Integration Without Extra Burden
One practical benefit of a well-architected CEMS installation is that the same data stream feeding your process diagnostics also satisfies environmental reporting requirements. Whether the plant is permitted under US EPA 40 CFR Part 75, EU Industrial Emissions Directive standards, or a local environmental authority framework, a properly certified CEMS with data acquisition and handling system (DAHS) generates the quality-assured hourly averages, calibration records, and exception reports that regulators expect.
Overseas plants often underestimate the administrative cost of compliance without integrated CEMS — manual sampling, lab analysis, and report compilation can consume 2–5 engineer-days per reporting period. A connected CEMS cuts that to verification and exception review. It also protects the plant during audits: data gaps or instrument failures are documented automatically rather than discovered by an inspector.
Tube Wall Temperature Monitoring and Thermal Fatigue Early Warning Systems
Tube failures are, by a significant margin, the leading cause of unplanned shutdowns in waste heat recovery boilers serving cement kilns, electric arc furnaces, and non-ferrous smelting lines. Overheating, creep, and thermal fatigue don’t announce themselves — they accumulate quietly over months, then fail suddenly during a production peak when the flue gas temperature spikes and the tube wall that was already running 15°C above its safe baseline finally gives way. Any serious digital reliability program for a WHRB has to start here.
Why Tube Wall Temperature Is the Parameter That Matters Most
In a cement plant WHRB sitting on the preheater exit duct, flue gas temperatures can swing 80–120°C within a single shift depending on kiln feed rate and raw material moisture. Those swings translate directly into cyclic thermal stress on superheater and evaporator tubes. Over time — typically somewhere between 18,000 and 35,000 operating hours depending on steel grade, design pressure, and how aggressively the upstream process runs — that accumulated creep damage crosses a threshold and tube life drops off fast. A single tube rupture forces an emergency shutdown. At a cement plant running 3,000–4,500 tonnes per day clinker output, even a 36-hour forced outage carries a real cost, and that’s before you account for the refractory damage that often follows a tube leak in a hot enclosure.
Embedded Thermocouple Arrays at High-Heat-Flux Zones
The practical solution is to instrument the tube surface directly. Mineral-insulated thermocouples — typically Type K or Type N, depending on the temperature range — are resistance-welded or silver-brazed to tube outer walls at the zones that consistently run hardest: the first two to three rows of the superheater bundle (highest gas temperature exposure), the evaporator tube bends where flow disruption concentrates both thermal and mechanical stress, and any location where the flue gas flow path creates a known impingement pattern. Spacing varies, but in my experience a well-designed array on a medium-sized WHRB (say, 20–50 t/h steam capacity) will have somewhere between 40 and 120 measurement points, not evenly distributed — denser near the gas inlet and at bends, sparser in lower-risk zones. The wiring routing matters enormously on the maintenance side; poor conduit runs in high-vibration environments will give you failed sensors within a year.
Fixed Infrared Thermography for Accessible Sections
Embedded thermocouples cover what you can instrument at fabrication. Fixed IR cameras — mounted at purpose-built inspection ports on the boiler casing, typically with sapphire or germanium windows rated for the ambient temperature around the port — cover a different failure mode: localized hot spots from ash bridging between tube rows or internal scale buildup that disrupts internal flow and drives up the outer wall temperature. A fixed camera continuously scanning a 40–60° field of view through a single port can flag a developing hot spot well before it reaches the alarm threshold. The detection window, in practice, is roughly 24–72 hours ahead of when a conventional weekly manual inspection would catch the same defect.
Fixed IR thermography systems on WHRB superheater sections can detect tube hot spots indicative of internal scale or external ash bridging 24–72 hours earlier than scheduled manual inspection cycles.True
This range is consistent with documented heat transfer degradation rates in industrial WHRB applications and the typical 5–7 day manual inspection interval used in cement and metallurgical plants. The exact detection lead time depends on fouling rate, gas temperature, and camera resolution.
Multi-Zone Thermal Mapping and Deviation Tracking
Individual temperature readings are less useful than a digital thermal map of the entire heat transfer surface updated in near-real-time. Modern WHRB monitoring platforms — whether running on a plant DCS or a dedicated edge computing module — aggregate the thermocouple array data and IR scan data into a zone-by-zone deviation map referenced against the commissioning baseline. Fouling doesn’t usually cause a single dramatic temperature spike; it causes a slow, creeping rise across a zone, maybe 2–4°C per week. Tracking that trend against baseline is what separates a predictive system from a simple high-temperature alarm.
Graduated Alarm Logic and Interlock Sequences
The alarm architecture matters. A single high-temperature trip threshold is operationally crude — it gives operators no warning before a hard shutdown. A graduated structure works better in practice:
| Alert Level | Threshold (% of design max tube wall temp) | Recommended Action |
|---|---|---|
| Advisory | 85% | Initiate sootblowing cycle; increase monitoring frequency |
| Warning | 90% | Reduce upstream process load by 10–15%; engineering review within 4 hours |
| Critical | 95% | Controlled load shedding; prepare for scheduled short shutdown |
| Trip | 100% | Automatic interlock: controlled shutdown sequence initiated |
The controlled shutdown sequence matters as much as the trip logic. A WHRB tripped hard from full load thermal-shocks tube bends and headers — that damage compounds the existing fatigue. Ramp-down over 20–40 minutes where process allows is meaningfully better for tube life than an instantaneous trip.
Remaining Life Assessment Integration
Where this gets genuinely useful for maintenance planning is when tube wall temperature history feeds a creep damage accumulation model. Using the time-temperature exposure data logged by the thermocouple array, and applying Larson-Miller parameter methods consistent with ASME Code Case approaches, the software can produce a remaining life estimate — not a precise number, but a credible range — for each monitored tube section. In practice this means a maintenance engineer can schedule a targeted tube replacement during a planned turnaround rather than discovering the problem during an emergency. Tube replacement costs during a planned outage are typically 40–60% lower than the same work done under emergency conditions, simply because the scaffolding, materials, and welding crew can be organized in advance. That number varies with plant location and contractor availability, but the directional logic holds everywhere.
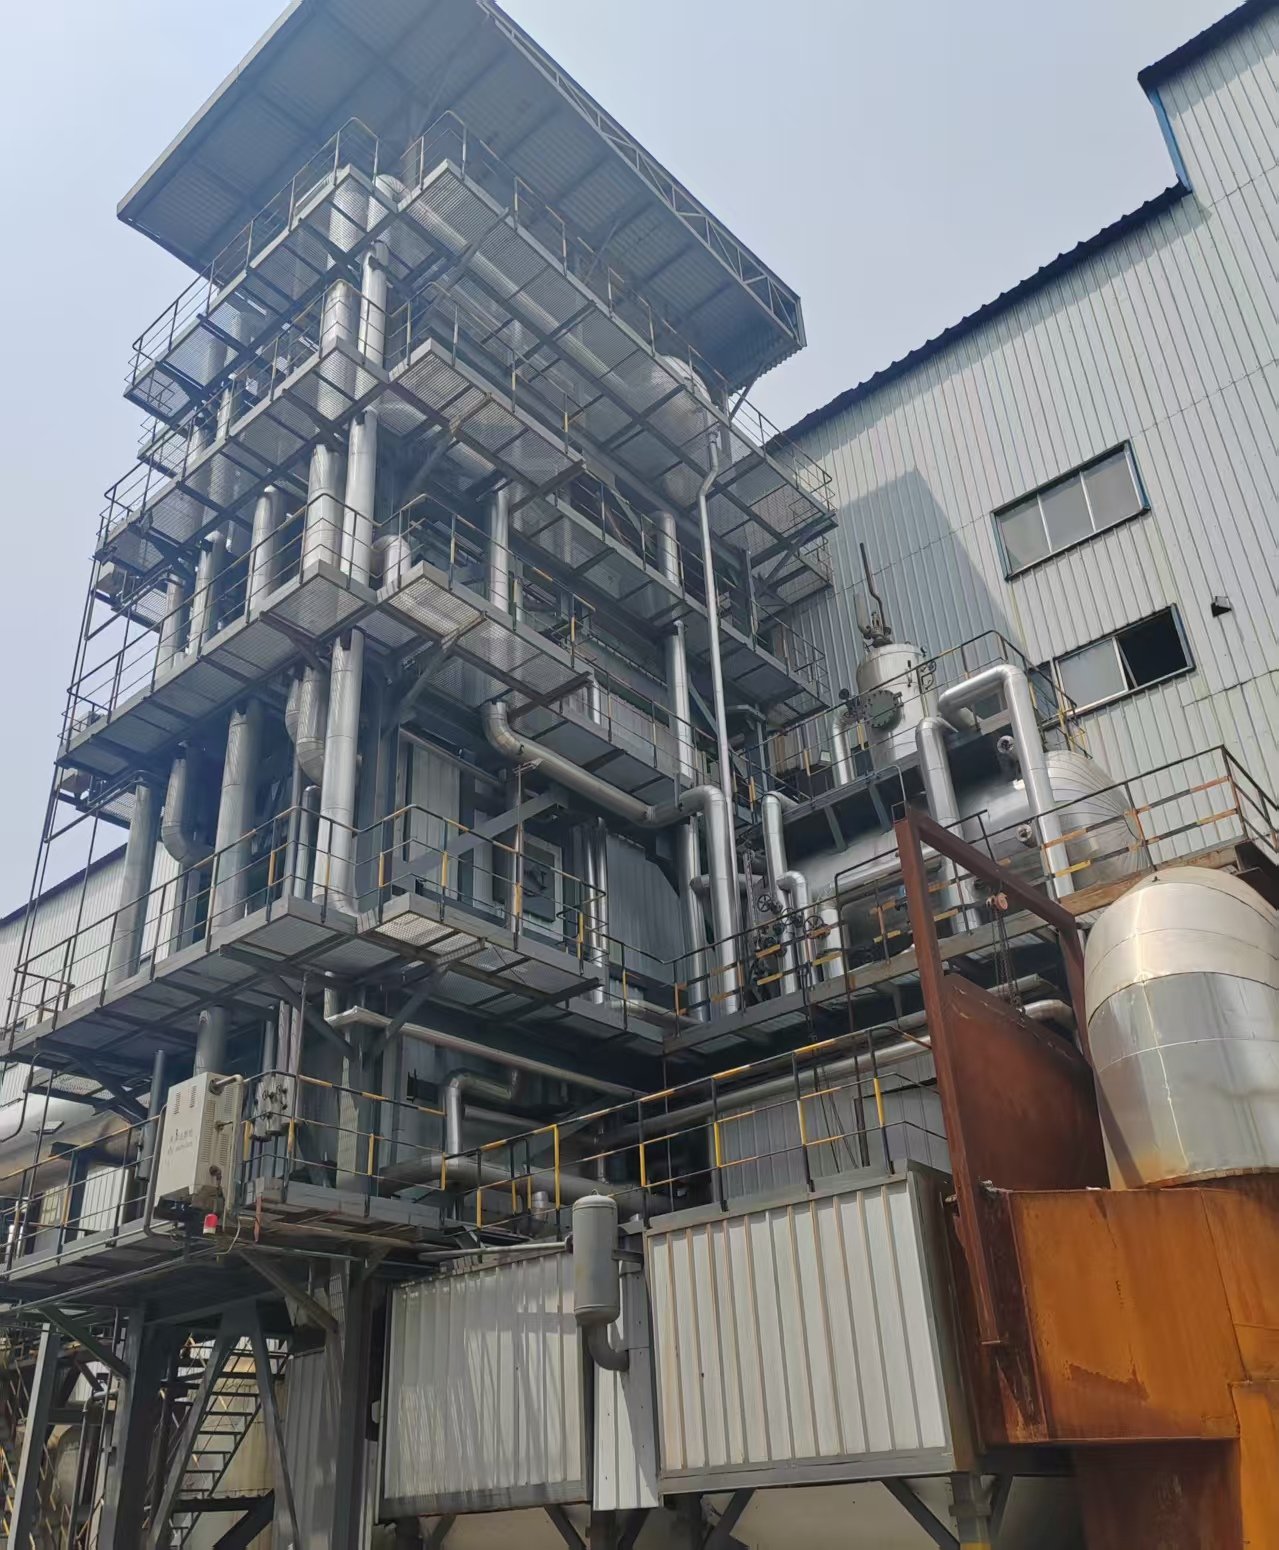
AI-Driven Predictive Maintenance Platforms and Digital Twin Applications for WHRB
Raw sensor data is only useful if something intelligent sits behind it. That’s the gap where predictive maintenance platforms and digital twin models do their real work — converting a stream of thermocouple readings, flow signals, and flue gas analyzer outputs into ranked, actionable forecasts that a maintenance planner can actually schedule against.
What a WHRB Digital Twin Actually Does
A digital twin for a waste heat recovery boiler isn’t a dashboard or a 3D visualization. It’s a physics-based computational model — heat transfer equations, fluid dynamic correlations, tube stress calculations — that runs continuously in parallel with the real unit, fed by live plant data. The model knows the geometry of your evaporator and economizer tube bundles, the design fouling resistance factors, the drum hydraulics, and the expected metal temperature profiles at each load condition. When real measurements start diverging from what the physics model predicts, that delta is the early warning signal.
In a cement kiln WHRB, for example, where the raw gas inlet temperature can swing 80–120 °C depending on kiln feed rate and fuel mix, a static alarm threshold for, say, economizer outlet temperature would generate constant nuisance trips. The digital twin accounts for those upstream swings and adjusts its predictions dynamically — so when the outlet temperature is 12 °C higher than the model expects at that specific inlet condition and gas flow rate, you know it’s fouling and not just a kiln load change.
Digital twin models calibrated with real plant operating data can detect tube fouling and thermal degradation 48–72 hours earlier than conventional manual inspection cycles.True
Physics-based WHRB models tracking heat transfer coefficient degradation against predicted baselines identify fouling onset through incremental resistance increase before it becomes visible to periodic inspection or threshold alarms. This detection lead time depends on sensor density, model calibration quality, and rate of fouling accumulation.
Machine Learning on Top of the Physics Model
The digital twin sets the physical baseline. Machine learning layers handle the messier patterns that physics alone doesn’t capture cleanly. Algorithms trained on 12–24 months of historical operating logs learn what “normal” degradation looks like for that specific unit — gradual fouling resistance creep that builds over 3–6 weeks, slow drum level oscillation drift that indicates a control valve starting to stick, or a feedwater pump that’s been losing 2–3% head over several months because the impeller wear rings are going. None of these trigger rule-based alarms until the problem is serious. An ML model tuned on that plant’s own history flags the trend early enough to plan the intervention during a scheduled outage rather than scrambling during an emergency.
Practically, this requires decent historical data quality. If your DCS historian has significant gaps or your transmitters weren’t calibrated consistently, the first 6–9 months of a predictive maintenance program is partly about data cleaning and sensor validation before the models become reliable. That’s not a vendor problem; it’s a plant data hygiene problem. Budget for it.
Specific Predictive Maintenance Use Cases That Actually Pay Back
Sootblower nozzle wear is one of the first places plants see hard ROI. Nozzle orifice erosion is gradual and rarely inspected until blowing performance drops noticeably. A predictive model tracking differential pressure across the sootblower circuit alongside heat transfer coefficient trends can estimate remaining nozzle life within roughly ±15–20%, good enough to order replacement hardware before it’s urgent without stockpiling excessive spares.
Economizer finned tube fouling scheduling is another. Traditional practice in cement or steel plants is fixed-interval offline cleaning — every planned outage, whether the tubes need it or not. Flue gas temperature differential trending across the economizer, combined with the digital twin’s predicted clean-surface performance, lets you push that cleaning interval when fouling is accumulating slowly (maybe the coal ash chemistry changed) and pull it forward when it’s building fast. In practice, plants running this approach see cleaning intervals vary by 30–60% from the old fixed schedule — sometimes shorter, sometimes longer — while maintaining heat transfer performance.
Drum level control valve maintenance cycles are subtler but worth tracking. Slow changes in valve positioner response, hysteresis creep, or trim wear show up in drum level signal noise characteristics before level control actually degrades. Catching that 6–8 weeks out means a planned valve overhaul, not an emergency replacement during a production run.
Anomaly Detection in Variable-Load Environments
Cement and steel plants are inherently variable. A WHRB sitting behind a rotary kiln doesn’t see stable inlet conditions for more than a few hours at a time. Any anomaly detection model that doesn’t account for upstream process dynamics will spend half its time generating false positives — and operators will start ignoring the alerts, which defeats the entire point.
Good platforms build dynamic baselines: the model learns the relationship between kiln throughput, raw mix moisture, fuel type, and expected WHRB performance, then flags deviations from that expected state, not from a fixed design-point. This distinction is the difference between a system that earns operator trust within 6 months and one that gets switched to “monitor only” and quietly ignored.
Platform Integration and DCS Compatibility
Most industrial plants running WHRB units already have a DCS in place — Emerson DeltaV, Honeywell Experion, and Siemens PCS 7 cover the majority of cement and steel installations at this scale. Predictive maintenance platforms need to integrate without requiring a separate operator interface that nobody checks. The platforms that work in practice are those that push recommendations into existing operator workflows — alarm management screens, shift handover reports, or CMMS work order triggers — rather than requiring operators to log into a separate analytics portal.
Integration depth varies. Some platforms pull historian data via OPC-UA and run analytics off-platform. Others have DCS-native modules that embed directly into the control system. The off-platform approach is easier to deploy and safer from a cybersecurity standpoint; the embedded approach gives lower latency but requires DCS vendor cooperation and sometimes licensing headaches.
A Realistic Scenario: Cement Plant WHRB Fouling Optimization
Consider a 35 t/h WHRB behind a 5,000 t/d cement kiln. Sootblowing had been running on a fixed 4-hour cycle, consuming auxiliary steam regardless of actual heat exchanger condition. After deploying an AI-based fouling prediction model — tracking flue gas temperature differential across the boiler sections and correlating with kiln feed rate and raw mix parameters — the plant shifted to condition-based sootblowing. During periods of low-sulfur fuel and stable kiln operation, blowing intervals extended to 6–7 hours. During high-alkali clinker production runs, the model correctly flagged accelerated fouling and shortened intervals proactively. Net result: auxiliary steam consumption for sootblowing dropped roughly 12% over a 6-month period, with heat transfer performance maintained within 1.5% of design. The payback on the software platform, in that case, was under 14 months — though that figure depends heavily on steam value, which varies significantly by plant energy configuration.
Predictive maintenance programs integrating IIoT sensors with this kind of analytics layer typically reduce maintenance costs by 20–35% and extend tube bundle service life by 18–36 months compared to time-based schedules, though both figures depend on baseline maintenance practices, feedwater quality, and how aggressively the plant acts on the system’s recommendations. A platform that generates good predictions but whose maintenance team overrides or ignores them delivers none of the benefit.
Automated Sootblowing Control Systems and Intelligent Cleaning Optimization
Sootblowing is one of those WHRB maintenance functions that looks deceptively simple on paper but causes a disproportionate share of reliability headaches in practice. The fundamental tension is straightforward: leave ash deposits on tube bundles too long, and fouling resistance climbs, flue gas outlet temperature rises, and steam generation drops. Clean too aggressively or too frequently, and the high-velocity steam jet from the sootblower lance erodes tube surfaces — particularly at superheater and reheater sections where tube wall thickness tolerances are already tight. Neither extreme is acceptable over a multi-year equipment life.
Why Time-Based Sootblowing Schedules Fail in WHRB Service
Conventional practice in many plants is to run sootblower sequences on a fixed timer — every four hours, every shift change, whatever the original commissioning engineer wrote into the PLC. That logic made reasonable sense for utility boilers with stable coal combustion loads, but it’s poorly matched to WHRB operation.
The core problem is that upstream process load varies continuously. In a cement kiln waste heat recovery system, flue gas temperature, flow rate, and dust loading all swing with kiln feed rate, raw material moisture, and bypass damper position. In a steel electric arc furnace application, the heat release pattern is cyclic and highly non-uniform. A sootblowing schedule calibrated for average conditions will chronically over-clean during low-load periods — causing unnecessary tube erosion and steam consumption — while under-cleaning during high-dust-loading phases when fouling accumulates fastest.
Experienced WHRB operators know this. The usual workaround is to let operators adjust the sootblowing interval manually based on observation of flue gas outlet temperature trends. That works tolerably in a well-staffed plant with attentive operators. It works poorly on night shifts, during operator turnover, or when attention is divided across a large plant.
Condition-Based Trigger Logic: Heat Transfer Coefficient as the Control Variable
Intelligent sootblowing control systems replace the timer with a physics-based trigger. The control logic continuously calculates a real-time heat transfer coefficient for each tube bundle zone, derived from temperature measurements at the flue gas inlet and outlet of that zone combined with steam-side flow and enthalpy data. When the calculated heat transfer coefficient drops below a defined threshold — indicating that fouling resistance has increased beyond an acceptable level — the system triggers sootblowing for that zone only.
Condition-based sootblowing control can improve WHRB overall thermal efficiency by 2–4 percentage points compared to fixed-interval sootblowing, depending on flue gas dust loading variability and the number of independently controlled sootblower zones.True
This range is consistent with published industry data from cement and steel WHRB applications where fouling loads are variable. Plants with stable, low-dust flue gas streams will see smaller gains; high-dust applications like cement kilns or glass furnaces typically realize the upper end of this range.
The threshold values are not generic — they need to be set based on the specific fuel and process chemistry, the tube bundle geometry, and the acceptable steam generation loss the plant is willing to tolerate. In practice, initial commissioning of an intelligent sootblowing system involves several weeks of baseline data collection to establish what “clean” heat transfer coefficient looks like for that specific boiler, then setting fouling threshold alarms at roughly 10–15% degradation from baseline, give or take depending on the operator’s risk tolerance and the tube material specification.
Zone-Selective Sequencing: Stop Cleaning What Isn’t Dirty
Traditional full-sequential sootblowing runs every lance in the system in a fixed order, regardless of which zones actually need attention. In a WHRB with twelve to twenty sootblower rows serving separate economizer, evaporator, and superheater bundles, running all of them when only the economizer section is fouled wastes steam and puts unnecessary mechanical wear on equipment that didn’t need to be touched.
Zone-selective control uses the thermal mapping data from the temperature sensor network — already installed for tube wall monitoring — to identify exactly which tube bundle rows have accumulated fouling above threshold. Only those zones are activated. A superheater section running clean gets skipped entirely. This matters more than it might seem: steam consumption per full sootblowing cycle in a mid-sized WHRB typically runs somewhere in the range of 0.8–2.5% of total steam output depending on boiler size and sootblower count, so eliminating unnecessary cycles has a measurable impact on net steam availability and plant energy balance.
Tube erosion reduction is the less obvious benefit. Superheater tubes — typically operating at the highest metal temperatures and most sensitive to wall thinning — accumulate a significant share of erosion damage from unnecessary sootblowing passes. Industry data from cement and steel WHRB applications suggests that moving from full-sequential time-based to zone-selective condition-based control reduces tube erosion incidents at superheater and reheater sections by roughly 20–30%, though that figure depends heavily on sootblower nozzle condition and steam pressure.
Sootblower Mechanical Condition Monitoring
The control system is only as effective as the sootblowers themselves, and worn or malfunctioning sootblowers are a genuine operational hazard. A sootblower with a worn nozzle delivers less impact at a wider spray angle, which means it erodes adjacent tubes it wasn’t aimed at while cleaning the target tubes ineffectively. A seized rotation mechanism means the lance sits stationary while steam blasts a concentrated line along one row of tubes — a scenario that can cut through tube walls in surprisingly short order.
Intelligent sootblowing platforms monitor several mechanical parameters per cycle: steam consumption (measured by a dedicated flow element or calculated from header pressure drop), nozzle rotation speed via encoder feedback, and lance travel time from home position to end of travel and back. Deviations from established baseline values trigger maintenance alerts before they become failures. A sootblower that starts consuming 15–20% more steam per cycle than its baseline typically has a partially blocked nozzle or a valve seat problem. One that takes 8% longer to complete a lance travel cycle is probably developing a rack-and-pinion wear issue or a guide rail alignment problem.
Catching these early — before the next scheduled mechanical inspection — is exactly where the integration between the sootblowing control system and the broader CMMS pays off. The control system logs every cycle with timestamp, steam consumption, rotation speed, and travel time. Trend analysis over weeks or months gives the maintenance planner a defensible picture of which sootblowers are degrading and should be inspected at the next planned outage rather than run to failure.
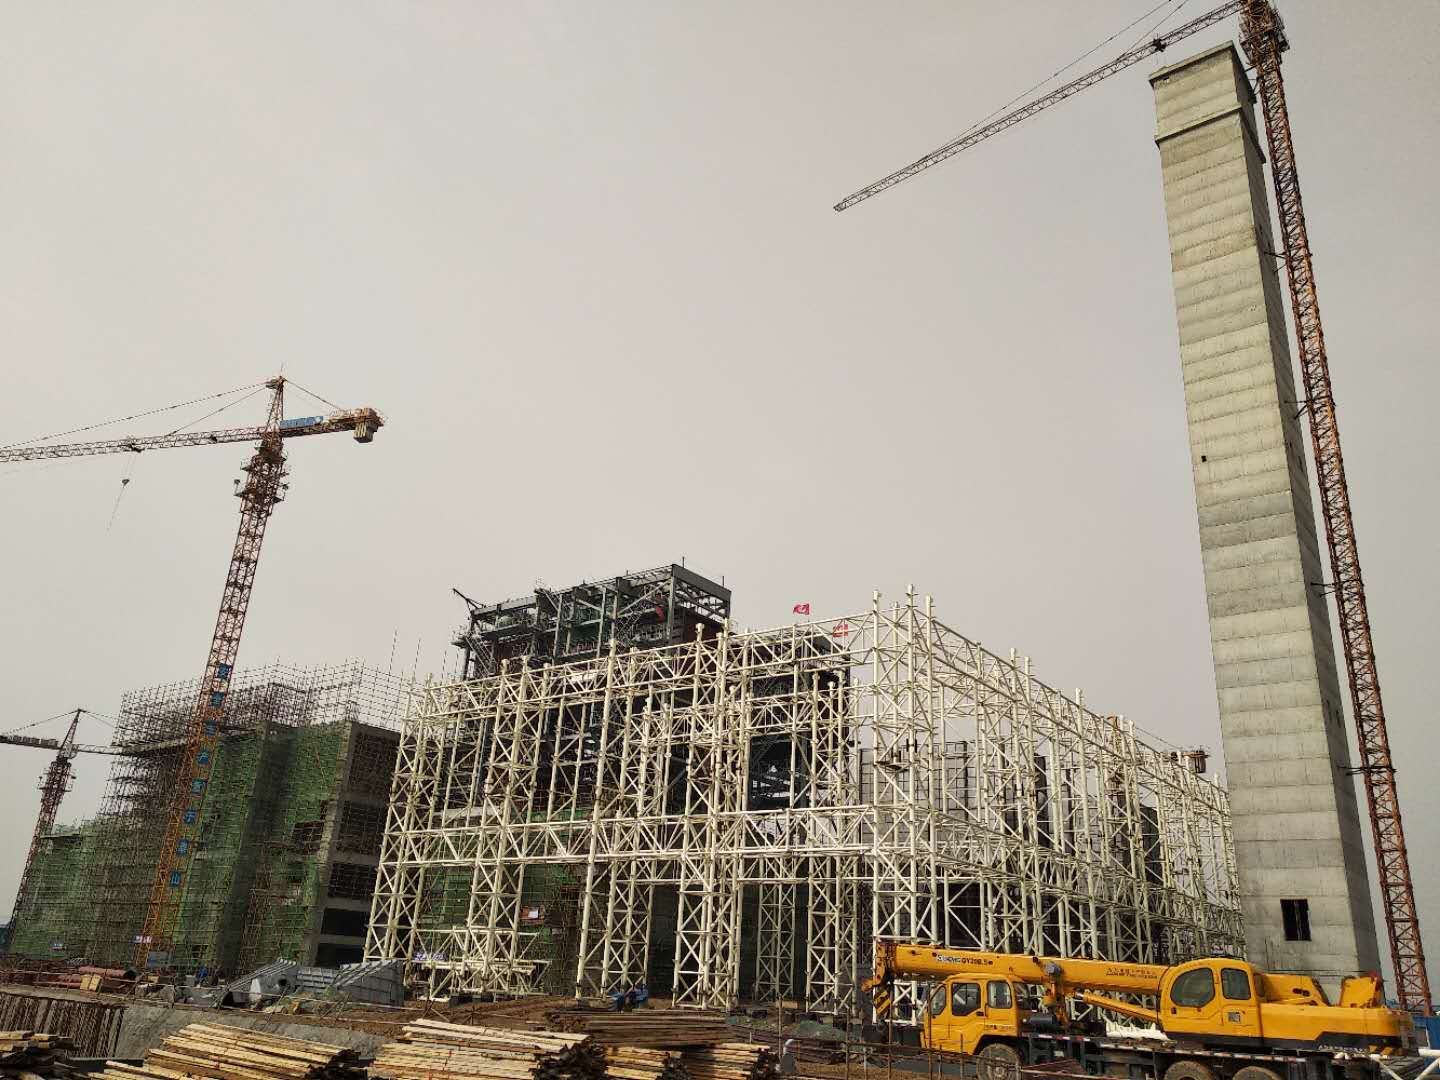
Steam Drum Level Control and Feedwater System Digital Monitoring for Safe WHRB Operation
Of all the failure modes that can take a waste heat recovery boiler out of service — and potentially injure personnel — steam drum level excursions are the fastest-acting. Low drum water level exposes tube headers and generating tubes to dry-fire conditions. Depending on flue gas temperature and tube wall thickness, you can see measurable oxidation and creep damage within minutes, and catastrophic rupture within 15–30 minutes in severe cases. High drum level is less dramatic but equally damaging downstream: water carryover into the steam header sends wet, droplet-laden steam into turbine blades or process heat exchangers, causing erosion and thermal shock that often shows up as warranty disputes six months later when no one remembers the level alarm that tripped during a shift change.
Three-Element Drum Level Control Under Fluctuating Process Conditions
Single-element control — just drum level — works acceptably on a fired boiler with a relatively stable heat input. WHRBs don’t have that luxury. In a cement kiln application, clinker throughput swings, kiln combustion upsets, and bypass damper operations can shift flue gas enthalpy by 15–25% within a few minutes. A single-element controller reacts too slowly; by the time the drum level signal responds, the feedwater valve has already over- or under-shot.
Three-element control addresses this by adding steam flow measurement and feedwater flow measurement as feed-forward signals. The controller sees a load change — rising steam demand — and begins adjusting feedwater flow before the drum level has shifted. In steel plant WHRB applications where converter gas recovery cycles create periodic heat pulses every 25–35 minutes, three-element control tuned correctly can hold drum level within ±20–30 mm of setpoint versus ±80–100 mm with single-element control. The tuning still requires some plant-specific commissioning; the default PID parameters from the vendor almost never survive first contact with real process variability.
Redundant Level Measurement and Safety Interlock Architecture
For any WHRB operating above roughly 2.5 MPa, relying on a single level transmitter is a maintenance liability. The standard approach is three independent measurement technologies running in parallel: differential pressure (DP) transmitters corrected for drum pressure and temperature (the density compensation step that junior engineers sometimes skip, causing level errors of 40–80 mm at elevated pressures), guided wave radar sensors that are largely immune to foam and density variation, and magnetic float-type level gauges as the local visual reference and independent safety shutdown input.
The safety interlock — typically a hardwired SIS relay independent of the DCS — should trip feedwater pump starting and trigger an emergency shutdown at low-low level based on at least two of three sensors confirming the condition. Voting logic (2-of-3) prevents a single failed transmitter from causing a spurious trip or, worse, masking a genuine low-level event.
Online Water Quality Monitoring and What It Actually Catches
Continuous conductivity measurement is the workhorse of drum water monitoring. A sharp conductivity rise — say, from a baseline of 200–400 µS/cm jumping above 800–1000 µS/cm — signals either a condenser tube leak in a combined cycle setup, a makeup water treatment failure, or inadequate blowdown. Left unaddressed, elevated TDS accelerates silica carryover risk, which deposits on turbine blades as glassy scale that is genuinely difficult to remove without acid washing.
Silica analyzers on the steam drum sample line are worth the capital cost on any WHRB feeding a steam turbine. The threshold that triggers a blowdown increase or load reduction is typically 0.02–0.1 mg/L depending on steam pressure and turbine manufacturer limits. Dissolved oxygen sensors on the feedwater line protect tube internals from pitting corrosion; target values are usually below 7–10 µg/L, achieved by deaeration and chemical scavenging working together. pH transmitters round out the chemistry picture, keeping drum water in the 9.0–10.5 range depending on the treatment program.
Automated blowdown control using real-time conductivity data reduces blowdown heat losses by 20–40% compared to fixed time-interval blowdown schedules.True
Fixed-interval blowdown is sized for worst-case water quality, so it over-blows during periods of good feedwater quality. Conductivity-driven control blows down only as much as chemistry requires, recovering heat that would otherwise leave through the blowdown cooler or flash vessel. The 20–40% range depends heavily on feedwater TDS variability and the baseline blowdown rate.
Feedwater Pump Condition Monitoring — The Component That Gets Overlooked
The feedwater pump sits between the WHRB and everything that keeps it safe, yet it’s the component most often excluded from vibration monitoring programs because “it’s just a pump.” In practice, bearing failures on boiler feedwater pumps are one of the more common causes of unplanned WHRB shutdowns — usually on night shifts, usually after months of subtle vibration increases that nobody trended.
Vibration sensors on the pump bearing housings, connected to the plant SCADA with velocity and acceleration trending, give you 3–8 weeks of warning before most bearing failures reach a critical threshold. Motor current signature analysis adds a complementary layer: impeller wear and partial blockage both produce characteristic harmonic patterns in the motor current spectrum that aren’t visible in vibration data alone. Seal leakage flow monitoring — even just a simple flow switch on the seal flush return — catches mechanical seal degradation before it becomes a puddle on the floor and a safety report.
Integrating all of this into one SCADA alarm page, with pre-set alert thresholds and trend displays rather than raw time-series dumps, is what separates a system operators actually use from one that generates alarm floods they learn to ignore.
Remote Monitoring Centers, Cloud Dashboards, and EPC Integration for Multi-Site WHRB Fleets
Operating a single waste heat recovery boiler is demanding enough. Running a fleet of them — across three cement plants in two countries, say, or a steel group with six production lines — multiplies the exposure to unplanned outages and makes consistent performance management genuinely difficult without a centralized data layer.
Architecture of a Centralized Remote Monitoring Center
The basic structure is straightforward in concept, messier in practice. Each plant site runs its own DCS or SCADA layer, which aggregates local sensor data — flue gas temperatures, tube wall readings, drum levels, steam flow, feedwater conductivity — and pushes timestamped records to a cloud historian via encrypted site gateways. Polling intervals typically run 1–5 seconds for safety-critical parameters and 30–60 seconds for slower process variables, though this depends on available bandwidth and historian licensing costs. On the receiving end, a centralized monitoring center consolidates data from all sites into standardized KPI dashboards.
What those dashboards actually need to show matters more than the technology stack behind them. Availability factor, thermal efficiency trend (not a snapshot — a rolling 7-day average smoothed against production schedule), steam output per ton of flue gas processed, and maintenance backlog aging are the four metrics that tell an operations manager whether a unit is quietly degrading or genuinely healthy. Most off-the-shelf SCADA visualization tools can render these; the hard part is getting consistent tag naming and engineering unit conventions across sites that were commissioned years apart, possibly by different EPC contractors.
Remote Expert Support Without On-Site Presence
This is where remote monitoring pays back most clearly for overseas operations. A senior boiler engineer sitting in a monitoring center can pull up 72-hour trend charts for a unit running night shift in a plant thousands of kilometers away, spot a slow upward drift in economizer outlet temperature that suggests ash fouling onset, and send an operating instruction before the next shift change. No flights, no delays waiting for a local specialist who may not exist nearby.
In practice, this works best when the remote engineer has already been on-site — knows the unit’s quirks, understands which sensors historically drift, knows that the plant typically sees higher inlet dust loadings during certain raw material campaigns. Remote monitoring augments experienced judgment; it doesn’t replace it.
Cybersecurity: Not Optional, Not Simple
Industrial remote access carries real risk, and WHRB systems connected to cloud platforms need proper segmentation. The control network — SCADA, DCS, field instruments — must sit on a separate network segment from enterprise IT, linked to the outside world only through a dedicated industrial DMZ with a properly configured data diode or firewall. Remote access sessions should run over encrypted VPN tunnels with multi-factor authentication, not open RDP connections. Role-based access controls matter: a maintenance technician checking pump vibration trends should not have write access to control setpoints.
IEC 62443 compliance provides a recognized framework for cybersecurity risk management in industrial control systems including WHRB remote monitoring architectures.True
IEC 62443 is the internationally recognized standard series for industrial automation and control system cybersecurity, widely referenced by EPC contractors and plant operators for defining security levels in OT network designs.
Compliance with IEC 62443 security levels — at minimum SL-2 for process-critical WHRB systems — gives EPC clients and their insurers a documented basis for the security architecture. Audits hurt, but a ransomware event that locks a plant’s DCS hurts considerably more.
Mobile Interfaces for Field Engineers
Plant maintenance engineers rarely sit at a workstation during field rounds. A practical mobile application gives them push alerts for abnormal parameters — an unexpected spike in tube wall temperature or a drum level deviation — with enough trend context to decide whether it needs immediate attention or can wait for the next inspection window. Scanning a QR code affixed to a valve body or heat exchanger module to pull up its full maintenance history, last inspection result, and open work orders is genuinely useful; it cuts the time spent chasing paper records and reduces the chance that a known issue gets overlooked during a handover between shifts.
Embedding Digital Monitoring in EPC Contracts
This is where many EPC projects fall short. Digital monitoring specifications get added late, negotiated down, or left vague — and the client ends up with a boiler that runs but generates no useful operational data. Embedding specific requirements in the EPC contract scope changes this: standardized instrumentation packages with defined tag lists, historian data retention periods (typically 2–5 years), remote commissioning support provisions allowing the WHRB vendor’s engineers to assist loop checks and startup verification without traveling, and clear performance guarantee verification methodology using plant historian data rather than short-duration acceptance tests.
Taishan Group structures its WHRB EPC project delivery to include standardized instrumentation and DCS integration engineering as part of the turnkey scope, with post-commissioning remote support agreements that give overseas clients access to technical review for a defined period after handover. For plant owners operating in regions where qualified boiler engineers are scarce, that remote support capability is often as valuable as the hardware itself.
Selecting and Specifying Digital Monitoring Systems During WHRB Procurement: A Practical Engineering Checklist
Most procurement teams treat instrumentation as a line item to negotiate down. That’s the wrong instinct entirely. By the time a WHRB lands on your plant floor, the monitoring architecture is effectively locked in — retrofitting a proper IIoT sensor layer onto an already-installed unit costs two to four times what it would have cost to specify it correctly at tender stage, and you’ll still end up with compromises on sensor placement and cable routing.
Minimum Instrumentation Requirements to Demand in the Technical Specification
Your technical specification should explicitly list mandatory measurement points rather than accepting vague references to “standard instrumentation.” For a typical industrial WHRB serving a cement, steel, or chemical plant, the baseline includes flue gas temperature at furnace inlet and stack outlet, tube wall thermocouples on the high-heat-flux zones (not just one zone — at least three measurement planes across the tube bundle), drum pressure and level with redundant transmitters, feedwater flow and conductivity, and flue gas O₂ and CO at the economizer outlet.
Redundancy matters here. Safety-critical signals — drum level, in particular — should be triple-redundant with independent sensing elements and separate cable paths. A single-transmitter drum level loop on a high-pressure WHRB is not an acceptable specification regardless of what a low-bid supplier proposes.
DCS interface protocols should be specified explicitly: HART 7 or Foundation Fieldbus for smart transmitters is standard; Modbus TCP or OPC-UA for gateway communications to plant SCADA. Specify that the data historian must retain process data at one-second resolution for at least 24 months — shorter retention periods make it nearly impossible to build meaningful fouling trend models after the fact. Alarm management should conform to ISA-18.2; alarm flooding during process upsets is a chronic problem on poorly configured WHRBs and it causes operators to silence alarms rather than act on them.
Evaluating What Suppliers Actually Deliver
When reviewing supplier proposals, ask for the sensor datasheet — not just the brand name. Thermocouple assemblies rated for 900°C continuous service in a sulfur-bearing flue gas environment are a different product from standard industrial thermocouples, and some suppliers substitute the latter. Check the IP rating and the SIL certification on safety-function transmitters. A transmitter rated IP54 installed in a location that sees condensate drip during winter operation will fail within 18 months.
Ask specifically whether the supplier’s IIoT and predictive maintenance modules are pre-engineered for their own WHRB product line or whether they’re proposing a generic third-party platform with a loose integration. Pre-engineered modules — where fouling detection algorithms are already calibrated to expected flue gas compositions and velocity profiles for that boiler geometry — deliver value much faster than a generic platform that still requires 12–18 months of baseline data collection before it can flag anomalies reliably.
Request references for at least two similar monitoring system deployments, with contact details. Verified operational track record of the digital system, not just the pressure parts, should carry real weight in your technical scoring.
Integration Compatibility: Questions Worth Asking Before Contract Signing
Confirm which DCS platforms the monitoring system supports natively — Siemens PCS 7, Honeywell Experion, ABB 800xA, Yokogawa CENTUM are common in heavy industry, but not all supplier gateway solutions handle all of them cleanly. Ask for the data export format for plant historian integration (OSIsoft PI remains the most common in process industry; confirm CSV and OPC-UA export as fallbacks). If your organization plans to run a third-party predictive maintenance platform — some plants do, particularly EPC contractors managing multi-site fleets — confirm that the WHRB supplier’s system exposes a documented REST API rather than a proprietary locked interface.
Pre-engineered IIoT predictive maintenance modules, calibrated to a specific WHRB design, typically reduce the time to actionable fouling detection baselines from 12–18 months (generic platform) to roughly 3–6 months after commissioning.True
Boiler-specific algorithm calibration leverages known design parameters — heat transfer areas, expected flue gas mass flow ranges, design fouling resistance values — reducing the statistical learning period needed before anomaly thresholds become meaningful.
Commissioning and Acceptance Testing
Don’t accept a monitoring system handover based on a visual loop check. The acceptance test protocol should include instrument loop checks with simulated signals across the full engineering range (not just mid-scale), alarm setpoint verification against the approved cause-and-effect matrix, a 72-hour continuous DCS communication integrity test with logged packet loss statistics, and a documented performance baseline — thermal efficiency, tube wall temperature profiles, drum level stability — established during the first steady-state operating period. That baseline is what makes every future trend meaningful.
Spare Parts and Long-Term Support
Lead times on specialty sensors — high-temperature thermocouple assemblies, flue gas analyzers with heated sample lines — can run 8–16 weeks from some suppliers, longer if they source components from a single manufacturer. Your procurement contract should commit the supplier to maintaining a minimum local or regional spare parts buffer for critical sensor assemblies for at least 10 years. Software support commitments should include cybersecurity patch timelines (no longer than 90 days from vulnerability disclosure to patch availability is a reasonable standard) and guaranteed remote technical support response within four hours for alarm-priority issues.
Weighting Digital Monitoring in Supplier Technical Scoring
In practice, most WHRB tender evaluation matrices weight process design and pressure part quality at 40–50% combined, with instrumentation and controls often sitting at 10% or below. That weighting undervalues the monitoring system’s contribution to long-term reliability. A reasonable rebalancing puts digital monitoring capability — sensor specification depth, DCS integration engineering, IIoT readiness, and support track record — at 20–25% of the technical score, on par with pressure part material certification. The boiler that runs two years without an unplanned outage delivers more value than the one with slightly better pressure vessel steel and a basic relay-based control panel.
Frequently Asked Questions About Digital Monitoring for Waste Heat Recovery Boilers
What is the minimum viable digital monitoring package for a small WHRB below 10 t/h steam capacity?
For a unit in that size range, you don’t need a full DCS with 400 I/O points. The defensible baseline is: drum level (redundant transmitters — never single-point on a small boiler), steam pressure, flue gas temperature at both the inlet and the evaporator outlet, and oxygen content at the stack. That five-parameter package catches the failure modes that actually take small WHRBs offline — low water events, inlet temperature spikes from process upsets upstream, and slow fouling drift visible as a widening inlet-to-outlet ΔT.
If the plant later wants to move toward predictive maintenance, the upgrade path is straightforward: add tube skin thermocouples at the first two tube rows (highest thermal load), a feedwater conductivity probe, and a data historian. That second phase typically costs 30–60% of the initial instrumentation budget, depending on panel integration complexity, and it’s what opens the door to cloud-based trending.
How long does it take to retrofit a full IIoT and predictive maintenance system on an existing WHRB without a major shutdown?
Realistically, you split the work into two phases. Flue gas sensors, stack O₂ analyzers, and most external temperature transmitters can be installed during normal operation — maybe 5–8 working days of field work, plant running the whole time. The sensors that genuinely require a planned outage are tube skin thermocouples in the high-temperature gas path, any in-drum instrumentation changes, and sootblowing control upgrades if the lances need replacement or repositioning. A focused planned outage of 3–7 days handles that scope comfortably in most WHRB configurations I’ve seen, assuming the instrumentation drawings are complete before the wrench goes on the first fitting.
Don’t underestimate the data historian and SCADA integration time. That’s frequently longer than the physical installation.
Can WHRB monitoring systems integrate with ERP platforms like SAP PM for automated work order generation?
Yes, and it’s not exotic anymore. The standard approach uses OPC-UA from the DCS or monitoring platform to a middleware layer, which then pushes condition-triggered alerts to SAP Plant Maintenance via REST API. When a tube bank ΔT alarm persists for, say, four consecutive hours above threshold, the system creates a PM work order automatically with the relevant tag data attached. The configuration work is real — figure on 3–6 weeks of integration engineering for a clean implementation — but the operational payoff is that maintenance planners stop receiving phone calls and start receiving structured, prioritized work orders.
What is the typical payback period for a comprehensive digital monitoring and predictive maintenance investment?
The honest answer is 18–36 months for a mid-size industrial WHRB, and the range is wide because it depends heavily on how often the unit was experiencing unplanned outages before. A plant that was losing 4–6 days per year to tube failures and emergency cleaning can recover the instrumentation investment faster than one that was already running relatively clean. The calculation framework: avoided unplanned downtime revenue loss (your process hourly margin times lost production hours), maintenance labor savings from condition-based versus time-based intervals (typically 20–35% reduction), and thermal efficiency improvement value. Even a 2–3 percentage point efficiency gain on a unit processing 80,000–120,000 Nm³/h of flue gas is not trivial.
Predictive maintenance programs integrating IIoT sensors on waste heat recovery boilers typically reduce maintenance costs by 20–35% and extend tube bundle service life by 18–36 months compared to time-based maintenance schedules.True
This range is consistent with published results from cement and steel plant WHRB applications and reflects the shift from calendar-based to condition-based intervention intervals, which eliminates both premature replacement and run-to-failure scenarios.
How do monitoring requirements differ between natural circulation and forced circulation WHRB designs?
Forced circulation units need one monitoring capability natural circulation designs don’t: pump health. Vibration sensors on circulation pump bearings, flow confirmation via differential pressure across the pump, and motor current trending are all necessary — a pump failure on a forced circulation WHRB during high-load operation leads to tube overheating within minutes, not hours. Natural circulation WHRBs, by contrast, are more sensitive to flow instability in the tube bundles themselves, particularly at low load or during process transients. Differential pressure monitoring across individual tube passes catches the early signs of partial blockage or steam blanketing that can precede a localized overheating event.
Does Taishan Group provide digital monitoring systems and remote support as part of WHRB EPC delivery for overseas clients?
Standard project scope includes full instrumentation and control design, DCS integration (typically Siemens or Honeywell platforms, though client-specified systems are accommodated), and pre-shipment factory acceptance testing of the monitoring package. For overseas EPC projects, remote commissioning support is available when site access for resident engineers is constrained — this has become fairly routine. Post-handover, Taishan offers remote monitoring service agreements that provide access to boiler performance dashboards and alarm response support, with escalation to engineering teams for anomalies that warrant design-level review. Clients operating multiple WHRB units across different plants can consolidate data into a single fleet-level dashboard, which procurement managers and operations directors have found practical for comparing unit performance across sites without sending people on planes.
References
References
HRSG Remote Monitoring & Diagnostics — Anomaly Detection and Early Leak Detection — GE Vernova
Monitoring & Diagnostic Services — HRSG Tube Leak Detection and Remote Diagnostics — GE Vernova
800xA Condition Monitoring — Predictive Maintenance and Asset Health Monitoring — ABB
Digital Solutions in the Power Industry — Real-Time Monitoring and Predictive Maintenance — ABB
Power Performance Calculations — Real-Time Power Plant Performance Monitoring — Yokogawa
TOMONI — Remote Monitoring and Advanced Analytics for Power Plants — Mitsubishi Power
DIASYS Netmation — Power Plant Control and Monitoring System — Mitsubishi Power
Predictive Maintenance Based on Condition Monitoring — Siemens
Predictive Digital Twin Technology — Preventing Energy and Chemical Plant Downtime — Siemens
Power Plant and Fleet Optimization — Asset Management and Predictive Maintenance — ABB