Industry News

Top 5 Key Factors Affecting Industrial Gas Boiler Efficiency

Top 5 Key Factors Affecting Industrial Gas Boiler Efficiency

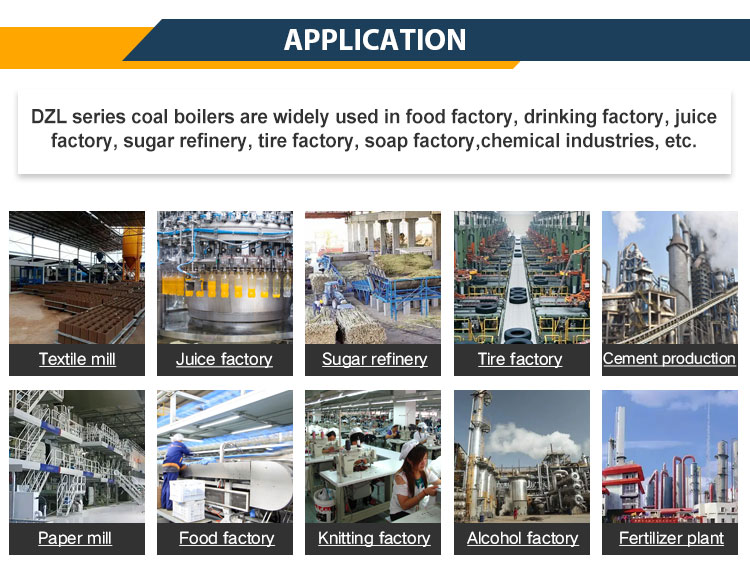
For factories and processing plants, boiler efficiency directly determines fuel consumption, operational cost, and carbon emissions. Even small inefficiencies can lead to thousands of dollars in energy waste annually. Understanding what influences gas boiler performance is essential for maximizing output while minimizing operating expenses.

The efficiency of an industrial gas boiler depends on five major factors: combustion quality, heat transfer performance, flue gas temperature, excess air ratio, and maintenance condition. Proper burner tuning ensures complete combustion, efficient heat exchangers improve thermal transfer, reduced flue gas losses increase efficiency, optimized air-fuel ratios minimize energy waste, and regular maintenance prevents scaling or soot buildup that can lower performance.

By managing these five areas, plants can maintain consistently high efficiency, stable operation, and reduced fuel costs.

How Does Combustion Quality Influence Gas Boiler Efficiency?

In industrial and commercial energy systems, combustion quality lies at the very heart of gas boiler performance. Many operators overlook it, assuming efficiency losses are caused by mechanical wear or outdated design, while the real culprit often hides in improper air-to-fuel ratios, unstable flame behavior, or poor burner maintenance. When combustion quality deteriorates—even slightly—the consequences are immediate and costly: increased fuel consumption, excessive emissions, uneven heat distribution, and shortened equipment lifespan. The solution is mastering combustion optimization through precise control, monitoring, and maintenance—ensuring every cubic meter of gas delivers maximum usable heat with minimal waste.

Combustion quality directly determines gas boiler efficiency because it governs how completely the fuel is converted into heat. Proper combustion achieves an optimal air-to-fuel ratio, stable flame temperature, and complete oxidation of hydrocarbons, leading to higher thermal efficiency and lower emissions. Poor combustion, by contrast, results in unburned fuel, elevated carbon monoxide (CO) levels, excess oxygen losses, and heat energy wasted in flue gases. Typically, improving combustion quality can enhance boiler efficiency by 3–8%, translating to substantial fuel savings and extended equipment life.

This fundamental relationship between combustion control and efficiency makes it one of the most critical operational parameters in gas-fired boiler management. The sections below explain how combustion quality affects thermal performance, what parameters define “good combustion,” and which technologies ensure optimal results.

Combustion quality has little effect on gas boiler efficiency since gas burns cleanly by nature.False

Even with clean fuels like natural gas, improper air-fuel ratios and poor burner tuning can reduce boiler efficiency by 5–10%.


Excess air always improves combustion efficiency.False

Too much excess air cools the flame, increases flue gas losses, and reduces thermal efficiency. Optimal excess air is necessary, not excessive.


Understanding the Fundamentals of Combustion Quality

Combustion quality in gas boilers is defined by how effectively chemical energy in the fuel is transformed into usable heat energy. This transformation depends on three essential elements: fuel quality, air supply, and mixing and flame stability.

Combustion ParameterOptimal RangeImpact on EfficiencyDescription
Air-to-Fuel Ratio (λ)1.05–1.15+5–8%Slight excess ensures complete combustion without cooling losses
Flue Gas Oxygen (O₂)2–4%+3–5%Indicates proper air supply and fuel utilization
Carbon Monoxide (CO)<100 ppm+2–4%High CO signals incomplete combustion
Flame Temperature900–1200°C+5–7%Directly correlates with combustion completeness
Flue Gas Temperature<180°C (condensing) / <230°C (non-condensing)+3–8%Lower exit gas temperatures imply better heat recovery

High combustion quality ensures nearly total oxidation of methane (CH₄) into CO₂ and H₂O. Any deviation—either excess air (too lean) or insufficient air (too rich)—reduces efficiency. Lean mixtures waste energy by heating unused nitrogen and oxygen, while rich mixtures leave unburned fuel and increase CO emissions.


The Air-to-Fuel Balance: The Core Efficiency Variable

The air-to-fuel ratio is the most influential factor in determining boiler combustion efficiency. Natural gas combustion ideally requires around 10 parts of air per part of fuel (stoichiometric ratio). However, in real-world operation, a slight excess air margin (5–15%) is necessary to ensure full oxidation.

Air-to-Fuel ConditionO₂ Level in Flue Gas (%)CO Level (ppm)Efficiency ImpactTypical Flame Appearance
Insufficient Air (Rich)0–1300–2000↓ 5–10%Yellow, unstable flame
Optimal Air Supply2–4<100↑ MaximumBlue, steady flame
Excessive Air (Lean)>6<50↓ 3–7%Weak, elongated flame

Poor tuning can increase flue gas temperature by 30–50°C, equivalent to a 2–4% drop in thermal efficiency, and can also accelerate corrosion from moisture condensation inside the flue system.


Quantitative Example: Efficiency Impact of Air Imbalance

ConditionFlue Gas Temp (°C)O₂ (%)Boiler Efficiency (%)Efficiency Loss (%)
Optimal180392.5
Excess Air (10% high)210589.5-3.0
Excess Air (20% high)230687.2-5.3
Insufficient Air (Rich Burn)190190.0-2.5

In practical terms, a 1% increase in flue gas O₂ content typically results in a 0.6–1.0% decrease in boiler efficiency, highlighting how sensitive gas boilers are to combustion tuning.


The Role of Burner Design and Flame Stability

Burner performance is the foundation of high-quality combustion. Modern premix and modulating burners achieve uniform air-fuel mixing and stable flame propagation, minimizing CO formation and enhancing heat transfer. Key design attributes include:

  • Swirl stabilization for consistent flame shape

  • Variable frequency drive (VFD) blowers for adaptive air control

  • Electronic modulating valves for dynamic fuel adjustment

  • Flame ionization sensors for real-time flame verification

Burner TypeEfficiency Range (%)Control MethodEmission Level (NOx ppm)
Conventional Atmospheric85–88Fixed air60–120
Modulating Premix90–94Electronic ratio control30–60
Condensing Premix94–98Fully modulating + heat recovery<30

Thus, advanced combustion systems can save up to 8–10% fuel annually, particularly in variable load applications where part-load efficiency often drops sharply in older systems.


Combustion Monitoring and Optimization Technologies

Modern boiler management systems employ real-time combustion analytics to maintain efficiency and reduce human error. Techniques include:

  • O₂ Trim Controls: Adjust combustion air automatically to maintain target excess air levels.

  • CO Sensors: Detect incomplete combustion, preventing fuel wastage and hazardous buildup.

  • Flue Gas Analyzers: Monitor temperature and gas composition continuously for efficiency tuning.

  • Digital Twin Simulations: Predict optimal air-fuel ratios based on load and ambient conditions.

Control SystemEfficiency Improvement (%)Payback Period (Years)Additional Benefit
O₂ Trim System+2–41.5Reduced emissions
Variable Speed Fan+2–32Energy savings on fan motors
CO & O₂ Monitoring+1–21Enhanced safety
Burner Management Upgrade+5–82–3Extended component life

Implementing these control strategies can recover efficiency losses caused by seasonal air density changes or fuel composition variations, ensuring steady output throughout the year.


Real-World Case Study: Industrial Gas Boiler Optimization

A 6-ton/hour gas-fired boiler operating in a manufacturing plant showed 87% efficiency before optimization. After installing an O₂ trim control, recalibrating the air damper, and upgrading to a modulating premix burner, flue gas O₂ dropped from 6.5% to 3.2%, and stack temperature fell by 40°C. Efficiency improved to 92.3%, cutting fuel consumption by 7% and annual CO₂ emissions by 280 tons. The system achieved payback in under 18 months.


Summary Table: Combustion Quality vs. Boiler Performance

FactorPoor CombustionOptimal CombustionEfficiency Difference (%)
Air-Fuel RatioImbalancedPrecisely Controlled4–8
Flame StabilityUnsteadyStable, Uniform2–4
CO FormationHighMinimal3–5
Flue Gas LossHighLow4–6
Total Efficiency85–88%92–96%

Environmental and Economic Implications

High-quality combustion not only boosts efficiency but also significantly reduces emissions. Poor combustion increases CO, NOx, and unburned hydrocarbons, all of which affect environmental compliance and operating permits. Optimized combustion leads to cleaner exhaust, lower carbon footprint, and less wear on downstream components like heat exchangers and condensing units.


Conclusion

Combustion quality is the single most powerful lever in maximizing gas boiler efficiency. A perfectly tuned air-fuel ratio, stable flame, and modern burner control system ensure the highest heat transfer, lowest emissions, and optimal fuel economy. Ignoring combustion control means accepting hidden energy losses and premature equipment degradation—costs far greater than the price of proper maintenance and monitoring.

Why Is Heat Transfer Surface Cleanliness Critical for Maintaining Efficiency?

In any boiler, heat exchanger, or thermal system, even a thin layer of dirt, soot, or scale on heat transfer surfaces can drastically reduce performance. Many operators underestimate how quickly fouling accumulates and how severe its effects can be. The consequences of neglecting surface cleanliness are not minor: a 1 mm layer of soot can increase fuel consumption by up to 8–10%, reduce overall efficiency, elevate exhaust temperatures, and accelerate corrosion. In contrast, maintaining clean heat exchange surfaces ensures the system runs at peak thermal efficiency, minimizes energy losses, and extends equipment lifespan—making cleanliness a core part of boiler operation strategy rather than a mere maintenance task.

Heat transfer surface cleanliness is critical for maintaining boiler efficiency because any fouling layer—whether soot, scale, or corrosion deposit—acts as an insulating barrier that impedes heat flow from the combustion gases to the working fluid. This insulation forces the boiler to burn more fuel to deliver the same thermal output. Even thin deposits (0.5–1 mm) can lower heat transfer efficiency by 5–10%, raise flue gas temperature by 20–40 °C, and increase operating costs significantly. Regular cleaning, water treatment, and combustion optimization are therefore essential to preserve the designed efficiency and ensure reliable performance.

Keeping heat transfer surfaces clean is one of the simplest yet most impactful actions plant managers can take to maintain system efficiency and reduce lifecycle costs. The following sections explain the mechanisms of fouling, its quantitative effects on heat transfer, detection and prevention techniques, and real-world case data.

Heat transfer surface fouling has a negligible effect on boiler efficiency.False

Even thin layers of soot or scale significantly impede heat transfer, raising fuel consumption and flue gas temperatures.


Scale forms mainly due to impurities in combustion gases.False

Scale forms on the water side due to mineral precipitation from untreated or poorly conditioned feedwater.


Understanding the Mechanisms of Fouling

Fouling refers to the accumulation of unwanted materials on heat transfer surfaces—either on the gas side (soot, ash, unburned carbon) or on the water/steam side (scale, corrosion products). Each type of deposit affects heat transfer differently, but all increase thermal resistance and lower heat flux.

Fouling TypeLocationCompositionTypical CauseThermal Conductivity (W/m·K)Efficiency Loss (%)
Soot FoulingGas SideCarbon, SulfatesIncomplete combustion0.1–0.25–10
Scale FormationWater SideCalcium, Magnesium saltsHard water, poor treatment1.2–2.02–5
Corrosion DepositsBoth sidesIron oxides, sulfidesOxygen ingress, poor pH control1.0–2.52–6
Ash or Dust FoulingGas SideFly ash, particulatesFuel impurities0.3–0.63–8

Quantitative Impact of Fouling on Thermal Efficiency

To illustrate, consider a fire-tube gas boiler with clean and fouled surfaces:

ConditionFouling Layer (mm)Flue Gas Temp (°C)Boiler Efficiency (%)Fuel Consumption Increase (%)
Clean018092.5
Light Soot0.520090.2+2.5
Moderate Fouling1.022088.0+5.0
Heavy Fouling2.025084.5+9.0

Thermodynamically, heat transfer through a layered surface can be expressed as:
1/U = 1/h₁ + δ/k + 1/h₂,
where U is the overall heat transfer coefficient, h₁ and h₂ are the gas and fluid film coefficients, δ is the fouling thickness, and k is its thermal conductivity. Even a small increase in δ dramatically reduces U, forcing higher combustion rates to maintain the same steam output.


Why Fouling Raises Fuel and Maintenance Costs

A dirty heat transfer surface not only lowers efficiency but also drives a cascade of operational problems:

  1. Higher Fuel Use: Reduced heat transfer requires more fuel for the same output.

  2. Increased Flue Gas Temperature: Heat that should transfer to the water exits through the stack.

  3. Component Stress: Hotter metal surfaces accelerate fatigue and oxidation.

  4. Reduced Output Capacity: Boilers reach temperature or pressure limits sooner.

  5. Shortened Equipment Life: Corrosion and scaling accelerate tube failure.

  6. Frequent Shutdowns: Cleaning and repair increase downtime and labor costs.

For industrial boilers consuming thousands of cubic meters of gas daily, even a 2% efficiency drop translates into tens of thousands of dollars per year in wasted fuel.


Comparative Example: Clean vs. Fouled Tube Bank

ParameterClean SurfaceFouled SurfaceEfficiency Difference
Gas Film Coefficient (h₁, W/m²·K)8080
Fouling Conductivity (k, W/m·K)0.15
Fouling Thickness (δ, mm)1.0
Overall U (W/m²·K)7045-36%
Boiler Efficiency (%)92.588.5-4.0%

As shown, a small amount of soot can reduce the overall heat transfer coefficient by more than one-third, severely impacting fuel-to-steam efficiency.


Detection and Monitoring of Fouling

Routine monitoring is vital to detect performance deterioration early. Common indicators include:

  • Rising stack temperature for the same load and fuel rate.

  • Increased differential pressure across heat exchangers.

  • Declining steam output or pressure under constant firing conditions.

  • Visual soot or scale evidence during inspection.

  • Thermographic imaging revealing uneven heat distribution.

Advanced monitoring tools, such as flue gas analyzers, thermocouples, and infrared imaging, help quantify fouling trends and schedule cleaning at optimal intervals.


Prevention Strategies for Sustained Cleanliness

  1. Combustion Optimization: Proper air-fuel ratio prevents soot formation.

  2. Water Treatment: Use softening, demineralization, and chemical dosing to prevent scaling.

  3. Regular Blowdown: Removes concentrated impurities from the water side.

  4. Automatic Soot Blowers: Periodically clean tubes in large boilers.

  5. Condensing Boiler Maintenance: Keep condensate drains clear to avoid corrosion buildup.

  6. Heat Exchanger Coatings: Use anti-fouling materials to reduce deposit adhesion.

Maintenance PracticeCleaning IntervalEfficiency Recovery (%)Cost Savings (% per Year)
Manual Tube CleaningEvery 3–6 months4–63–5
Chemical DescalingAnnually2–42–3
Continuous Water TreatmentContinuous5–84–6
O₂ Trim + Combustion ControlContinuous2–32–4

Real-World Case Study: Refinery Boiler Heat Recovery Section

In a refinery boiler system rated at 30 t/h steam capacity, flue gas temperature rose from 190 °C to 240 °C over six months. Efficiency dropped from 91.8% to 87.5%. Inspection revealed 1–1.5 mm soot on the economizer tubes. After chemical cleaning and burner re-tuning, flue temperature decreased to 185 °C, restoring efficiency to 92.1%. The intervention yielded a fuel cost reduction of 6.2% and CO₂ emissions lowered by 430 tons per year, with a payback time under six months.


Long-Term Benefits of Maintaining Clean Heat Transfer Surfaces

Beyond immediate fuel savings, clean surfaces enhance equipment reliability, safety, and environmental compliance. Reduced thermal stress minimizes tube cracking and warping, while lower flue temperatures extend refractory life and reduce stack losses. Clean systems also emit fewer pollutants, supporting regulatory standards and sustainability goals.

Benefit TypeClean SurfacesFouled SurfacesLong-Term Impact
Efficiency92–95%85–88%Higher ROI
EmissionsLowHigh CO/NOxCompliance issues
MaintenancePredictableFrequent unscheduledHigher downtime
Tube Life>10 years5–7 yearsCost reduction

Conclusion

Heat transfer surface cleanliness is not just a maintenance checklist item—it’s a decisive factor in determining boiler performance, reliability, and cost-effectiveness. Every millimeter of soot or scale creates an invisible barrier that converts valuable energy into waste. Consistent monitoring, preventive treatment, and cleaning programs guarantee that boilers operate close to their designed efficiency, saving fuel and ensuring safe, sustainable operation for years to come.

How Does Flue Gas Temperature Affect Energy Recovery and Overall Performance?

In any industrial or commercial boiler, flue gas temperature serves as a direct indicator of how efficiently the system converts fuel energy into usable heat. When flue gases exit the stack too hot, it means valuable energy is being lost to the atmosphere instead of being recovered and used within the system. This wasted heat represents lost money, higher fuel consumption, and reduced overall efficiency. Conversely, when flue gas temperature is optimized through proper design, control, and heat recovery systems, significant energy savings can be achieved—often reducing operating costs by 5–15% or more. Maintaining the right flue gas temperature is therefore not merely a technical metric but a vital economic and environmental factor in boiler performance management.

Flue gas temperature directly affects energy recovery and overall performance by determining how much heat is retained in the system versus lost through the exhaust. Lower flue gas temperatures increase boiler thermal efficiency because more heat is transferred to the working fluid or recovered through economizers and condensers. Each 20 °C reduction in flue gas exit temperature typically improves boiler efficiency by 1%. However, excessively low flue gas temperatures can cause condensation and corrosion in non-condensing systems. Therefore, the optimal flue gas temperature depends on the boiler type, fuel characteristics, and heat recovery design—balancing maximum energy recovery with system durability.

The following sections explain the thermodynamics behind flue gas losses, illustrate efficiency relationships with real-world data, and outline how advanced recovery technologies optimize energy utilization without compromising reliability.

Lower flue gas temperature always improves boiler performance.False

While lower temperatures generally increase efficiency, dropping below the dew point in non-condensing boilers can cause corrosion and damage.


Flue gas temperature has no measurable effect on energy efficiency once the boiler is tuned.False

Even small changes in flue gas temperature directly reflect heat losses and can significantly impact fuel consumption.


The Thermodynamic Relationship Between Flue Gas Temperature and Efficiency

The flue gas temperature is one of the most important performance indicators for boilers and heat exchangers. It reflects how effectively the heat from combustion is transferred to the water or steam circuit. The higher the temperature of exhaust gases leaving the boiler, the greater the heat energy lost to the atmosphere.

Flue Gas Temperature (°C)Typical Boiler TypeApprox. Efficiency (%)Fuel Energy Loss (%)Efficiency Improvement per 20 °C Drop
280Conventional gas boiler85.015.0
240Standard fire-tube boiler88.012.0+1.5
200Modern shell boiler90.59.5+1.0
160Condensing boiler94.06.0+0.8
120Advanced condensing + economizer97.03.0+0.7

The efficiency of heat transfer depends on the temperature gradient between hot flue gases and the boiler’s water or steam. As flue gases cool, less energy is lost to the environment, but the risk of condensation increases—especially if the gas temperature falls below the acid dew point (typically 130–140 °C for natural gas and 150–170 °C for oil-fired units).


Energy Recovery Through Economizers and Condensing Systems

An economizer is a key heat recovery device that captures residual heat from flue gases to preheat the feedwater entering the boiler. This reduces the fuel required to reach steam generation temperature.

System TypeTypical Flue Gas Temp (°C)Efficiency Range (%)Energy Recovery DeviceSavings Potential (%)
Standard Non-Condensing220–28085–89None
With Economizer160–20090–93Feedwater Economizer3–6
Condensing100–14094–97Condensing Heat Exchanger7–10
Advanced Hybrid Recovery80–12097–99Economizer + Condenser10–15

Condensing heat exchangers take energy recovery a step further by extracting latent heat from water vapor formed during combustion. Since roughly 10–12% of the fuel’s energy content is stored in this vapor, recovering it significantly enhances system performance. However, condensate management and corrosion resistance must be carefully designed.


Example: Effect of Flue Gas Temperature on Stack Losses

Boiler stack loss can be estimated using the formula:
Stack Loss (%) ≈ (T_fg – T_air) × (O₂% / 21) × 0.33,
where T_fg is the flue gas temperature and T_air is the combustion air temperature.

For instance, assuming 15% excess air and 25 °C combustion air:

Flue Gas Temp (°C)Stack Loss (%)Thermal Efficiency (%)
28015.584.5
24013.087.0
20010.589.5
1608.092.0
1205.594.5

This shows that reducing flue gas temperature from 240 °C to 160 °C can yield an efficiency gain of 5%, equivalent to saving roughly 50,000–100,000 cubic meters of natural gas per year for a medium industrial plant.


Flue Gas Dew Point and Corrosion Control

While lower flue gas temperatures are desirable for efficiency, condensation control is crucial. Combustion gases contain water vapor and acidic compounds (notably H₂SO₄ and H₂O). When gases cool below the acid dew point, condensate forms and leads to severe corrosion in mild-steel components.

Fuel TypeWater Dew Point (°C)Acid Dew Point (°C)Safe Min. Flue Gas Temp (°C) for Non-Condensing Systems
Natural Gas57130140
Light Oil60150160
Heavy Oil70170180

Modern condensing boilers use stainless steel or aluminum-silicon alloys that resist acidic condensate, enabling safe operation below 100 °C and harnessing the latent heat of vaporization.


Real-World Case Study: Flue Gas Optimization in a Textile Plant

A textile processing plant operating two 5-ton/hr gas boilers recorded average flue gas temperatures of 235 °C and thermal efficiency of 88%. After installing feedwater economizers and adjusting burner excess air to reduce O₂ from 6% to 3.5%, the flue gas temperature dropped to 175 °C. The resulting efficiency rose to 92.4%, saving 6.8% fuel annually—equivalent to over $45,000 in cost reduction per year and 210 tons of CO₂ emissions avoided.


Advanced Flue Gas Heat Recovery Technologies

TechnologyDescriptionEfficiency Improvement (%)Key Benefit
EconomizerRecovers sensible heat to preheat feedwater3–6Simple retrofit
Condensing Heat ExchangerRecovers latent heat from water vapor5–10High efficiency
Air PreheaterUses exhaust heat to preheat combustion air2–4Fuel flexibility
Heat Pipe ExchangerTransfers heat without fluid mixing4–6Compact, durable
Flue Gas Recirculation (FGR)Reuses part of exhaust gases for stable combustion1–2Lower NOx emissions

Combining these systems can push total energy utilization above 95%, depending on fuel type and operating conditions.


Quantitative Analysis: Efficiency vs. Flue Gas Temperature

Boiler Efficiency (%)Flue Gas Temp (°C)O₂ in Flue Gas (%)Estimated Annual Fuel Savings (%)
85.02806.0
88.52305.03.5
91.01904.06.0
93.01603.08.0
95.01202.510.5

Each 10–20 °C reduction in flue gas temperature corresponds to measurable financial benefits and emission reductions. However, to avoid dew point corrosion, proper material selection and condensate management are non-negotiable.


Long-Term Performance and Maintenance Implications

High flue gas temperatures not only lower efficiency but also accelerate wear in boiler components such as tubes, refractory linings, and exhaust ducts. By contrast, optimized flue gas control maintains steady heat transfer and prolongs component life. Regular maintenance, soot cleaning, and combustion tuning are vital to preventing flue temperature drift.

ConditionFlue Temp TrendEffect on EfficiencyMaintenance Need
Clean surfaces + tuned burnerStable (160–180 °C)Optimal (92–94%)Normal
Soot foulingRising (+20–30 °C)↓ 2–4%Immediate cleaning
Excess airRising (+10–20 °C)↓ 1–3%Tune combustion
Scale formationRising (+30–50 °C)↓ 4–6%Water treatment

Environmental Benefits of Flue Gas Temperature Optimization

Lowering flue gas temperature not only improves energy efficiency but also reduces emissions. Every percentage increase in boiler efficiency corresponds to approximately 2% CO₂ emission reduction. Furthermore, condensing systems lower NOₓ and CO emissions through cooler combustion gas recirculation.

Efficiency Improvement (%)Fuel Saved (m³/Year, Gas)CO₂ Reduction (Ton/Year)
+340,00075
+570,000130
+8110,000210
+10140,000270

Conclusion

Flue gas temperature is one of the most important determinants of boiler efficiency and energy recovery. Every degree of heat lost up the stack represents wasted fuel, unnecessary emissions, and avoidable cost. Through optimized combustion control, economizers, and condensing heat exchangers, operators can drastically improve efficiency—often achieving over 95% system performance. However, this must be balanced with materials and design suited to manage condensate safely, ensuring both energy savings and equipment longevity.

What Is the Optimal Excess Air Ratio for Efficient Gas Combustion?

In gas-fired boilers, burners, and furnaces, the air-to-fuel ratio is one of the most decisive parameters determining how efficiently fuel energy converts into useful heat. Too little air leads to incomplete combustion, soot formation, and carbon monoxide (CO) buildup. Too much air, on the other hand, cools the flame, lowers flame temperature, increases flue gas losses, and wastes energy by sending hot air up the stack. Both conditions reduce efficiency and increase costs. The key to achieving maximum efficiency and minimal emissions is maintaining the optimal excess air ratio—the delicate balance point where combustion is complete yet heat losses are minimal.

The optimal excess air ratio for efficient natural gas combustion typically ranges between 1.05 and 1.15 (or 5–15% excess air), corresponding to 2–4% oxygen (O₂) in the flue gas. This range ensures complete combustion with minimal CO formation while avoiding efficiency losses from excessive dilution or flue gas heat losses. Maintaining this ratio through precise burner tuning and real-time O₂ trim control can improve boiler efficiency by 3–8% and reduce fuel consumption significantly.

Mastering the control of excess air not only enhances combustion efficiency but also contributes to equipment longevity, emission reduction, and lower operational costs. The sections below explain the science, data, and practical control methods behind this optimization.

Using more air always improves combustion efficiency by ensuring complete burning.False

Excessive air cools the flame, increases flue gas losses, and lowers efficiency. Optimal—not maximum—air is needed for best results.


Natural gas combustion requires no excess air because it is a clean fuel.False

Even clean fuels like natural gas need 5–15% excess air to ensure complete oxidation and avoid CO formation.


The Role of Excess Air in Combustion Efficiency

For perfect (stoichiometric) combustion, the fuel and oxygen mix in exact proportions so that all carbon and hydrogen atoms in the fuel are completely oxidized. For methane (CH₄), the ideal chemical equation is:

CH₄ + 2O₂ → CO₂ + 2H₂O

However, real-world burners never achieve perfect mixing. Therefore, a small excess of air is required to ensure that all fuel molecules find enough oxygen for complete combustion.

Combustion Air LevelExcess Air (%)Flue Gas O₂ (%)CO (ppm)Combustion ConditionEfficiency Impact
Too Little (Rich)0–30–1200–2000Incomplete combustion, soot↓ 5–10%
Optimal5–152–4<100Complete combustion↑ Maximum
Too Much (Lean)>25>6<50Cool flame, energy loss↓ 3–6%

Quantitative Relationship Between Excess Air and Efficiency

As excess air increases, two things happen simultaneously:

  1. CO and unburned hydrocarbons decrease (improving combustion completeness).

  2. Flue gas volume and temperature increase, carrying more heat out of the boiler (reducing efficiency).

Excess Air (%)Flue Gas O₂ (%)Flue Gas Temp (°C)Efficiency (%)Efficiency Loss vs. Optimal (%)
0 (Stoichiometric)0.0190Unstable combustion
51.018592.2+
102.018092.5Optimal
204.020090.3-2.2
306.021588.5-4.0
509.023586.2-6.3

Each 10% increase in excess air above optimal levels can reduce boiler efficiency by 1–2%. Over time, this translates into significant fuel cost increases.


Real-World Example: Boiler Efficiency vs. Excess Air Ratio

CaseAir Ratio (λ)O₂ in Flue Gas (%)Stack Temp (°C)Boiler Efficiency (%)Fuel Cost Impact
Underfired0.950.519589.5High CO, unsafe
Optimal1.103.018092.5Maximum efficiency
Overfired1.306.020589.8Fuel waste
Severely Overfired1.508.522587.4Large heat loss

The ideal air ratio (λ) for natural gas lies between 1.05 and 1.15, while oil-fired systems may require slightly higher (1.10–1.25) due to fuel atomization and impurities.


How Excess Air Affects Flame and Heat Transfer

Flame temperature and radiation efficiency are directly tied to the air-to-fuel ratio. Too much air reduces flame temperature and radiant heat transfer, while too little causes unstable combustion and soot formation.

ConditionFlame Temp (°C)Visual AppearanceCO EmissionEfficiency Impact
Insufficient Air1000–1100Yellow, smokyHighPoor
Optimal1150–1250Blue, stableLowBest
Excess Air950–1050Pale, weakLowModerate loss

Optimal combustion ensures a blue, steady flame and minimal unburned fuel. A pale, elongated flame often indicates excessive air and reduced energy transfer to the boiler surfaces.


Efficiency Loss Mechanisms with Too Much Air

  1. Dilution of combustion gases → Lower heat transfer rates.

  2. Increased flue gas mass flow → More heat leaves through the stack.

  3. Reduced radiant heat transfer → Flame becomes cooler and less efficient.

  4. Fan power increase → Higher parasitic energy consumption.

  5. Thermal stress → Uneven temperatures accelerate wear on tubes and refractory.

For every 1% rise in flue gas O₂ content, the boiler’s thermal efficiency typically drops by 0.6–1.0%.


Burner Design and Control: The Path to Optimal Air Management

Modern burners and control systems use advanced sensors and feedback loops to maintain precise air-fuel ratios under varying load conditions.

TechnologyFunctionEfficiency Improvement (%)Key Advantage
O₂ Trim ControlContinuously adjusts air supply to maintain target O₂+2–4Real-time optimization
Variable Speed FanMatches airflow with load demand+1–2Reduced power use
Electronic Ratio ControlEnsures consistent air-fuel mixture+3–5Stable operation
Flue Gas AnalyzerMonitors CO, O₂, NOx in exhaustDiagnosticPrevents drift and imbalance

A well-tuned burner with automatic control can maintain O₂ at 3.0 ± 0.2%, keeping efficiency consistently above 92–94% for gas-fired systems.


Case Study: Efficiency Gains Through O₂ Trim Control

A food processing plant operating a 4-ton/hr gas boiler observed average O₂ levels around 6%, indicating excessive air. After installing an O₂ trim control system, O₂ dropped to 3.2%, and flue gas temperature decreased from 210 °C to 180 °C. As a result, boiler efficiency improved from 89.8% to 92.6%, saving 6.2% in annual fuel costs and reducing CO₂ emissions by 150 tons per year.


Relationship Between Excess Air and Emissions

Controlling excess air also helps minimize emissions. Rich mixtures increase CO and unburned hydrocarbons, while lean mixtures elevate NOx due to higher oxygen availability at elevated temperatures.

Air Ratio (λ)CO (ppm)NOx (ppm)Efficiency Trend
0.9500–2000Low↓ (Incomplete)
1.0100–300Moderate
1.1<100Optimal↑ Maximum
1.3<50High↓ (Lean loss)

Thus, controlling excess air not only maximizes efficiency but also ensures regulatory compliance with emission standards.


Advanced Optimization Strategies

  1. Continuous Flue Gas Monitoring: Using real-time O₂ and CO sensors for closed-loop control.

  2. Load-Adaptive Tuning: Adjusting air ratio dynamically with burner load.

  3. Periodic Calibration: Ensuring sensors and actuators maintain accuracy.

  4. Data-Driven Diagnostics: Using AI or digital twins to detect drift in combustion parameters.

  5. Combined Air-Fuel Ratio Control (AFRC): Integrating burner modulation and airflow control into one synchronized system.

Optimization MethodControl PrecisionEfficiency Gain (%)Typical Payback
Manual Adjustment±1.0% O₂0–2
O₂ Trim System±0.2% O₂2–41–2 years
Full AFRC System±0.1% O₂3–62–3 years

Long-Term Benefits of Maintaining Optimal Excess Air

  • Fuel cost reduction: 3–8% savings annually

  • Emission reduction: 5–10% lower CO₂, 15–30% lower CO

  • Stable boiler operation with reduced cycling

  • Extended equipment life through reduced thermal stress

  • Improved safety due to consistent flame and low CO

Benefit TypeImpact LevelDescription
Energy EfficiencyHighMaintains design efficiency (92–95%)
Operational StabilityHighPrevents soot, flameout, and surge
Emission ControlHighReduces CO, NOx
Maintenance SavingsMediumFewer cleanings and tune-ups
Lifecycle Cost ReductionHigh5–10% over 10 years

Conclusion

The optimal excess air ratio—typically 1.05–1.15 for natural gas—is a cornerstone of efficient, safe, and sustainable combustion. Too much or too little air both lead to energy waste and emissions. The most effective systems maintain real-time control through O₂ trimming, burner modulation, and continuous monitoring. Keeping your combustion process precisely tuned not only protects your equipment but also yields measurable fuel savings and environmental benefits.

How Do Regular Maintenance and Tuning Prevent Efficiency Losses?

Industrial and commercial boiler systems are designed for high thermal efficiency and long service life—but only when properly maintained. Over time, soot buildup, scaling, air leaks, and control drift silently erode performance. Even small inefficiencies—such as a 1% rise in flue gas temperature or 0.5% change in oxygen levels—can lead to thousands of dollars in wasted fuel annually. Neglected boilers also suffer from higher emissions, unplanned downtime, and costly component failure. The key to sustaining peak efficiency is regular maintenance and precise tuning, which ensure that combustion, heat transfer, and control systems operate at their designed performance levels.

Regular maintenance and tuning prevent efficiency losses in boilers by ensuring optimal combustion, clean heat transfer surfaces, proper water chemistry, and accurate control calibration. Scheduled cleaning of heat exchangers, burner inspection, air-fuel ratio tuning, and instrumentation checks can recover 3–8% efficiency lost through fouling, scaling, or drift. This proactive approach reduces fuel consumption, emissions, and mechanical stress, extending boiler life and maintaining consistent performance.

Routine maintenance is not just a safety requirement—it’s a profit safeguard. Each maintenance task, from flue cleaning to O₂ sensor calibration, helps preserve energy efficiency, reduce carbon footprint, and minimize lifecycle costs.

Boiler maintenance mainly improves safety but has little effect on efficiency.False

Proper maintenance significantly enhances combustion efficiency, reduces flue gas losses, and maintains optimal heat transfer.


Boiler tuning is optional if the system runs continuously without visible issues.False

Even well-running boilers require periodic tuning to correct air-fuel ratio drift and sensor inaccuracies that reduce efficiency.


The Science Behind Efficiency Degradation

Every operating boiler faces gradual efficiency decline due to several physical and chemical mechanisms:

CauseDescriptionEfficiency Loss (%)Typical Frequency
Soot FormationDeposits on tubes reduce heat transfer2–5Monthly–Quarterly
Scaling (CaCO₃, Silica)Insulating layer on water side1–4Semiannual
Air LeakageUnmetered air cools flue gases1–2Annual
Burner DriftO₂ setpoint deviation increases excess air2–3Quarterly
Sensor AgingO₂/CO sensors lose calibration accuracy1–2Semiannual

A neglected boiler can lose up to 10% of its rated efficiency within 12–18 months, translating into tens of thousands of dollars in wasted fuel.


Core Areas of Maintenance That Preserve Efficiency

Maintenance TaskFunctionRecommended FrequencyEfficiency Impact (%)
Flue Gas Path CleaningRemoves soot and particulates from tubes and bafflesMonthly–Quarterly+2–4
Feedwater Treatment CheckEnsures proper pH and hardness levelsWeekly+1–2
Burner TuningAdjusts air-fuel ratio for optimal combustionQuarterly+3–5
O₂ Trim CalibrationMaintains sensor accuracySemiannual+1–2
Blowdown System TestPrevents scale buildup and maintains water purityWeekly–Monthly+1
Heat Exchanger InspectionEnsures clean surfaces for heat transferSemiannual+2–3

Together, these tasks maintain consistent thermal transfer efficiency and minimize fuel loss.


Heat Transfer Cleanliness and Its Link to Maintenance

Fouling on heat transfer surfaces—either by soot on the gas side or scale on the water side—acts as an insulating barrier that impedes heat flow. For example:

Fouling TypeFouling Thickness (mm)Efficiency Loss (%)Fuel Cost Increase (%)
Light soot0.522
Moderate soot1.044.5
Heavy soot2.089
Scale (CaCO₃)1.022
Scale (Silica)2.044.5

A thin layer of soot just 1 mm thick can increase flue gas temperature by 20–25 °C, lowering efficiency by 3–4%. Regular brushing or soot-blowing restores efficiency almost instantly.


The Role of Tuning in Combustion Optimization

Combustion tuning adjusts burner settings to achieve the optimal air-fuel ratio, ensuring complete fuel burning with minimal excess air. As sensors age or fuel characteristics change, tuning offsets efficiency loss by recalibrating air supply, gas pressure, and burner head position.

ParameterBefore TuningAfter TuningImprovement
Flue Gas O₂ (%)6.53.2-3.3% (less excess air)
Flue Gas Temp (°C)215180-35 °C
CO (ppm)200<50Lower CO
Boiler Efficiency (%)89.592.8+3.3%

This small improvement yields significant fuel savings, especially in continuous-duty boilers. For example, a 4-ton/hr boiler burning natural gas at $10/MMBtu could save $8,000–$12,000 annually from proper tuning alone.


Predictive and Preventive Maintenance: The Modern Approach

Modern plants increasingly adopt predictive maintenance (PdM) strategies using sensors, analytics, and digital twins. Continuous monitoring detects minor deviations before they cause performance drops.

Maintenance TypeBasisTools UsedEfficiency Recovery (%)Cost Saving (%)
ReactivePost-failureManual inspection
PreventiveScheduledRoutine cleaning3–65–10
PredictiveData-drivenSensors, AI analytics5–810–15

Predictive systems monitor O₂, CO, flue gas temperature, and vibration, alerting operators to tune or clean before performance losses occur.


Case Study: 10 TPH Gas Boiler Maintenance Optimization

A 10-ton-per-hour gas boiler in a textile plant exhibited falling efficiency from 92% to 88% over nine months. Flue gas analysis revealed O₂ at 6.8% and temperature at 220 °C—indicating fouling and excess air. After a scheduled cleaning and tuning program:

  • O₂ reduced to 3.4%

  • Stack temperature dropped to 185 °C

  • Efficiency restored to 92.3%

  • CO₂ emissions reduced by 8%

  • Annual fuel savings: $18,500

This highlights the direct monetary benefit of systematic maintenance.


Efficiency Decay Curve Without Maintenance

Operating Time (Months)Typical Efficiency (%)Loss per Month (%)Notes
0 (Post-Tuning)92.5Optimal state
391.0-0.5Minor soot
689.5-1.0Scale formation
988.0-1.5Drift and fouling
1287.0-2.0Efficiency crisis

The data proves that maintenance frequency directly correlates with retained efficiency.


Key Maintenance and Tuning Checklist

  1. Visual Inspection: Check burners, seals, and flue integrity.

  2. Flue Gas Analysis: Measure O₂, CO, CO₂, and NOx levels.

  3. Clean Heat Transfer Surfaces: Brush or blow soot deposits.

  4. Check Air-Fuel Ratio: Adjust for minimal excess air.

  5. Calibrate Sensors: O₂ probes, thermocouples, and gas analyzers.

  6. Inspect Feedwater Quality: Prevent internal scaling.

  7. Lubricate Fans and Pumps: Maintain mechanical efficiency.

  8. Test Safety Valves and Controls: Ensure stability under variable loads.

  9. Record Data: Build trend analysis for predictive maintenance.


Economic Impact of Maintenance Neglect vs. Regular Tuning

ConditionEfficiency (%)Annual Fuel Cost (USD)Maintenance Cost (USD)Net Annual Impact (USD)
No Maintenance88.0120,0000
Quarterly Maintenance & Tuning92.5111,0005,000+4,000 net saving
Predictive Program93.5109,0008,000+3,000 net saving + longer life

Regular tuning typically achieves a payback within 6–12 months through reduced fuel bills alone.


Environmental and Operational Benefits

Beyond economics, consistent maintenance reduces emissions, increases system safety, and enhances regulatory compliance.

BenefitTypical ImprovementDescription
CO Reduction50–80%From cleaner combustion
NOx Control10–25%From optimized flame temperature
CO₂ Reduction5–10%From fuel savings
ReliabilityHighFewer unplanned shutdowns
Equipment Life+20–30%Reduced thermal stress

Regular tuning thus aligns operational efficiency with sustainability goals.


Integration of Digital Tools for Maintenance Optimization

Advanced plants now integrate IoT and AI systems for real-time efficiency tracking. Tools such as vibration sensors, smart soot blowers, and flue gas analyzers provide early warnings before visible degradation occurs.

Digital ToolFunctionBenefit
O₂ Trim ControllerReal-time combustion controlMaintains optimal O₂
Smart Soot BlowerAutomated cleaningKeeps heat exchangers clean
Cloud Data LoggerLong-term performance trackingTrend-based alerts
Predictive AnalyticsDetects efficiency driftPrevents unplanned loss

Conclusion

Regular maintenance and tuning are the foundation of sustained boiler efficiency. Soot, scale, or minor drift may seem insignificant, but together they can erode up to 10% efficiency and raise operating costs sharply. Implementing a consistent, data-driven maintenance program ensures optimal combustion, clean heat transfer, and stable operation—delivering measurable returns in fuel savings, emission reduction, and equipment longevity.

What Monitoring Systems Help Sustain Long-Term Boiler Efficiency?

Boiler efficiency, once achieved through proper design and tuning, does not remain constant. Even a high-performance system can degrade over time due to component wear, fouling, or combustion drift. In traditional setups, operators often rely on periodic manual checks, which detect issues only after efficiency has dropped or fuel consumption has risen. The consequence is wasted energy, higher emissions, and increased maintenance costs. The solution lies in continuous monitoring systems—advanced technologies that track combustion, heat transfer, and auxiliary performance in real time. By providing immediate feedback, these systems enable proactive optimization and sustain long-term boiler efficiency.

Modern boiler monitoring systems sustain long-term efficiency by continuously tracking key performance parameters such as flue gas oxygen (O₂), carbon monoxide (CO), temperature, steam flow, fuel rate, and water quality. Integrated digital platforms—including O₂ trim controls, predictive analytics, and IoT-based sensors—automatically adjust operating conditions to maintain optimal combustion and heat transfer. These systems typically improve boiler efficiency by 3–8%, reduce unplanned downtime, and extend equipment lifespan by ensuring consistent, data-driven performance.

Understanding which monitoring systems are essential—and how they work together—helps industries build intelligent, energy-efficient boiler rooms that minimize waste and maximize uptime.

Manual inspection once a month is sufficient to maintain high boiler efficiency.False

Boiler efficiency fluctuates daily; only continuous monitoring can detect real-time deviations and sustain optimal performance.


Boiler monitoring systems are mainly for safety, not for efficiency improvement.False

Modern monitoring systems actively optimize combustion, reduce heat losses, and maintain peak efficiency while improving safety.


The Role of Monitoring in Boiler Efficiency Management

Boiler efficiency is a function of multiple interacting variables—fuel input, combustion quality, air-fuel ratio, heat transfer, steam load, and feedwater properties. Continuous monitoring allows these variables to be measured, analyzed, and corrected automatically. Without it, minor deviations can go unnoticed and accumulate into major efficiency losses.

Parameter MonitoredTypical Sensor or SystemDeviation Impact on Efficiency (%)Corrective Action
Flue Gas O₂O₂ Analyzer + Trim Controller±1% O₂ → -0.6% efficiencyAdjust air-fuel ratio
Flue Gas TemperatureThermocouples+10°C → -0.3%Clean heat surfaces
Steam Pressure/FlowFlow Meter + Pressure SensorUnstable load → -2%Load balancing
Feedwater ConductivityTDS SensorHigh TDS → scaling → -3%Blowdown adjustment
Fuel Flow RateMass Flow MeterDrift → excess fuelCalibrate meter
CO/NOxFlue Gas AnalyzerHigh CO → incomplete combustionRe-tune burner

A well-instrumented boiler uses this data to optimize operations continuously—keeping efficiency within ±1% of design specifications.


Core Monitoring Systems That Sustain Efficiency

1. Flue Gas Analyzers and O₂ Trim Control

These systems measure oxygen, CO, and CO₂ levels in exhaust gases, providing direct insight into combustion quality.

FunctionKey BenefitTypical Efficiency Gain (%)Installation Type
O₂ Trim ControllerAdjusts air-fuel ratio automatically+2–4Retrofit or new
CO SensorDetects incomplete combustion+1Flue-mounted
Dual Gas AnalyzerBalances O₂ and CO for precision+3–5Integrated

O₂ trim systems maintain a constant 2–4% O₂ in the flue gas despite changes in load or ambient air temperature, reducing fuel waste and emissions.


2. Stack Temperature and Heat Recovery Monitoring

Stack thermocouples measure flue gas exit temperature, a critical indicator of heat transfer efficiency. A rising stack temperature often signals soot deposition or scaling.

ConditionFlue Gas Temp (°C)Efficiency (%)Recommended Action
Optimal175–18592–93Normal operation
Mild Fouling195–21090–91Schedule cleaning
Severe Fouling220+<89Immediate maintenance

When combined with economizer monitoring, these sensors ensure optimal energy recovery and prevent unnoticed efficiency losses.


3. Combustion Management System (CMS)

CMS integrates burner controls, O₂ trim, and gas analyzers into one intelligent platform. It automatically adjusts valves and dampers to match load demand.

CMS FeatureDescriptionEfficiency Gain (%)CO Reduction (%)
Auto Air-Fuel RatioDynamic tuning by load+3–520–30
Load-Adaptive FiringModulates flame based on demand+210
Predictive DiagnosticsDetects drift and anomalies early+1–2

CMS provides consistent combustion quality across varying fuel pressures, temperatures, and loads.


4. Water Quality and Blowdown Monitoring

Feedwater impurities cause internal scaling, which impedes heat transfer. Monitoring total dissolved solids (TDS), pH, and conductivity prevents this.

ParameterIdeal RangeMonitoring DeviceImpact if Out of Range
TDS<3000 ppmTDS MeterScale formation, +3–5% energy loss
pH8.5–9.5pH SensorCorrosion risk
Oxygen (O₂)<0.02 mg/LDissolved Oxygen AnalyzerTube corrosion

Automated blowdown systems linked with TDS sensors remove impurities only when necessary—saving both energy and water.


5. Fuel and Steam Flow Monitoring

Fuel flow meters and steam meters track boiler input and output to calculate real-time efficiency (η = output energy / input energy).

Monitoring ToolMeasurement TypeFunctionUsefulness
Thermal Mass Flow MeterGas/OilTracks true fuel usageEfficiency calc
Vortex Flow MeterSteamMeasures actual steam productionPerformance tracking
Energy MeterCombinedDisplays system efficiency trendsPredictive analytics

Automating this data into dashboards provides daily insights into energy trends and alerts operators to anomalies.


Advanced Digital Systems for Boiler Efficiency

TechnologyFunctionEfficiency Improvement (%)Application
IoT-Based Monitoring PlatformReal-time cloud data collection4–6Multi-boiler systems
AI-Powered Predictive MaintenanceIdentifies early-stage fouling or drift3–5Continuous-duty plants
Digital Twin SimulationVirtual replica for efficiency testing2–4High-load applications
Integrated SCADA SystemSupervises all sensors and control loops5–8Industrial plants
Remote Monitoring DashboardProvides mobile alerts and analytics2–3Facilities management

These technologies provide continuous visibility, ensuring that performance deviations trigger corrective actions before major efficiency losses occur.


Case Study: Smart Monitoring for Efficiency Recovery

A 15-ton/hr natural gas boiler in a food processing plant showed a 6% efficiency drop over one year. The installation of a digital combustion management and IoT monitoring system provided the following results:

ParameterBefore MonitoringAfter ImplementationImprovement
O₂ Flue Gas (%)6.23.4Optimal
CO (ppm)22045Lower
Stack Temp (°C)210185Reduced heat loss
Boiler Efficiency (%)88.592.6+4.1%
Annual Fuel Saving (USD)36,000Direct benefit

In addition, real-time alerts prevented downtime and optimized burner cycles, demonstrating that monitoring systems quickly pay for themselves.


Example: Integrated Efficiency Monitoring Dashboard

ModuleData TrackedAlert ThresholdResponse Action
Combustion ControlO₂, CO, NOxO₂ > 5%Adjust burner trim
Heat TransferStack Temp+15°CClean tubes
Water QualityTDS >3000 ppmHighBlowdown cycle
Steam OutputFlow imbalance±5%Check feed pump
MaintenanceOperation hours >500DueService inspection

Such integration converts data into actionable insights—maximizing uptime and minimizing manual intervention.


The Economics of Continuous Monitoring

Monitoring LevelCapex Increase (%)Efficiency Gain (%)Payback Period (Years)
Basic Sensors (Temp, Pressure)+2+1–22–3
O₂ Trim + Analyzer+5+3–41–1.5
Full IoT Integration+10+6–81–2
Predictive AI System+15+7–101.5–2.5

With energy prices rising globally, these systems pay back quickly through fuel savings, lower downtime, and reduced maintenance expenses.


Long-Term Benefits of Monitoring Systems

Benefit CategoryTypical ImprovementDescription
Efficiency Retention+3–8%Sustains design performance
Fuel Cost Reduction5–10%Detects inefficiencies early
Emission Reduction10–20%Keeps combustion clean
ReliabilityHighEarly fault detection
Asset Life Extension+20–30%Lower thermal and mechanical stress

These benefits make monitoring systems essential not only for performance but also for compliance and sustainability goals.


Integration with Digital Energy Management Systems

Integrating boiler monitoring with a Plant Energy Management System (EMS) offers holistic control. The EMS aggregates data from multiple boilers, chillers, and generators to optimize plant-wide energy use.
For example, when one boiler operates inefficiently, the EMS redistributes load to higher-efficiency units—minimizing total fuel consumption.

This data integration also supports ISO 50001 energy management standards, which require verified, continuous performance tracking.


Conclusion

Sustaining long-term boiler efficiency requires more than design and tuning—it demands continuous, intelligent monitoring. From flue gas analysis and O₂ trim control to IoT-enabled predictive diagnostics, these systems ensure every part of the boiler operates within its efficiency envelope. The result is lower fuel bills, fewer breakdowns, reduced emissions, and a more sustainable operation overall.

🔍 Conclusion

Industrial gas boiler efficiency depends on precise combustion control, effective heat recovery, and disciplined maintenance. By focusing on these five key factors, operators can achieve energy savings, emission reduction, and long-term operational reliability.


📞 Contact Us

💡 Looking to optimize your industrial gas boiler performance? We offer efficiency audits, system upgrades, and intelligent control solutions for gas-fired boiler systems.

🔹 Contact us today to enhance your boiler efficiency and reduce fuel consumption. ⚡🔥🏭✅

FAQ

Q1: What are the main factors affecting industrial gas boiler efficiency?

A1: Industrial gas boiler efficiency is influenced by multiple factors including fuel quality, combustion control, boiler design, heat loss management, and maintenance frequency. High-quality fuel ensures complete combustion, while proper air-fuel ratio tuning maximizes heat output. Regular maintenance prevents scaling, soot buildup, and energy wastage. The boiler’s design and insulation quality also determine how effectively heat is transferred to the system. Ultimately, optimizing these elements reduces fuel consumption and operational costs while improving overall system reliability.

Q2: How does fuel quality impact industrial gas boiler efficiency?

A2: Fuel quality directly affects combustion efficiency and boiler performance. Poor-quality fuel may contain impurities or moisture, leading to incomplete combustion and soot formation that reduces heat transfer. Using clean, dry natural gas and maintaining consistent pressure helps achieve stable combustion and higher thermal efficiency. Additionally, regular fuel analysis ensures the gas meets required calorific value standards. Upgrading to higher-quality or cleaner fuels can reduce emissions and maintenance needs while boosting efficiency.

Q3: Why is boiler maintenance essential for energy efficiency?

A3: Regular boiler maintenance is crucial for sustaining high efficiency. Tasks such as cleaning heat exchangers, inspecting burner systems, checking water quality, and removing soot buildup help prevent energy losses. Neglecting maintenance leads to scaling, corrosion, and reduced heat transfer rates. A properly maintained boiler operates closer to its rated efficiency, extending its lifespan and lowering fuel costs. Maintenance should include both routine checks and professional servicing at scheduled intervals.

Q4: How does boiler load management influence efficiency?

A4: Operating a boiler close to its optimal load range significantly improves efficiency. Running at very low or high loads causes fluctuating combustion rates and heat loss. Implementing load management strategies such as modulating burners or using multiple boilers for varying demands ensures more stable performance. Smart control systems can automatically adjust burner output to match load changes, maintaining consistent combustion and minimizing energy waste.

Q5: Can insulation and heat recovery improve boiler efficiency?

A5: Yes, insulation and heat recovery systems can substantially enhance industrial gas boiler efficiency. Proper insulation minimizes heat losses from the boiler body and piping, while economizers and condensate heat recovery units reclaim waste heat from flue gases. This recovered energy preheats feedwater or combustion air, reducing the need for additional fuel input. Investing in advanced insulation materials and heat recovery technology not only improves efficiency but also lowers carbon emissions and operational expenses.

References

  1. Boiler Efficiency Improvement & Heat Loss Explainedhttps://www.energysaver.nsw.gov.au/Energy Saver NSW

  2. Improving Energy Efficiency of Boiler Systemshttps://www.energy.gov/U.S. Department of Energy

  3. Boiler Efficiency Guidehttps://www.cleaverbrooks.com/Cleaver-Brooks

  4. Understanding Combustion Efficiencyhttps://www.spiraxsarco.com/Spirax Sarco

  5. Factors Affecting Boiler Performancehttps://www.engineeringtoolbox.com/Engineering Toolbox

  6. Industrial Boiler Maintenance Best Practiceshttps://www.powermag.com/Power Magazine

  7. Energy Efficiency in Boilershttps://www.carbontrust.com/Carbon Trust

  8. Heat Recovery Systems for Industrial Boilershttps://www.energy.gov/eere/amo/DOE Advanced Manufacturing Office

  9. Boiler Insulation & Energy Losshttps://www.insulation.org/Insulation Institute

  10. Gas Boiler Optimization Techniqueshttps://www.plantengineering.com/Plant Engineering

Wade Zhang

CEO of Taishan Group Taian Boao International Trade Co., Ltd. 30 years experience in Global industrial boiler market,  Over 300 boiler projects experience, including 21+ EPC projects. Projects span 30+ countries & regions, involving industries such as nuclear power, energy & electricity, municipal heating, mining, textiles, tires etc.

Top 5 Key Factors Affecting Industrial Gas Boiler Efficiency Read More »

Exploring Industrial Boiler Solutions at the 138th Canton Fair

Exploring Industrial Boiler Solutions at the 138th Canton Fair

Impressive Start at the Canton Fair: Global Visitors Engaged at Booth 18.1A09

The 138th Canton Fair 2025 officially opened in Guangzhou, China, and Taishan Group, a globally recognized industrial steam boiler and power plant boiler supplier, made a strong impression on the very first day.
Our booth 18.1A09 welcomed numerous international visitors, including potential clients from Tanzania and other countries, who showed great interest in our latest energy-efficient and sustainable boiler solutions.

The booth, meticulously designed and well-organized, showcased the professionalism and technical strength that define Taishan Group. Visitors engaged with our technical and sales team, learning about our wide range of products — from coal-fired boilers and biomass boilers to oil and gas boilers, waste-to-energy boilers, and thermal oil heaters — all designed to meet diverse industrial and power generation needs.

Delivering Reliable and Sustainable Boiler Solutions

At this year’s Canton Fair, Taishan Group continues to highlight its commitment to high efficiency, low emissions, and operational reliability — the core values driving our product innovation.
Our advanced industrial boiler systems are widely applied in sectors such as power plants, chemical processing, food and beverage, textile manufacturing, and renewable energy projects.

Each boiler is engineered with optimized combustion systems, automatic control technologies, and robust safety designs, ensuring long-term stable performance and compliance with global energy standards.

Strong International Interest and Positive Market Feedback

The first day of the exhibition demonstrated strong global demand for high-performance industrial boilers. Customers from Southeast Asia, Africa, and South America expressed particular interest in our high-efficiency steam and hot water boilers, appreciating their adaptability to local fuel types and environmental requirements.

Through in-depth technical discussions, our team provided detailed explanations on system design, pressure configurations, and fuel flexibility — emphasizing Taishan Group’s capability to deliver customized boiler solutions tailored to each client’s operational needs.

Looking Ahead: Continued Engagement Throughout the Canton Fair 2025

As the 138th Canton Fair continues through October 15–19, 2025, Taishan Group invites more international partners to visit Booth 18.1A09 to explore advanced industrial boiler technologies that combine efficiency, sustainability, and reliability.

We look forward to meeting more clients, sharing technical insights, and building long-term cooperation for a cleaner, more energy-efficient future.

🔍 Conclusion

Taishan Group’s participation in the 138th Canton Fair 2025 reaffirms its commitment to technological innovation and global sustainability. With advanced boiler systems engineered for performance, efficiency, and environmental compliance, Taishan Group stands ready to support industrial and power clients worldwide in achieving energy transformation and green development goals.


📞 Visit or Contact Us

📍 Event: The 138th Canton Fair 2025
📅 Date: April 15–19, 2025
🏢 Location: China Import and Export Fair Complex, Guangzhou, China
📦 Booth: 𝟏𝟖.𝟏𝐀𝟎𝟗

💡 Schedule a meeting or technical consultation with our experts today!

🔹 Join Taishan Group at the Canton Fair and discover the future of industrial boiler innovation. ⚙️🔥🌍✅

Wade Zhang

CEO of Taishan Group Taian Boao International Trade Co., Ltd. 30 years experience in Global industrial boiler market,  Over 300 boiler projects experience, including 21+ EPC projects. Projects span 30+ countries & regions, involving industries such as nuclear power, energy & electricity, municipal heating, mining, textiles, tires etc.

Exploring Industrial Boiler Solutions at the 138th Canton Fair Read More »

Power Plant Boiler Price Guide: Key Cost Factors Explained

Power Plant Boiler Price Guide: Key Cost Factors Explained

Investing in a power plant boiler is a major capital decision that directly affects project feasibility, long-term efficiency, and return on investment. Many plant owners underestimate how design, capacity, fuel type, and system configuration can dramatically influence overall cost — leading to budget overruns or performance shortfalls.

The price of a power plant boiler varies widely, typically ranging from $1.5 million to over $20 million, depending on capacity (10–500 t/h), pressure level, fuel type (coal, gas, biomass, or waste), efficiency grade, and the inclusion of auxiliary systems such as economizers, superheaters, and emission control devices. Other cost factors include engineering design, site conditions, transportation, installation, and automation systems. Understanding these key cost drivers helps investors make accurate, value-based decisions.

By analyzing the main factors affecting boiler price, decision-makers can balance initial investment with operational performance and lifecycle cost.

How Does Boiler Capacity and Steam Pressure Affect Total Cost?

When planning an industrial or utility boiler investment, the most decisive cost factors are almost always boiler capacity (steam output) and steam pressure level. These two parameters determine not only the size and complexity of the equipment but also the materials, safety systems, auxiliary components, and installation requirements needed to meet performance and compliance standards. Many buyers underestimate how dramatically a small increase in capacity or pressure can multiply total project cost.

In short:

Larger boiler capacity and higher steam pressure directly increase total cost due to thicker pressure parts, stronger materials, higher safety ratings, and more complex auxiliary systems required to handle elevated thermal and mechanical stresses.

Boiler cost scales linearly with capacity and pressure.False

In reality, cost growth is exponential due to material strength, fabrication complexity, and safety system requirements.


Higher steam pressure requires more robust materials and thicker tube walls, increasing fabrication and testing costs.True

High-pressure boilers must meet ASME Section I or EN 12952 design codes, which mandate stronger alloy steels and more extensive quality assurance.


1. Influence of Capacity (Steam Output) on Boiler Cost

Boiler capacity—usually measured in tons of steam per hour (t/h) or megawatts (MW)—is a direct reflection of plant energy demand. As capacity increases, so do the dimensions, material thickness, number of tubes, and ancillary systems such as feedwater pumps and draft fans.

Steam Capacity (t/h)Typical ApplicationBase Cost Range (USD)Cost Trend
1–10Small industrial (food, textile)$60,000–$350,000Linear
10–35Medium process / heating plant$350,000–$900,000Gradual
35–75Large industrial plant$0.9–$2.5 millionExponential
75–150Utility or cogeneration$2.5–$6 millionSteep
>150Power generation$6–$15+ millionCustom design

Observation:
Every doubling of steam output tends to increase cost by 1.5× to 1.8×, due to the need for larger heat transfer surfaces, heavier structures, and stronger foundations.

Excel-Ready Formula:
Estimated Cost = Base_Cost × (Capacity / Reference_Capacity)^n
Typical n = 0.6–0.8, depending on boiler type and design pressure.


2. Effect of Steam Pressure on Boiler Investment

Steam pressure dictates not only the thermal energy delivered per kilogram of steam but also the mechanical stresses acting on the boiler structure. Higher pressure requires thicker tubes, drum shells, and stronger welds, often involving chromium-molybdenum alloy steels and rigorous ASME/EN inspections.

Pressure Range (MPa)Boiler TypeDesign ComplexityMaterial RequirementRelative Cost Increase
<1.6Low pressure (heating)SimpleCarbon steelBaseline (×1.0)
1.6–3.9Medium pressureModerateSA-210, SA-516×1.2–1.4
4.0–9.8High pressure (process)Complex1–1.25Cr–0.5Mo alloy×1.6–2.0
10–18Subcritical/CFBAdvanced2.25Cr–1Mo×2.5–3.5
>22Supercritical/USCUltra-complex9–12Cr ferritic/martensitic steels×4.0–5.5

At higher steam pressures (>9 MPa), fabrication must follow tighter tolerances and radiographic weld inspections (RT100%), adding both cost and time to manufacturing.


3. Capacity–Pressure Interaction: The Compounding Cost Effect

The cost influence of capacity and pressure is not additive but multiplicative—a high-capacity, high-pressure boiler requires both large-scale fabrication and high-grade materials.

CaseSteam Output (t/h)Pressure (MPa)Approx. Cost (USD)
A101.0$200,000
B106.4$320,000
C356.4$950,000
D759.8$2.7 million
E15016.5$6.8 million

Key Insight:
Going from 10 t/h at 1 MPa to 150 t/h at 16.5 MPa raises cost by >30×, primarily due to materials, manufacturing standards, and auxiliary integration.


4. Technical Reasons for Cost Escalation

Design FactorImpact on CostExplanation
Tube Wall Thickness+15–25%Needed for high pressure; increases material and welding cost.
Alloy Materials (Cr-Mo, Inconel)+20–35%For strength, oxidation resistance at >500°C.
Welding & QA Procedures+10–20%Full RT/UT, hydrostatic tests, ASME stamps.
Drum Diameter & Wall Stress+15%Larger pressure drum requires stronger shell.
Heat Transfer Area+10–25%Increased steam generation needs more tubes and surface area.
Safety Valves & Controls+5–10%Higher pressure requires certified components.

In high-pressure designs, the boiler drum alone can account for 20–30% of total equipment cost, especially when using alloy steels like SA-387 Grade 11/22 or T91/T92.


5. Example: Cost Scaling for 10–100 t/h Boilers

Capacity (t/h)Pressure (MPa)Efficiency (%)Estimated Equipment Cost (USD)Total Installed Cost (USD)
101.688$180,000$350,000
253.990$450,000$800,000
506.492$1,000,000$1,850,000
759.893$1,850,000$3,200,000
10013.094$2,700,000$4,900,000

As seen above, efficiency gains at higher pressure levels (due to higher steam enthalpy) are partly offset by the rapidly rising capital cost. Optimal design requires balancing thermal efficiency with financial feasibility.


6. Economic Evaluation: Finding the Optimum Pressure

Excel Formula for Levelized Cost of Steam (LCOS):
LCOS ($/t) = (Capital_Cost × CRF + O&M_Cost + Fuel_Cost × (1 - η_boiler)) / Steam_Production

Where:

  • CRF = Capital recovery factor = i(1+i)^n / ((1+i)^n – 1)

  • η_boiler = Boiler efficiency

  • Steam_Production = Annual steam output (tons/year)

By applying this to different design pressures, engineers can determine where total lifecycle cost (fuel + capital + O&M) reaches a minimum—typically between 6–10 MPa for industrial power boilers.


7. Real Case Comparison

A petrochemical plant compared two boiler designs for a 50 t/h system:

ParameterMedium PressureHigh Pressure
Design Pressure4.0 MPa9.8 MPa
Efficiency90%93%
Equipment Cost$950,000$1,650,000
Fuel Savings$70,000/year
Payback Period~10.0 years

Although the high-pressure unit was more efficient, the higher capital cost led to longer payback, making the 4.0 MPa design more economical for process steam applications.


8. Summary Table – Key Relationships

FactorEffect on CostReason
Higher CapacityExponential increaseLarger heat transfer area, thicker structure
Higher PressureExponential increaseStronger alloys, more QA/QC
EfficiencySlightly increasesImproved heat transfer surfaces
Safety StandardsIncreasesMore certification and inspection steps
Installation & AuxiliariesScales with sizeHeavier cranes, larger pumps, more complex piping

9. Conclusion

Boiler capacity and steam pressure are fundamental cost drivers that scale non-linearly with design complexity. Increasing either variable not only raises material and fabrication expenses but also amplifies the demands on auxiliaries, control systems, and compliance testing. The best investment strategy balances thermal efficiency gains with capital affordability through a detailed techno-economic analysis.

Why Does Fuel Type (Coal, Gas, Biomass, Oil) Have a Major Impact on Boiler Price?

In industrial boiler projects, fuel type selection is one of the most decisive factors influencing total cost. Choosing between coal, gas, biomass, or oil determines not only the initial purchase price but also lifetime operating expenses, maintenance requirements, and environmental compliance costs. The reason is that every fuel type demands distinct combustion technology, materials, and auxiliary systems to ensure safe, efficient, and clean operation.


In summary, fuel type affects boiler cost because it defines the entire combustion system design, material selection, emission control setup, and long-term operating costs. Cleaner fuels like natural gas reduce capital cost and maintenance, while solid fuels like coal and biomass require more complex systems and higher investment.


Every industrial operator must therefore analyze fuel availability, price stability, emissions compliance, and maintenance capacity before finalizing a boiler fuel type—because these choices impact both CAPEX and OPEX over the entire service life.


Fuel type has only a small effect on the price of an industrial boiler.False

Fuel type directly determines furnace design, emission systems, and maintenance needs—making it one of the strongest cost drivers.


1. Combustion System Complexity

Each fuel type requires different combustion and heat-exchange arrangements, which directly changes the design cost.

Fuel TypeCombustion TechnologySystem ComplexityRelative Equipment Cost Impact
CoalPulverized coal or fluidized bedVery High+60–80%
BiomassMoving grate or fluidized bedHigh+40–70%
OilAtomizing burnerMedium+20–40%
Natural GasPremix/modulating burnerLow+10–25%

Coal and biomass boilers require large furnaces, ash removal, and refractory linings, while gas boilers use simpler and cleaner systems—making them cheaper to install and maintain.


2. Material and Corrosion Resistance Requirements

The chemical composition of the fuel determines flue gas acidity, ash content, and temperature corrosion risk.

FuelCorrosion RiskRequired MaterialsEffect on Cost
CoalHigh (sulfur, ash)Alloy steel, refractory+25%
BiomassHigh (chlorides, alkalis)Anti-fouling coatings+20%
OilModerate (sulfur)Carbon steel + anti-corrosion layer+10%
GasLowStandard carbon steel0% baseline

Natural gas’s clean combustion allows use of low-cost carbon steel, while solid fuels need expensive corrosion-resistant alloys.


3. Emission Control and Compliance Costs

Each fuel type produces different pollutants—impacting the cost of emission control systems.

Fuel TypeMajor PollutantsRequired ControlsAdded Cost Range
CoalSO₂, NOₓ, PMESP/bag filter + scrubber + low-NOₓ burner+30–60%
BiomassDust, COMulticyclone + secondary air+20–40%
OilSO₂, NOₓLow-NOₓ burner + optional scrubber+10–25%
GasMainly NOₓLow-NOₓ or staged burner+5–10%

Solid fuels require flue gas desulfurization (FGD) and dust filtration, which increase both CAPEX and maintenance cost.


4. Fuel Handling and Storage Infrastructure

The physical state of the fuel dictates how it is transported, stored, and fed into the boiler.

Fuel TypeHandling SystemInfrastructure Cost Impact
CoalConveyors, crushers, silos, ash removal+20–30%
BiomassFeed screws, dryers, silos+15–25%
OilTanks, pumps, filters+10–15%
GasPipeline, regulators+5–10%

Gas-fired systems are the simplest—no solid handling or on-site storage—making them faster and cheaper to install.


5. Operating Cost and Efficiency Impact

Fuel TypeFuel Efficiency (%)Fuel Cost ($/GJ)O&M Cost ($/t steam)Relative Total Lifecycle Cost
Natural Gas92–988–142–4★ Lowest
Oil88–9412–183–5★★ Medium
Biomass80–904–96–10★★★ Medium-High
Coal78–883–68–12★★★★ Highest

Even though coal or biomass fuels are cheaper per GJ, their efficiency losses, ash disposal, and maintenance frequency make total costs higher in long-term operation.


6. Real-World Example: 20 t/h Industrial Boiler

Fuel TypeInstalled Cost (USD)Efficiency (%)Annual O&M ($)Emission Compliance Need
Coal1,500,000–2,200,00085200,000High
Biomass1,300,000–2,000,00088160,000Medium
Oil1,000,000–1,500,00090120,000Medium
Gas800,000–1,200,0009580,000Low

Conclusion

Fuel type determines furnace design, materials, emission systems, fuel logistics, and operational efficiency—making it the most powerful factor shaping boiler price and lifecycle economics.
When evaluating investment, consider not only CAPEX but also fuel supply reliability, regulatory environment, and total cost of ownership (TCO) over 15–25 years.

How Do Design Standards and Material Quality Influence Product Pricing?

In today’s highly competitive manufacturing landscape, customers and suppliers alike face a difficult balance between cost and quality. When design standards are low or materials are subpar, products often fail prematurely, leading to expensive replacements, downtime, and damaged brand reputation. Conversely, strict adherence to design standards and the use of high-quality materials increase initial costs but significantly enhance long-term value, performance, and customer trust. The solution lies in understanding how both design and material quality interact to shape pricing—allowing decision-makers to make investments that truly pay off over time.

Design standards and material quality are two of the most critical factors determining product pricing because they directly affect durability, performance, compliance, and production efficiency. High design standards demand precision engineering, testing, and certification—raising development costs but ensuring reliability and safety. Similarly, using superior materials increases raw material expenses but reduces lifecycle costs, warranty claims, and maintenance. Therefore, pricing reflects not just production costs but the embedded value of compliance, longevity, and performance that customers ultimately receive.

Understanding this relationship helps buyers and manufacturers align expectations. Customers often assume that higher prices simply mean higher margins, but in practice, most of the price differential is due to compliance with engineering standards, certifications, and material grade specifications. The following sections explain how each component—design standards and material quality—affects pricing structure, manufacturing complexity, and end-user satisfaction.

Higher design standards always lead to excessive product pricing.False

While advanced standards can increase initial costs, they often reduce lifecycle expenses and improve reliability, making overall ownership more economical.


Low-quality materials can reduce prices without major performance loss.False

Inferior materials may lower upfront costs but often result in reduced lifespan, higher maintenance, and non-compliance penalties.

The Interrelationship Between Design Standards and Cost Formation

Design standards dictate the engineering precision, safety parameters, and compliance frameworks a product must satisfy. For instance, international standards such as ISO 9001, ASTM, or EN define how dimensions, tolerances, and load-bearing requirements should be achieved. Meeting these benchmarks requires additional R&D investment, skilled labor, and specialized equipment. Manufacturers adopting these standards cannot rely on shortcuts, as deviations might lead to rejections or failure in certification testing. In cost analysis, about 20–35% of a product’s total price can be attributed to compliance and quality assurance activities tied to these standards.

Design FactorCost Impact (%)Description
Certification & Compliance10–15%Includes testing, documentation, and audits
Engineering Design Optimization5–10%Covers CAD development, simulations, and prototyping
Standardized Component Integration3–5%Ensures interoperability and interchangeability
Quality Control & Inspections2–5%Reduces defects, enhances performance reliability

When a manufacturer aligns production with rigorous standards, it ensures global compatibility, ease of export, and reduced risk in installation or operation. For example, a piping manufacturer using ISO 4427 for HDPE pipes can guarantee consistent wall thickness and pressure ratings, eliminating the risk of leaks and failures that could cause extensive damage. Thus, while the price per unit may be higher, the total cost of ownership (TCO) remains substantially lower.

Material Quality: The Core of Value-Based Pricing

Material selection often represents 50–70% of total production cost, making it the largest determinant of pricing. However, not all materials are equal—even within the same class. A grade-316 stainless steel product costs more than grade-304, yet its corrosion resistance in marine environments dramatically increases lifespan, thereby reducing total maintenance. Similarly, polymer-based materials with UV stabilization, flame retardancy, or chemical resistance command higher prices because they ensure reliability under harsh operational conditions.

Material TypeCost Multiplier vs. Standard GradeExpected Lifespan Increase (%)Example Use Case
High-Grade Alloy Steel1.8x60–80%Structural components in heavy industries
UV-Resistant Polyethylene1.5x50–70%Outdoor piping systems
Reinforced Composites2.3x100–150%Aerospace and high-stress parts
Food-Grade Stainless Steel1.7x40–60%Food processing and medical equipment

The implication is clear: while material quality raises the cost per kilogram, it simultaneously improves performance, safety, and product life cycle. High-quality inputs also reduce hidden costs such as rework, warranty claims, and customer dissatisfaction.

Hidden Costs of Poor Standards and Materials

A significant yet often overlooked factor is the “hidden cost” of neglecting standards or material integrity. Poor design decisions can lead to field failures, recalls, or legal liabilities due to non-compliance. For example, the use of substandard insulation materials in electrical systems might initially save 15% in costs but could result in safety hazards or fire risks, leading to catastrophic losses. Thus, manufacturers aiming to build a strong brand reputation view quality investments as strategic capital rather than avoidable expenses.

Case Study: Industrial Pump Manufacturing

An industrial pump manufacturer compared two production batches—one following API 610 standards and using AISI 316 steel, and the other following internal specifications with lower-grade carbon steel. The standard-compliant batch cost 27% more initially but showed a 55% longer mean time between failures (MTBF) and reduced maintenance downtime by 40%. Over five years, the standard-compliant model’s TCO was 23% lower, validating that the higher upfront investment yielded tangible long-term economic benefits.

Balancing Design Standards, Materials, and Market Position

Manufacturers must balance these factors strategically. Premium segments justify high material and design costs through enhanced branding, warranties, and performance assurance. However, for budget markets, optimization can be achieved through intelligent engineering rather than material downgrades—such as using finite element analysis (FEA) to reduce excess weight without sacrificing structural integrity.

Market SegmentTypical Design StandardMaterial GradePricing Strategy
BudgetLocal/BasicMediumVolume-driven
Mid-rangeRegional/ENHighValue-driven
PremiumISO/API/ASTMPremiumPerformance-driven

Conclusion

In essence, both design standards and material quality act as the foundation of responsible pricing. They are not merely cost factors but reflect the embedded reliability, performance, and trust a manufacturer offers. Customers should view higher prices not as a deterrent but as an indicator of a product built to meet long-term functional and safety expectations.

How Do Auxiliary Systems and Emission Controls Influence Boiler Cost?

Industrial and commercial boilers represent one of the most capital-intensive investments in energy and process industries. Yet, many decision-makers focus solely on the boiler’s rated capacity or efficiency while underestimating the substantial cost contributions from auxiliary systems and emission controls. When auxiliary systems—such as feedwater treatment, combustion air fans, and condensate recovery—are inadequately designed or emission controls are neglected, the results are severe: higher fuel consumption, environmental non-compliance, operational downtime, and potential legal penalties. The solution lies in understanding how these subsystems interact with the boiler core to influence both upfront capital expenditure (CAPEX) and total operating cost (OPEX).

Auxiliary systems and emission controls significantly influence boiler cost because they determine the system’s efficiency, environmental compliance, and reliability. Auxiliary systems (like pumps, blowers, water treatment units, and fuel handling equipment) can represent 25–40% of total installation costs, while emission control systems (such as scrubbers, electrostatic precipitators, and NOx reduction units) can add another 15–30%, depending on fuel type and emission limits. Together, they form the backbone of sustainable and regulatory-compliant boiler operation, directly impacting lifecycle cost, energy efficiency, and environmental footprint.

Recognizing these cost components allows project planners, plant managers, and procurement teams to make informed investment decisions. The following sections break down how auxiliary systems and emission controls contribute to both initial and operational costs, and how optimized integration can yield long-term financial and ecological benefits.

Emission control systems are optional add-ons that do not significantly affect boiler performance.False

Emission controls are mandatory in most regions and directly affect boiler efficiency, fuel optimization, and regulatory compliance.


Auxiliary systems are minor accessories with minimal impact on boiler cost.False

Auxiliary systems can account for up to 40% of total system cost and are essential for safe, efficient, and continuous boiler operation.

Understanding the Role of Auxiliary Systems in Boiler Economics

Auxiliary systems are integral subsystems that support the main boiler unit, ensuring continuous, safe, and efficient operation. These include fuel handling, feedwater preparation, draft systems, blowdown control, ash removal, and condensate recovery. Each of these components adds cost but also value—by improving performance, reducing waste, and extending equipment life.

Auxiliary ComponentFunctionTypical Cost Share (%)Impact on Efficiency (%)
Feedwater Treatment UnitRemoves hardness and oxygen to prevent scaling/corrosion8–12+3–5
Combustion Air Fan & BlowerMaintains proper air-fuel ratio4–6+2–3
Condensate Recovery SystemRecovers heat and water from steam return5–8+5–10
Economizer & Heat ExchangersReuse flue gas heat for preheating10–15+10–12
Fuel Handling & StorageEnsures consistent fuel supply3–6+1–2

A well-integrated auxiliary system may increase initial investment by 20–25% but typically reduces fuel consumption by 10–15% annually. For a 10-ton/hr steam boiler operating 6,000 hours per year, this can translate to fuel savings exceeding $40,000 annually, easily justifying the upfront cost.

The Economic Impact of Emission Control Systems

Modern environmental regulations (such as the EU’s Industrial Emissions Directive, U.S. EPA Clean Air Act, or India’s CPCB norms) enforce stringent emission limits on NOx, SOx, CO₂, and particulate matter. To comply, boilers must integrate emission control systems like flue gas desulfurization (FGD) units, electrostatic precipitators (ESP), selective catalytic reduction (SCR) systems, or bag filters.

Emission Control SystemApplicationCost Range (USD/kWth)Efficiency of Pollutant Removal (%)
Electrostatic Precipitator (ESP)Coal & biomass boilers10–1595–99
Bag Filter SystemBiomass, oil-fired boilers8–1290–98
Flue Gas Desulfurization (FGD)Sulfur-rich coal/oil boilers15–3085–95
Selective Catalytic Reduction (SCR)High-NOx gas/coal systems12–2570–95
Low-NOx BurnersGas/oil-fired boilers5–1040–60

Emission control systems not only determine compliance but also influence long-term operating costs due to their energy consumption, maintenance, and reagent use. For instance, SCR systems require ammonia or urea injection, adding recurring consumable costs but reducing NOx emissions drastically, ensuring compliance with Tier 4 standards.

Cost Synergy: Balancing Efficiency and Compliance

Integrating auxiliary systems with emission controls offers synergistic benefits. For example, improved combustion control (via O₂ sensors and VFD-driven air fans) reduces excess air, which simultaneously enhances efficiency and lowers NOx formation—reducing the burden on downstream emission control units. Similarly, installing economizers before the FGD system lowers flue gas temperatures, optimizing desulfurization efficiency.

Example of System Integration Benefits

System UpgradeAdditional CAPEX (%)Annual OPEX Savings (%)Payback Period (Years)
Condensate Recovery + Economizer+18-122.5
VFD Air Fan + Low-NOx Burner+10-83
SCR + Optimized Combustion Tuning+25-153.5

These integrated strategies result in shorter payback periods, enhanced efficiency, and long-term emission compliance—demonstrating that higher upfront cost leads to operational resilience and sustainability.

Case Study: 20 TPH Biomass Boiler with Advanced Controls

A 20-ton-per-hour biomass-fired boiler installed in Southeast Asia adopted full auxiliary and emission control integration. The project included a multi-cyclone dust collector, bag filter, economizer, and a condensate recovery system. Compared to a conventional setup, CAPEX increased by 32%, but fuel savings exceeded 18% annually, and particulate emissions were reduced from 120 mg/Nm³ to below 40 mg/Nm³—surpassing environmental compliance requirements. The investment achieved payback in less than three years, with additional savings from reduced water and chemical usage.

Long-Term Financial Perspective: CAPEX vs. OPEX Analysis

ParameterConventional BoilerBoiler with Advanced Auxiliaries & Emission Controls
Initial CAPEX100%140%
Annual Fuel Cost100%85%
Maintenance Cost100%90%
Compliance Cost (penalties, permits)100%60%
10-Year Total Cost of Ownership (TCO)100%92%

This comparison illustrates that although integrated systems raise initial expenditure, they substantially reduce operational and compliance costs, lowering the total cost of ownership (TCO) over time.

Technological Advances Shaping Future Costs

Emerging technologies such as AI-based combustion control, IoT-enabled predictive maintenance, and hybrid emission systems are further transforming boiler economics. Smart sensors can optimize auxiliary operations in real time, reducing excess air and unburned fuel losses, while predictive analytics can anticipate filter clogging or scaling issues—preventing costly downtime.

Conclusion

Auxiliary systems and emission controls are not mere add-ons but critical value components that determine a boiler’s efficiency, compliance, and lifetime cost profile. Investing in these systems ensures higher operational safety, lower fuel bills, and environmental stewardship—attributes increasingly demanded by regulators and clients alike.

How Do Installation Location, Logistics, and Site Conditions Affect Total Investment?

When planning an industrial or commercial project—whether it’s a power plant, manufacturing line, or boiler system—many investors focus on the core equipment cost. However, the real financial challenge often emerges during installation. Factors such as installation location, logistics complexity, and site conditions can drastically influence total investment. A project located in a remote or high-altitude region, with poor infrastructure or limited skilled labor, can see its cost rise by 20–50% compared to identical systems installed under ideal conditions. If these variables are not evaluated early, companies risk cost overruns, extended commissioning timelines, and operational inefficiencies. The solution lies in strategic planning—analyzing every logistical and environmental constraint to optimize resource deployment and minimize unforeseen expenses.

Installation location, logistics, and site conditions collectively have a profound impact on total project investment because they determine the accessibility, labor cost, equipment transport, and installation complexity. Remote or challenging sites often increase transportation and foundation costs, require specialized lifting and handling equipment, and extend construction schedules. Favorable site conditions and proximity to infrastructure, on the other hand, can reduce capital expenditure (CAPEX) and speed up return on investment (ROI). Therefore, evaluating these factors during the feasibility stage is critical to accurate cost forecasting and project success.

Investors and project planners must view these elements as dynamic cost multipliers rather than fixed variables. The following analysis explores the underlying mechanisms through which geography, logistics, and site-specific factors shape both direct and indirect investment outcomes in industrial installations.

The cost of industrial installation is mainly determined by equipment price, with minimal influence from site conditions.False

Site conditions, logistics, and geographical constraints can contribute 30–50% of total investment variation, often exceeding equipment cost fluctuations.


Projects in urban areas are always cheaper to install.False

While urban sites offer infrastructure advantages, higher land prices, labor costs, and regulatory requirements can offset logistical savings.

Geographic Location and Its Impact on Cost Structure

Location dictates a multitude of financial factors—labor availability, transportation routes, utility access, environmental regulations, and local taxation. A project in a remote industrial zone faces different challenges from one in a well-developed urban area.

Location FactorImpact on InvestmentTypical Cost Variation (%)Description
Distance from Supplier/Port+5–20Higher freight and handling costs due to distance 
Local Labor Availability±10–15Skilled labor shortages increase costs via training or outsourcing 
Altitude and Climate+5–12Requires specialized design and insulation for thermal stability 
Local Taxation/Import Duties±5–10Regional regulations can significantly alter total investment 
Infrastructure Accessibility±10–25Affects heavy equipment delivery, crane setup, and material storage 

In remote or mountainous regions, equipment must often be transported via narrow roads or non-standard routes, requiring escort vehicles or modularized transport. This complexity increases freight insurance and crane rental costs, directly inflating CAPEX.

Logistics: The Hidden Cost Driver

The logistical phase includes transportation, storage, and site handling of heavy and sensitive components. Poor logistics planning can lead to idle labor, damage to equipment, and project delays. For large systems like industrial boilers or turbines, logistics can represent up to 20–30% of total project cost, especially if multimodal transport (truck + ship + rail) is required.

Logistics ElementCost Impact (%)Risk LevelMitigation Strategy
Heavy Load Transport10–20HighRoute surveys, modular transport frames
Storage and Handling3–7MediumCovered storage and humidity control
Crane and Rigging5–10HighPre-planned lift sequencing
Customs and Border Handling2–6MediumLocal agent coordination
Onsite Movement and Assembly4–8MediumPreassembled modular sections

Advanced logistical modeling (such as using 3D route simulations and digital twin planning) can reduce inefficiencies and prevent unexpected disruptions. For instance, preassembling components at the factory before shipping can reduce installation time on-site by up to 25%, saving labor and equipment rental costs.

Site Conditions: Foundation, Utilities, and Terrain

The physical characteristics of the installation site profoundly influence engineering requirements and overall investment. Soil strength, slope, groundwater levels, and available utilities (power, water, drainage) all determine how complex and costly the installation will be.

Site ConditionTypical Cost Increase (%)Explanation
Weak Soil Requiring Deep Foundation10–20Pile or raft foundations needed
Uneven Terrain or Limited Space5–15Requires excavation or retaining walls
Lack of Power/Water Infrastructure5–12Temporary supply and pumps required
High Groundwater Table8–15Demands waterproofing and dewatering systems
Extreme Temperature or Corrosion Zones10–18Needs protective coatings or special materials

A real-world case involves a thermal power plant constructed in a coastal area where high salinity required marine-grade stainless steel structures and enhanced corrosion protection—raising material costs by 18% but preventing severe degradation over the system’s 25-year life.

Comparative Analysis: Ideal vs. Challenging Site Scenario

ParameterIdeal Industrial ParkRemote Mountain Site
Equipment Freight CostBase (100%)+40%
Labor CostBase (100%)+25%
Construction Duration10 months14–16 months
Utility SetupMinimalComplex (temporary systems required)
Overall CAPEX100%135–160%
ROI Period3.5 years5 years

This comparison demonstrates how the same equipment and engineering design can experience up to 60% cost escalation purely due to logistical and environmental challenges.

Case Study: 15 MW Biomass Power Plant – Impact of Site Conditions

A biomass power project located in a rural province faced difficult terrain, poor road access, and lack of utilities. The logistics of moving heavy boiler modules and turbine casings through 60 km of unpaved road increased freight costs by 28%. Soil instability required 8-meter-deep piling, raising civil costs by 15%. Despite higher initial CAPEX, the project implemented modular fabrication and phased installation—reducing total construction time from an estimated 18 months to 14 months, ultimately offsetting 10% of the cost escalation.

Technological Mitigation Strategies

Modern tools and practices can help control these costs:

  • 3D Site Modeling & BIM (Building Information Modeling): Enables virtual assessment of site terrain, logistics, and layout before mobilization.

  • Prefabrication and Modular Construction: Reduces on-site labor requirements and minimizes environmental disruption.

  • IoT-Based Equipment Tracking: Monitors transport and installation progress in real time to prevent costly delays.

  • Hybrid Foundation Systems: Combining shallow and deep foundations to reduce excavation costs in semi-weak soil.

Environmental and Regulatory Implications

In addition to physical and logistical challenges, installation location determines the scope of environmental compliance and permitting costs. Sites near rivers or ecologically sensitive areas may require additional environmental impact assessments (EIA), emission monitoring systems, or effluent treatment units. Each of these adds layers of CAPEX and OPEX but ensures long-term sustainability and legal protection.

Regulatory FactorCost Influence (%)Description
Environmental Clearance+3–5Permitting, EIA reports, consultant fees
Safety and Zoning Compliance+2–4Additional equipment spacing and access roads
Local Government Levies±3–6Regional environmental and construction taxes

Long-Term ROI Perspective

The location and site characteristics not only affect installation costs but also influence operating expenses and maintenance. For instance, remote sites often face higher spare part transportation costs and slower maintenance response times, while urban sites incur higher land taxes and stricter operational regulations. Therefore, optimal location selection is about balancing upfront CAPEX with future OPEX.

Cost TypeUrban Industrial ZoneRemote Industrial Zone
Initial CAPEXModerateHigh
Operating CostHigher (utilities, taxes)Moderate
Maintenance & LogisticsEasier AccessDelayed Response
Long-Term ROIStableSlower Payback

Conclusion

Installation location, logistics, and site conditions are among the most influential yet underestimated factors in determining total investment. A technically identical system can vary by millions of dollars in cost purely based on environmental, logistical, and geographical circumstances. Thorough pre-feasibility assessments, route studies, and site optimization can dramatically reduce risk and financial exposure.

What Is the Difference Between Capital Cost and Lifecycle (O&M) Cost for a Power Plant Boiler?

When planning to invest in a power plant boiler—whether for coal, biomass, or gas-fired operations—many stakeholders initially focus on the capital cost (CAPEX). However, the true economic performance of a boiler extends far beyond its purchase and installation price. Lifecycle cost (O&M cost), encompassing operation, maintenance, and fuel expenditure, often surpasses the initial investment several times over during the system’s lifespan. Ignoring lifecycle costs during planning can lead to underperforming assets, excessive fuel consumption, and unplanned shutdowns that erode profitability. The optimal solution is to understand and evaluate both cost categories—CAPEX and O&M—as integrated financial components of total cost of ownership (TCO).

The key difference between capital cost and lifecycle (O&M) cost in a power plant boiler lies in their timing, composition, and financial impact. Capital cost represents the one-time investment required to purchase, transport, and install the boiler system, typically accounting for 25–35% of total lifecycle expenditure. Lifecycle or O&M cost includes all ongoing expenses—fuel, labor, water treatment, spare parts, and maintenance—incurred throughout the boiler’s operational life, accounting for 65–75% of total expenditure. While CAPEX defines the project’s entry cost, O&M determines long-term profitability and operational sustainability.

Understanding this distinction is vital for decision-makers aiming to optimize return on investment (ROI), select appropriate technology, and develop accurate financial models. The following sections provide a detailed breakdown of both cost components, industry benchmarks, and practical strategies for balancing upfront investment with operational efficiency.

Capital cost is the main financial burden of a power plant boiler, while O&M costs are negligible.False

In most cases, O&M costs over 20–25 years exceed capital investment by three to five times due to fuel, labor, and maintenance expenses.


Reducing initial CAPEX always lowers total cost of ownership.False

Low CAPEX systems often use less efficient designs or materials, increasing fuel consumption and maintenance costs, thereby raising lifecycle cost.


Capital Cost (CAPEX): The Initial Investment Framework

Capital cost refers to all expenditures necessary to purchase, fabricate, transport, install, and commission the boiler and its auxiliary systems before it becomes operational. These costs are typically recorded at the project’s start and amortized over time. CAPEX depends heavily on technology type, design standards, fuel system, emission control requirements, and site complexity.

Capital Cost ComponentTypical Share (%)Description
Boiler Pressure Vessel & Heat Exchangers25–35Core boiler fabrication, tubes, drums, and economizers
Combustion & Fuel Handling Systems10–20Burners, conveyors, pulverizers, and storage
Auxiliary Systems15–25Feedwater, air fans, blowers, condensate recovery
Emission Control Units10–20ESP, FGD, bag filters, or SCR systems
Installation, Civil, and Commissioning15–25Foundations, cranes, electrical, instrumentation
Engineering, Design, and Permitting5–10Consulting, drawings, and local compliance

For example, a 100 MW coal-fired boiler might have a total CAPEX of USD 150–180 million, while a similarly rated gas-fired unit could range between USD 80–120 million due to simpler combustion and emission systems. The technology choice (subcritical vs. supercritical) also significantly affects CAPEX because of material grade, design complexity, and pressure ratings.


Lifecycle Cost (O&M): The Long-Term Economic Reality

Lifecycle cost, often referred to as Operating and Maintenance (O&M) cost, covers the recurring expenses over the boiler’s operational lifespan—typically 20–30 years. It includes both variable costs (fuel, water, chemicals) and fixed costs (labor, insurance, depreciation).

O&M Cost ComponentTypical Share of Annual OPEX (%)Notes
Fuel Cost65–85Dominant cost component, varies by fuel type
Operation Labor5–10Skilled operators and control room personnel
Maintenance & Spare Parts5–10Preventive maintenance, refractory, tubes, gaskets
Water Treatment & Chemicals2–5Feedwater quality maintenance and corrosion prevention
Ash/Sludge Disposal2–4Applicable to solid-fuel systems
Environmental Compliance2–4Emission monitoring, waste handling
Insurance & Overheads1–3Administrative and plant safety coverage

For instance, a 100 MW coal-fired unit operating at 80% capacity factor consumes approximately 50,000–55,000 tons of coal annually. Even minor efficiency deviations (e.g., 1% loss in thermal efficiency) can result in fuel cost increases of USD 500,000–1,000,000 per year, illustrating how lifecycle performance outweighs CAPEX in financial importance.


Comparative Overview: CAPEX vs. O&M Over 25 Years

Cost ElementShare of Total TCO (%)Description
CAPEX (Initial Investment)25–35One-time purchase, installation, and commissioning
O&M Cost (Fuel + Labor + Maintenance)65–75Recurrent costs throughout operation
Total Cost of Ownership (TCO)100Combined economic footprint across lifecycle

In simpler terms, while CAPEX defines the project’s entry barrier, O&M defines its profitability curve. A low-cost boiler with poor efficiency or high maintenance frequency may have an attractive upfront price but will cost significantly more to operate over time.


Example Case Study: 50 MW Biomass Boiler Plant

ParameterValueObservation
CAPEXUSD 55 millionIncludes boiler, fuel system, emission controls
Annual O&MUSD 5.5 millionMainly biomass feedstock and labor
Expected Life25 years
Total O&M (25 years)USD 137.5 million2.5× CAPEX
Efficiency Improvement (from 78% to 82%)Saves USD 400,000/yearFuel saving offsets 7% of CAPEX over lifecycle

This case illustrates that operational efficiency improvements and predictive maintenance programs yield substantial financial advantages over time, even when CAPEX is slightly higher.


Key Technical Factors Influencing CAPEX and O&M

Technical FactorCAPEX ImpactO&M ImpactExplanation
Boiler Design Pressure & EfficiencyHigher design efficiency increases CAPEX but reduces fuel use
Material QualityCorrosion-resistant alloys reduce tube replacements
Automation & ControlsSmart control systems lower labor and maintenance
Fuel Type (Coal, Gas, Biomass)VariableMajorDetermines combustion system complexity and O&M intensity
Emission Control LevelModerateAdds CAPEX but prevents penalties and downtime
Site AccessibilityModerateAffects logistics and maintenance availability

Lifecycle Optimization Strategies

  1. Invest in Higher-Efficiency Boilers:
    Supercritical and ultra-supercritical designs, while costlier, yield 5–10% fuel savings annually.

  2. Adopt Predictive Maintenance (IoT-based):
    Condition-based monitoring minimizes unplanned shutdowns and reduces maintenance costs by up to 20%.

  3. Enhance Water and Thermal Recovery Systems:
    Implementing economizers and condensate recovery reduces O&M costs by lowering water and chemical usage.

  4. Fuel Flexibility Design:
    Multi-fuel boilers accommodate biomass or gas co-firing, improving economic adaptability to fuel price fluctuations.

  5. Optimize O&M Contracts:
    Outsourced O&M with performance-based KPIs ensures consistent efficiency and minimizes hidden operational costs.


Illustrative Financial Comparison: Low vs. High-Efficiency Design

ScenarioCAPEX (USD million)Annual O&M (USD million)Efficiency (%)25-Year TCO (USD million)
Low-Efficiency Boiler809.578317.5
High-Efficiency Boiler958.085295.0

Although the high-efficiency boiler costs USD 15 million more initially, it saves USD 22.5 million in total lifecycle costs—demonstrating that higher CAPEX can yield lower TCO and faster ROI.


Visual Representation: CAPEX vs. O&M Cost Distribution

Lifecycle PhaseCost Ratio (%)Duration (Years)
Procurement & Installation25–350–2
Operation & Maintenance65–753–25
Decommissioning & Recovery<526+

This emphasizes that the majority of a boiler’s cost is realized during operation—not at purchase.


Conclusion

The difference between capital cost and lifecycle (O&M) cost is fundamental to power plant economics. Capital cost defines how much is spent to acquire and install the system, while lifecycle cost determines how efficiently and sustainably it operates. Smart investors and engineers evaluate both simultaneously, prioritizing total cost of ownership (TCO) over short-term savings. A slightly higher CAPEX with superior efficiency and reliability almost always results in lower overall expenditure and faster ROI.

🔍 Conclusion

The total price of a power plant boiler depends on technical specifications, fuel characteristics, and auxiliary equipment scope. A balanced approach — considering both capital and operational costs — ensures optimal performance, reliability, and return on investment over the boiler’s service life.


📞 Contact Us

💡 Planning a new power plant or boiler upgrade project? We offer customized design, EPC services, and cost optimization solutions for coal, gas, and biomass power plants.

🔹 Contact us today for an accurate power plant boiler cost assessment and professional project consultation. ⚡🔥🏭✅

FAQ

What determines the price of a power plant boiler?

The price of a power plant boiler depends on several major factors:

  • Boiler capacity and output – Larger units (e.g., 50–500 MW) require more materials, complex design, and higher manufacturing costs.

  • Fuel type – Gas-fired boilers tend to be more expensive upfront but cheaper to operate, while coal-fired units have lower capital costs but higher environmental control expenses.

  • Steam pressure and temperature – Supercritical and ultra-supercritical boilers cost more due to high-grade materials and precision engineering.

  • Auxiliary systems – Economizers, feedwater systems, air preheaters, and control systems add significant cost but improve efficiency.

  • Customization and standards – Seismic design, emissions compliance, or export certifications can increase pricing.


What is the average cost range for power plant boilers?

  • Small industrial power boilers (≤10 t/h): $50,000 – $200,000

  • Medium-sized utility boilers (10–100 t/h): $200,000 – $1 million

  • Large utility boilers (100–500 t/h): $1 – 5 million+

  • Supercritical and ultra-supercritical boilers can exceed $10 million depending on design and auxiliary equipment.


How do different fuel types affect total boiler cost?

  • Gas-fired boilers: Higher material and control costs, but lower installation and emission treatment costs.

  • Coal-fired boilers: Lower equipment cost but need dust removal, desulfurization, and denitrification systems.

  • Biomass boilers: Moderate cost, suitable for renewable energy projects with fuel availability.

  • Oil-fired boilers: Compact design, moderate cost, good for standby or high-efficiency use.


What are the additional costs beyond the boiler itself?

Total project investment includes:

  • Auxiliary equipment – burners, economizers, feedwater pumps, control panels.

  • Civil works – foundation, housing, and access infrastructure.

  • Transportation and installation – packing, freight, on-site assembly.

  • Commissioning and testing – system integration, performance tuning.

  • Operation and maintenance (O&M) – annual upkeep and spare parts.


How can buyers optimize cost and efficiency when purchasing a power plant boiler?

To achieve the best ROI:

  • Match boiler type to the fuel source and application.

  • Choose high-efficiency designs (supercritical, WHRB) to reduce lifetime fuel costs.

  • Request complete turnkey or EPC services to streamline logistics and installation.

  • Select reliable manufacturers with proven global projects to ensure quality and delivery.

  • Perform lifecycle cost analysis (LCCA) to balance capital and operational expenses.


References

  1. U.S. Department of Energy – Steam System Efficiencyhttps://www.energy.gov

  2. IEA – Power Plant Cost and Performance Datahttps://www.iea.org

  3. GE Steam Power – Utility Boiler Solutionshttps://www.ge.com

  4. Babcock & Wilcox – Power Boiler Systemshttps://www.babcock.com

  5. Thermax – Boiler Price Insightshttps://www.thermaxglobal.com

  6. Doosan Lentjes – Supercritical Boiler Projectshttps://www.doosanlentjes.com

  7. ScienceDirect – Economic Analysis of Power Boilershttps://www.sciencedirect.com

  8. ResearchGate – Boiler Cost Optimization Studyhttps://www.researchgate.net

  9. ASME – Boiler Construction Standardshttps://www.asme.org

  10. EnergySage – Industrial Boiler Efficiency Guidehttps://www.energysage.com

Wade Zhang

CEO of Taishan Group Taian Boao International Trade Co., Ltd. 30 years experience in Global industrial boiler market,  Over 300 boiler projects experience, including 21+ EPC projects. Projects span 30+ countries & regions, involving industries such as nuclear power, energy & electricity, municipal heating, mining, textiles, tires etc.

Power Plant Boiler Price Guide: Key Cost Factors Explained Read More »

What Is the Most Efficient Type of Industrial Boiler?

What Is the Most Efficient Type of Industrial Boiler?

In industrial operations, boiler efficiency determines how much of the fuel’s energy is converted into useful steam output. Low-efficiency systems waste significant energy as heat loss through flue gas or radiation, increasing fuel costs and carbon emissions. Choosing the right boiler type is crucial for achieving both economic and environmental performance.

The most efficient type of industrial boiler is the condensing gas-fired boiler or supercritical/ultra-supercritical water-tube boiler, depending on the application. Condensing boilers can achieve efficiency levels up to 98% by recovering latent heat from flue gases, making them ideal for medium and low-pressure systems. For high-capacity power and process plants, supercritical and ultra-supercritical water-tube boilers offer 90–94% efficiency due to advanced heat recovery, high operating pressures, and precise combustion control.

Selecting the most efficient boiler depends on fuel type, operating conditions, and steam requirements.

Why Does Boiler Efficiency Matter in Industrial Operations?

In every manufacturing or process industry—from food and beverage to chemicals, textiles, and power generation—boilers are the core energy producers that drive production. Yet, in many facilities, inefficiency in boiler operation remains an unseen drain on resources. Poor combustion control, heat losses, or inadequate maintenance can silently waste tens of thousands of dollars annually in fuel and lead to excessive emissions. For plant managers, understanding and improving boiler efficiency is not just about energy savings—it’s about competitiveness, reliability, and sustainability.

Boiler efficiency matters because it determines how effectively fuel energy is converted into useful steam or heat. Higher efficiency means lower fuel costs, reduced emissions, improved system reliability, and greater overall productivity in industrial operations. It is the single most critical indicator of a boiler’s economic and environmental performance.

Improving boiler efficiency only reduces fuel costs marginally.False

Even a 1% increase in boiler efficiency can save thousands of dollars annually, depending on fuel type and usage.


Boiler efficiency directly affects both production output and operating cost.True

Efficient steam generation ensures optimal process heating and reduces total energy expenditure.


1. The Economic Impact of Boiler Efficiency

Energy costs are typically 60–80% of total operating expenses in steam systems.
Every percentage point improvement in efficiency delivers measurable savings:

Boiler SizeFuel TypeAnnual Fuel Use (tons)Efficiency ImprovementFuel Savings (tons/year)Annual Cost Savings (USD)
10 t/hNatural Gas2,500+1%25$16,000
20 t/hFuel Oil5,000+2%100$68,000
30 t/hCoal12,000+3%360$72,000

A small efficiency gain translates into significant annual fuel savings, directly improving the plant’s profitability.


2. Thermodynamic Foundation: Efficiency Defined

Boiler efficiency (η) is defined as the ratio of useful heat output (steam energy) to total heat input (fuel energy).

Formula (simplified for Excel):
Boiler Efficiency (%) = (Steam Output × (h_steam – h_feedwater)) / (Fuel Input × Calorific Value) × 100

Where:

  • h_steam = Enthalpy of steam (kJ/kg)

  • h_feedwater = Enthalpy of feedwater (kJ/kg)

  • Calorific Value = Energy content of the fuel (kJ/kg or kJ/Nm³)

This equation reveals that both fuel quality and heat recovery play vital roles in achieving high efficiency.


3. Environmental Benefits of High Boiler Efficiency

Efficient boilers not only reduce fuel costs but also minimize environmental footprint:

ParameterInefficient Boiler (80%)High-Efficiency Boiler (92%)Reduction
CO₂ Emissions (kg/ton steam)25021713%
NOₓ Emissions (ppm)15010033%
SO₂ (from fuel oil)504020%
Fuel Use100%87%13%

Each efficiency upgrade directly supports ISO 50001 energy management and national carbon reduction programs.


4. Reliability and Process Performance

In industries such as food processing, paper manufacturing, or pharmaceuticals, steam quality and reliability are vital.
An efficient boiler provides:

  • Stable steam pressure and temperature, ensuring consistent product quality.

  • Reduced downtime, since efficient combustion minimizes fouling and scale formation.

  • Longer equipment lifespan, due to uniform heat distribution and controlled operation.


5. Technologies That Improve Boiler Efficiency

Efficiency FeatureFunctionEfficiency Gain (%)
EconomizerRecovers heat from flue gas to preheat feedwater3–5
Air PreheaterUses flue gas to warm combustion air2–3
Condensing Heat ExchangerCaptures latent heat from water vapor5–10
Advanced Burner ControlMaintains optimal air-fuel ratio1–2
Variable Speed Drives (Fans/Pumps)Reduces parasitic power losses0.5–1

When combined, these technologies can raise overall boiler efficiency to 90–95%, depending on system type.


6. Real-World Example

A 20 t/h gas-fired water-tube boiler in a textile mill operated at 82% efficiency.
After retrofitting with:

  • A condensing economizer

  • O₂ trim control

  • Automatic blowdown recovery

The boiler achieved 92.5% efficiency.
This resulted in annual fuel savings of $60,000 and CO₂ emission reduction of 120 tons, paying back the investment in less than 18 months.


7. Maintenance and Monitoring for Sustained Efficiency

Efficiency declines over time due to soot, scale, and control drift. Regular practices include:

  • Soot blowing and flue gas cleaning (maintains heat transfer).

  • Water treatment and blowdown control (prevents scaling).

  • Burner tuning and excess air control (optimizes combustion).

  • Real-time monitoring systems (detect deviations before efficiency loss occurs).

Plants equipped with digital boiler management systems (BMS) sustain higher efficiency and safer operation over the long term.


8. Summary

Boiler efficiency is the cornerstone of industrial productivity and sustainability. It directly determines fuel costs, emission levels, product consistency, and operational safety. Even marginal improvements lead to major gains across the lifecycle of a plant.
Investing in efficient combustion systems, waste heat recovery, and continuous monitoring is not an expense—it’s a strategic asset for long-term profitability.

How Do Condensing Gas-Fired Boilers Achieve Near 98% Efficiency?

In industrial and commercial heating, energy efficiency directly translates into fuel savings and emission reduction. Traditional boilers typically operate between 80–90% efficiency, meaning that up to 20% of the fuel’s energy is wasted through hot exhaust gases. The pain point for many plant operators lies in this lost potential—burning costly natural gas while venting valuable heat. The solution? Condensing gas-fired boilers, designed to capture and reuse the latent heat of water vapor in exhaust gases, pushing efficiencies to as high as 98% (LHV basis).

Condensing gas-fired boilers achieve near 98% efficiency by recovering the latent heat from water vapor in flue gases through condensation, utilizing advanced heat exchangers made of corrosion-resistant materials to maximize heat transfer and minimize energy loss. This process significantly reduces exhaust gas temperature and recovers otherwise wasted thermal energy.

Condensing boilers achieve efficiency by reheating exhaust gases.False

Condensing boilers recover latent heat by cooling exhaust gases below the dew point, condensing water vapor into liquid.


Condensing gas-fired boilers can reach efficiencies up to 98% (LHV).True

By condensing water vapor in the flue gas, these systems recover 10–12% additional heat compared to non-condensing boilers.


1. Principle of Condensing Operation

Natural gas combustion produces carbon dioxide (CO₂) and water vapor (H₂O) as primary byproducts. In a conventional boiler, the exhaust temperature (150–250 °C) keeps this vapor in gaseous form, and its latent heat of vaporization (around 2,260 kJ/kg) is lost.

A condensing boiler, however, cools flue gases below their dew point (typically 55°C), causing the water vapor to condense into liquid water. This condensation releases latent heat, which is recovered by the boiler’s secondary heat exchanger and transferred to the system’s return water.

ParameterConventional BoilerCondensing Boiler
Flue Gas Temperature180–250 °C40–60 °C
Water Vapor StateGaseous (lost)Condensed (recovered)
Efficiency (LHV)85–90%95–98%

2. Thermodynamic Efficiency Gains

The efficiency improvement comes from the energy recovered during condensation.

Simplified Excel Formula:
Boiler Efficiency (%) = (Useful Heat Output / Fuel Input) × 100

When flue gases are cooled below dew point:
Additional Efficiency Gain (%) ≈ (Mass of Water Vapor × Latent Heat) / (Fuel Energy Input) × 100

For natural gas (CH₄):

  • Each 1 kg of CH₄ produces ~2.25 kg of H₂O.

  • Latent heat recovery ≈ 10–12% of total energy.

Thus, condensing systems can achieve up to 108% efficiency on the lower heating value (LHV) basis, which translates to 98% efficiency on the higher heating value (HHV).


3. Engineering Design Features Enabling High Efficiency

ComponentFunctionBenefit
Stainless Steel or Aluminum Heat ExchangerResists acidic condensate corrosionLong service life
Large Heat Transfer Surface AreaMaximizes flue gas-to-water contactHigher heat recovery
Modulating BurnerAdjusts output to match demandReduced cycling losses
Low Return Water Temperature (<55°C)Promotes continuous condensationSustained high efficiency
Condensate Neutralization SystemTreats acidic condensate before drainageEnvironmental compliance

4. Impact of Return Water Temperature

For condensation to occur, the return water entering the heat exchanger must be cooler than the flue gas dew point.

Return Water Temp (°C)Condensing EffectApprox. Efficiency (%)
70None88
60Partial92
50Moderate95
40Strong98

In systems designed for low-temperature heating (e.g., underfloor heating, district heating, or preheated process water), condensing operation is nearly continuous, maximizing efficiency.


5. Combustion Control and Automation

Condensing boilers rely heavily on advanced control systems for peak performance:

  • O₂ trim control to maintain optimal air-fuel ratio.

  • Variable-speed fan modulation for stable combustion.

  • Continuous flue gas temperature and dew point monitoring.

  • Weather-compensated return temperature control to sustain condensation.

Automation ensures that boilers dynamically adjust to varying load conditions, maintaining condensation efficiency without operator intervention.


6. Example of Efficiency Gains in Practice

A 10 t/h natural gas-fired condensing boiler installed in a food processing facility replaced a conventional fire-tube boiler.

ParameterBeforeAfterImprovement
Efficiency86%97%+11%
Flue Temp210 °C48 °C↓162 °C
Annual Gas Use2.8 million Nm³2.5 million Nm³–300,000 Nm³
CO₂ Emissions5,400 t4,850 t–550 t

The payback period for the upgrade was less than 2 years, with lifetime fuel savings exceeding $250,000.


7. Emission and Environmental Advantages

  • Reduced CO₂ emissions: lower fuel use = less carbon output.

  • Lower NOₓ formation: cooler combustion and flue temperatures.

  • Condensate recovery potential: water vapor condensed into liquid can be treated and reused in closed systems.

Emission ParameterConventional BoilerCondensing BoilerReduction
CO₂ (kg/h)1,000890–11%
NOₓ (ppm)9060–33%
Stack Loss (%)10–152–5–70%

8. Maintenance and Design Considerations

To sustain 98% efficiency, attention must be paid to:

  • Regular condensate drain cleaning to avoid clogging.

  • Inspection of acid-resistant materials (SS304/316L, aluminum-silicon).

  • Calibration of sensors for dew point tracking.

  • Periodic flue gas analysis for combustion tuning.

These practices ensure longevity and maintain high heat transfer performance.


9. Summary

Condensing gas-fired boilers represent the pinnacle of combustion efficiency. By reclaiming latent heat from exhaust gases, they deliver nearly 98% efficiency with minimal emissions. Their success depends on proper design integration—low return water temperature, corrosion-resistant materials, and smart controls. In modern industrial or commercial plants, they are not just a trend but an essential component of energy optimization and carbon reduction strategies.

What Makes Supercritical and Ultra-Supercritical Water-Tube Boilers More Efficient?

In modern power generation, efficiency is not just a technical metric—it defines profitability, sustainability, and long-term competitiveness. Conventional subcritical coal-fired boilers, limited by thermodynamic boundaries, waste large amounts of heat energy through the condenser. Power plants striving for higher efficiency and lower emissions have therefore shifted toward supercritical (SC) and ultra-supercritical (USC) water-tube boilers. The pain point for plant investors is that older boiler technology caps efficiency around 35–38%, while fuel costs and carbon regulations continue to rise. The solution lies in raising steam temperature and pressure to extract more useful work from every unit of fuel.

Supercritical and ultra-supercritical water-tube boilers achieve higher efficiency by operating above the critical point of water (22.1 MPa, 374°C), eliminating phase change, improving thermodynamic cycle performance, and enabling higher turbine inlet temperatures that increase the overall Rankine cycle efficiency to 42–47%.

Supercritical boilers use both water and steam phases within the evaporator.False

Supercritical boilers operate above the critical point where water and steam become a single supercritical fluid, eliminating phase distinction.


Ultra-supercritical boilers reach efficiencies exceeding 45% in large-scale power plants.True

Higher steam temperatures (≥600°C) and advanced alloys enable ultra-supercritical units to achieve thermal efficiencies above 45%.


1. Thermodynamic Foundation: Why Higher Pressure and Temperature Matter

The Rankine cycle governs steam power generation efficiency. Its performance depends on how much of the fuel’s heat energy can be converted into mechanical work before being lost as waste heat.
As steam conditions approach and exceed the critical point (22.12 MPa, 374°C), the enthalpy difference between steam and condensate widens, improving the thermal efficiency of the cycle.

Boiler TypePressure (MPa)Steam Temp (°C)Cycle Efficiency (% LHV)
Subcritical16–1854035–38
Supercritical (SC)22–2556540–43
Ultra-supercritical (USC)25–30600–62044–47

The higher the steam temperature and pressure, the greater the expansion ratio across the turbine, and thus, the higher the mechanical output per unit of fuel burned.


2. Elimination of the Boiling Phase Transition

In subcritical boilers, water boils at a distinct saturation temperature, requiring large evaporator surfaces and drum separation. Supercritical and ultra-supercritical boilers operate beyond the critical point, where:

  • There is no phase boundary between liquid and vapor.

  • Water transitions into a supercritical fluid with properties of both.

  • The fluid absorbs and transfers heat more efficiently.

This eliminates the drum and natural circulation, replacing it with once-through flow—simplifying design, improving responsiveness, and reducing metal stress.

FeatureSubcriticalSupercritical/USC
Phase ChangeYes (boiling)No (supercritical fluid)
Drum PresenceRequiredEliminated
Circulation TypeNatural/forcedOnce-through
Heat TransferTwo-phaseSingle-phase (continuous)
EfficiencyLowerHigher

3. Advanced Materials Enable High-Temperature Operation

Raising steam temperatures introduces severe thermal stress and oxidation risks. To ensure durability and safety, USC boilers employ nickel-based superalloys, austenitic stainless steels, and ferritic–martensitic materials such as:

  • TP347HFG, Super304H for high-pressure tubes

  • P91, P92 steels for headers and superheaters

  • Inconel 617/625 for ultra-high-temperature regions

These alloys maintain structural integrity up to 650°C, enabling safe long-term operation under extreme pressures.

MaterialMax Operating Temp (°C)Typical Application
P91600Superheater/Headers
Super304H620Final Superheater
Inconel 617650USC Steam Path

4. Efficiency Gains in the Rankine Cycle

A simplified expression for cycle efficiency (η):
η = 1 – (T_cond / T_boiler)
where temperatures are in absolute scale (Kelvin).

By raising the average boiler temperature (T_boiler):

  • Subcritical (540°C → 813K): η ≈ 1 – (313/813) = 61.5% (theoretical).

  • Supercritical (600°C → 873K): η ≈ 1 – (313/873) = 64.2%.

After accounting for practical losses, the net plant efficiency rises by 5–9 percentage points, which can translate to hundreds of thousands of tons of fuel savings annually in large power stations.


5. Environmental and Economic Advantages

Higher efficiency means less fuel burned per MWh generated, directly reducing CO₂ and SO₂ emissions.

ParameterSubcriticalUSC BoilerReduction (%)
Fuel Use (kg coal/MWh)370310–16%
CO₂ Emission (kg/MWh)950800–16%
SO₂ (g/MWh)2,0001,650–17.5%
Efficiency (LHV)37%46%+24%

These savings compound annually, making USC plants not only cleaner but also financially more sustainable under carbon pricing schemes.


6. Boiler Design Innovations That Support Higher Efficiency

FeatureFunctionImpact on Efficiency
Once-Through Water FlowEliminates drum lossesReduces thermal inertia
Vertical Tube ArrangementEnhances heat transferUniform fluid distribution
Integrated Superheater/Reheater BanksMaintains optimal steam temperatureHigher turbine efficiency
Sliding Pressure OperationAdjusts pressure with loadImproved part-load efficiency
Flue Gas Recirculation (FGR)Controls NOₓ and temperatureEnvironmental compliance

7. Real-World Case: Ultra-Supercritical Power Plant

A 1,000 MW USC plant operating in East Asia achieved:

  • Main steam pressure: 25.0 MPa

  • Main steam temperature: 605°C

  • Reheat temperature: 620°C

  • Gross efficiency: 46.5%

  • Net CO₂ reduction: 1.2 million tons/year compared with subcritical units.

The plant also utilized high-efficiency regenerative feedwater heating and low-NOₓ burners, illustrating how USC systems integrate thermal and environmental performance.


8. Challenges and Maintenance Considerations

While efficiency gains are substantial, the technology introduces challenges:

  • Higher material cost (up to +15% CAPEX).

  • Strict water quality control to prevent corrosion.

  • Advanced welding and fabrication techniques required for exotic alloys.

  • Regular inspection for creep and fatigue due to extreme stresses.

Still, over the lifecycle, fuel savings and emission credits far outweigh the initial investment.


9. Future Outlook: Toward Advanced USC and A-USC

Research continues into Advanced Ultra-Supercritical (A-USC) technology, targeting 700°C steam using nickel-based alloys and closed-loop cooling. Such systems promise 50%+ thermal efficiency, pushing fossil generation closer to renewable competitiveness in both economics and carbon intensity.


10. Summary

Supercritical and ultra-supercritical water-tube boilers redefine thermal performance by operating above the water critical point, maximizing heat conversion, and minimizing losses. Their high-pressure, high-temperature design not only improves fuel utilization but also reduces environmental impact. They represent the pinnacle of boiler thermodynamics, setting the benchmark for all future large-scale thermal power systems.


How Do Fuel Type and Combustion Technology Affect Efficiency?

Industrial and power plant boilers are the heart of energy conversion—transforming chemical energy in fuel into usable steam or electricity. Yet, not all fuels or combustion methods are created equal. Plant owners often face the pain of rising fuel costs and tightening emission limits, while efficiency losses from poor fuel selection or mismatched combustion technology erode profitability. Choosing the right fuel type and combustion method is one of the most critical engineering and economic decisions, directly influencing thermal efficiency, emission performance, maintenance needs, and lifecycle cost.

Boiler efficiency is strongly affected by fuel type and combustion technology because each fuel’s composition, moisture, and heating value determine how completely it burns and how much waste heat can be recovered, while combustion system design (such as pulverized coal, fluidized bed, or staged gas burners) controls how effectively that fuel’s energy is converted into steam.

All fuels produce similar boiler efficiencies when burned under the same conditions.False

Fuel chemical composition, heating value, and moisture content cause significant efficiency differences among fuels.


Combustion technology design determines how completely fuel energy is utilized in a boiler.True

Optimized combustion systems reduce unburned carbon, improve heat transfer, and minimize flue losses, directly raising efficiency.


1. Fuel Characteristics That Influence Efficiency

Each fuel type—coal, oil, natural gas, or biomass—has unique thermochemical properties that determine combustion quality and efficiency.

Fuel TypeLower Heating Value (LHV, MJ/kg)Moisture (%)Ash (%)Typical Boiler Efficiency (%)
Natural Gas48–500092–98
Fuel Oil40–42<1<0.188–92
Bituminous Coal25–305–1010–1582–88
Lignite15–1830–405–1075–82
Biomass (Wood Chips)12–1620–501–370–85

Natural gas burns cleanly with nearly complete combustion, allowing for condensing heat recovery and the highest efficiencies. Coal and biomass, with higher ash and moisture, lose efficiency through incomplete combustion, radiation loss, and unburned carbon in ash.

Moisture content is particularly detrimental—it absorbs latent heat during evaporation, reducing useful steam output. For every 1% increase in fuel moisture, boiler efficiency can drop by up to 0.2–0.3%.


2. Combustion Technologies and Their Impact on Efficiency

Modern boilers use several combustion systems, each tailored to different fuels and applications:

Combustion TypeFuel CompatibilityOperating Temperature (°C)Efficiency Range (%)Features
Gas/Oil Burners (Diffusion or Premix)Gas, light/heavy oils900–1,20090–98Complete combustion, low unburned fuel, condensing potential
Pulverized Coal (PC)Bituminous, anthracite1,400–1,60085–90Fine particle combustion, high flame temperature
Circulating Fluidized Bed (CFB)Coal, biomass, waste800–90086–92Uniform temperature, low NOₓ, high fuel flexibility
Grate FiringBiomass, wood, waste750–90075–85Simple and robust, but lower combustion completeness
Gasification + Secondary CombustionBiomass, waste, low-grade fuels900–1,00088–92Cleaner combustion with staged air supply

3. Key Combustion Efficiency Factors

a. Air-Fuel Ratio (λ)

Excess air is necessary to complete combustion, but too much dilutes the flame and increases flue gas losses.
Optimal excess air levels:

  • Natural gas: 5–10%

  • Oil: 10–15%

  • Coal: 15–25%

  • Biomass: 25–35%

Maintaining ideal air control can boost efficiency by 2–4% compared to uncontrolled combustion.

b. Flue Gas Temperature

Every 20°C rise in flue gas temperature above optimum reduces efficiency by 1%. High exhaust temperature indicates unrecovered heat—solved by adding economizers or air preheaters.

c. Unburned Carbon Loss

Coal and biomass boilers may lose 1–3% efficiency through unburned fuel in fly ash or bottom ash. Proper particle size, air staging, and turbulence minimize these losses.


4. Comparative Efficiency Chart by Fuel and Combustion Type

Fuel & TechnologyEfficiency (%)CO₂ Emission (kg/MWh)Typical Application
Natural Gas (Condensing Burner)97200Industrial heating, CHP
Fuel Oil (Low-NOx Burner)90260Backup power, refineries
Pulverized Coal (PC)88340Utility-scale power plants
CFB (Coal/Biomass Mix)90310Industrial cogeneration
Biomass Grate Boiler800* (carbon-neutral)Small process plants

(*Biomass CO₂ considered biogenic, net-zero in lifecycle accounting.)


5. Case Study: Comparing Efficiency Across Fuels

A textile mill operating a 10 t/h steam boiler compared fuel options:

FuelBoiler TypeFuel Cost ($/GJ)Efficiency (%)Steam Cost ($/ton)
Natural GasCondensing Fire-Tube11.09628
Heavy OilWater-Tube10.09031
Bituminous CoalChain Grate4.58422
BiomassFluidized Bed3.88720

Although gas offers the highest efficiency, biomass and coal remain cost-effective for users with local availability and emission compliance systems.


6. Role of Advanced Combustion Controls

Modern systems integrate digital automation to sustain optimal conditions:

  • O₂ trim control for real-time excess air management.

  • Flame scanning sensors for complete combustion.

  • Load-following controls to maintain stable efficiency across variable demand.

  • Flue gas analyzers for continuous tuning.

Plants adopting smart combustion management achieve sustained fuel savings of 3–5% annually, while maintaining lower emissions and better reliability.


7. Efficiency Enhancement Through Fuel Pre-Treatment

Fuel Preparation StepEffect on Efficiency
Coal PulverizationImproves surface area and burnout
Biomass DryingReduces moisture losses
Oil PreheatingEnhances atomization and combustion
Gas Pressure RegulationStabilizes flame and air ratio

For biomass, drying from 40% to 20% moisture can increase boiler efficiency by 5–7%, justifying investment in waste-heat dryers or solar pre-drying systems.


8. Environmental and Operational Implications

High-efficiency combustion lowers emissions by reducing unburned carbon and CO₂ per MWh output. For every 1% gain in boiler efficiency, CO₂ emissions drop by approximately 1.5–2%.

Emission TypeReduced by Optimized CombustionBenefit
CO (Incomplete combustion)↓ up to 90%Safer, cleaner exhaust
NOₓ (Air staging, low-temp burn)↓ up to 50%Regulatory compliance
SO₂ (Fuel selection, desulfurization)↓ up to 95%Environmental protection

9. Summary

Fuel type defines the potential efficiency ceiling, while combustion technology determines how close the boiler can operate to that theoretical maximum. Natural gas and condensing systems deliver the highest efficiencies, while advanced CFB and staged combustion systems allow coal and biomass to approach similar performance with flexibility and emission control. Optimal selection and control of combustion technology can thus boost efficiency by 10–15%, reduce emissions, and extend boiler life.

What Role Does Heat Recovery Equipment (Economizers and Air Preheaters) Play in Efficiency Improvement?

In any steam-generating system, a significant portion of fuel energy is lost as hot flue gas. Instead of letting this energy escape through the stack, heat recovery equipment—mainly economizers and air preheaters—captures and reuses part of this waste heat to preheat feedwater or combustion air. This process can increase overall boiler efficiency by 5–10%, translating directly into lower fuel consumption and reduced emissions.

In simple terms:

Economizers and air preheaters improve efficiency by reclaiming waste heat from exhaust gases and using it to raise the temperature of boiler feedwater and combustion air, thus reducing the amount of fuel needed to generate steam.

Economizers and air preheaters reduce fuel use by recovering waste heat from flue gases.True

They preheat incoming feedwater and combustion air, lowering the required heat input for steam generation.


Flue gas heat recovery is only beneficial for small boilers.False

Heat recovery offers proportional savings across all boiler sizes, with greater absolute benefits in large industrial systems.


1. Economizers – Preheating Feedwater Using Flue Gas Heat

Function:
An economizer transfers heat from exhaust gases to the incoming feedwater before it enters the boiler drum or economizer section.

Key Benefits:

  • Improves efficiency by 3–7%.

  • Lowers fuel consumption by reducing the enthalpy difference needed to produce steam.

  • Reduces thermal stress on boiler tubes due to gradual water heating.

Typical Operation:

  • Flue gas outlet temperature: 300–400°C

  • Feedwater inlet temperature: 80–120°C

  • Economizer outlet water temperature: 150–220°C

Efficiency Gain Formula (Excel-Ready):
Efficiency gain (%) = (Cp_gas * (T_in - T_out) * (1 - η_existing)) / (Fuel_LHV * Boiler_Load)

Where:

  • Cp_gas = Specific heat of flue gas (~1.0 kJ/kg·K)

  • T_in - T_out = Flue gas temperature drop across the economizer

  • η_existing = Existing boiler efficiency (decimal)

Example:
A 10 t/h boiler with a 50°C reduction in flue gas temperature can achieve ~5% fuel savings annually.


2. Air Preheaters – Warming Combustion Air for Better Fuel Burn

Function:
An air preheater transfers heat from the outgoing flue gases to the incoming combustion air.

Key Benefits:

  • Enhances flame temperature, promoting more complete combustion.

  • Improves efficiency by 2–5%.

  • Reduces unburned carbon and CO emissions.

  • Lowers stack losses by utilizing residual flue heat.

Typical Configurations:

  • Recuperative type: Tubular or plate heat exchangers.

  • Regenerative type: Rotary heat wheels (common in large coal-fired units).

Example Calculation:
Raising combustion air from 25°C to 150°C can save 1.5–2.0% fuel per 50°C increase in air temperature.


3. Combined Effect of Economizers + Air Preheaters

When used together, these two systems deliver cumulative efficiency improvements of up to 10%.

ComponentFuel Saving (%)Temperature Recovery Range
Economizer3–780–220°C (water side)
Air Preheater2–525–150°C (air side)
Total (combined)5–10

This synergy is especially valuable in coal, biomass, and oil-fired boilers, where flue gas temperatures are high enough for substantial heat recovery.


4. Operational and Design Considerations

FactorImpact
Flue gas compositionAcidic gases (SO₂, moisture) can cause corrosion; stainless or enamel-coated tubes are recommended.
Condensation controlKeep metal temperatures above acid dew point (~120°C for coal, ~90°C for gas).
Soot and foulingRegular cleaning ensures sustained heat transfer efficiency.
Flow configurationCounter-flow designs yield higher temperature differentials and better performance.

5. Economic and Environmental Benefits

  • Reduced fuel costs: A 1% gain in efficiency cuts fuel consumption by ~1.5%.

  • Lower CO₂ emissions: For each 1% efficiency improvement, CO₂ output drops by ~1.8%.

  • Short payback period: Typically 6–18 months depending on fuel price.

Example:
A 20 t/h coal-fired boiler saving 5% fuel at $100/ton of coal reduces operating costs by ~$25,000–30,000 per year.


6. Summary

SystemPurposeEfficiency GainMain Advantage
EconomizerPreheats feedwater3–7%Less fuel required to generate steam
Air PreheaterHeats combustion air2–5%Improved combustion efficiency
Combined Effect5–10%Lower emissions, faster payback

Together, economizers and air preheaters form the foundation of modern boiler heat recovery design—simple, reliable, and highly effective measures for achieving substantial fuel savings and emission reductions.

How Can Automation and Control Systems Help Maintain Peak Boiler Efficiency?

In industrial boiler operation, even small deviations in air-fuel ratio, steam demand response, or flue gas temperature can cause significant efficiency losses and higher fuel bills. Many facilities face the pain of inefficient manual control, where inconsistent combustion or unoptimized load transitions lead to wasted energy and excessive emissions. The solution lies in modern automation and control systems, which continuously monitor, adjust, and optimize every process variable to sustain peak efficiency and reliable performance over time.

Automation and control systems maintain peak boiler efficiency by continuously monitoring key operating parameters (such as air-fuel ratio, flue gas temperature, pressure, and feedwater levels) and automatically adjusting combustion, feedwater, and load conditions to achieve optimal performance with minimal energy waste.

Automation systems simply record data without adjusting boiler operation.False

Modern control systems actively regulate combustion, water levels, and air-fuel ratios in real time to maintain efficiency.


Automated controls can improve boiler efficiency by 3–8% compared with manual operation.True

Precise modulation of burners, airflow, and load balance reduces excess air and minimizes energy losses.


1. Role of Automation in Boiler Efficiency

Automation provides real-time monitoring, feedback, and control over the combustion and steam generation process. Instead of manual intervention, smart systems ensure all components—burners, fans, pumps, and valves—operate in perfect synchronization for maximum thermal efficiency.

System FeatureFunctionEfficiency Impact
O₂ Trim ControlContinuously adjusts air supply to maintain optimal O₂ level in flue gasReduces excess air, saving 1–3% fuel
Load Modulation ControlMatches firing rate to steam demandMinimizes on/off cycling losses
Feedwater ControlMaintains proper drum level and preheats feedwaterPrevents carryover and thermal shock
Flue Gas Temperature MonitoringDetects fouling or heat loss issuesEnables timely maintenance
Combustion OptimizationCoordinates burner and airflow in real timeImproves overall efficiency 3–8%

2. Key Control Technologies for Peak Performance

a. O₂ Trim Control System

This system uses flue gas oxygen analyzers to automatically adjust combustion air flow. The optimal O₂ range depends on fuel type and boiler design.

Fuel TypeOptimal O₂ (%)Efficiency Gain (%)
Natural Gas2.0–3.02–4
Fuel Oil3.0–4.01–3
Coal4.0–6.02–5

By maintaining the correct oxygen level, the system minimizes excess air and reduces stack losses—each 1% reduction in excess air typically increases efficiency by 0.3–0.6%.


b. Variable Speed Drives (VSDs) and Modulating Burners

Traditional systems operate blowers and pumps at constant speeds. VSDs adjust motor speed according to real demand, cutting unnecessary power use.

Benefits:

  • 20–30% electrical energy savings.

  • Smoother load response.

  • Reduced mechanical wear on moving parts.

Example Excel Formula:
Power Saving (%) = (1 - (Actual Speed / Rated Speed)^3) × 100


c. Advanced Combustion Control (ACC) and Burner Management Systems (BMS)

These integrated systems continuously manage the air-fuel ratio, flame stability, and ignition sequence.

Functions include:

  • Dynamic fuel flow control based on steam load.

  • Continuous burner flame monitoring via UV/IR sensors.

  • Automatic purge and restart for safety.

  • Real-time efficiency tracking with heat balance algorithms.

A properly tuned ACC/BMS can raise boiler efficiency by 5–7% while improving safety compliance.


3. Smart Monitoring and Data Analytics

Digital monitoring systems equipped with IoT sensors and cloud connectivity track:

  • Flue gas O₂ and CO levels.

  • Feedwater temperature and conductivity.

  • Steam pressure and flow trends.

  • Heat exchanger temperature differential (ΔT).

Data analytics dashboards provide predictive insights—alerting operators to fouling, scaling, or inefficient firing conditions before they impact performance.

Parameter TrackedNormal RangeAction Trigger
O₂ in Flue Gas2–4%>6% (adjust air damper)
Feedwater Temp85–105°C<80°C (check economizer)
Stack Temp120–180°C>200°C (clean heat surface)
Steam Pressure±2% of setpointSudden deviation (load imbalance)

4. Integration with Energy Management Systems (EMS)

Modern automation platforms link directly with Energy Management Systems, allowing plant operators to:

  • Benchmark energy KPIs (e.g., kg steam/kg fuel).

  • Schedule optimized boiler loading.

  • Balance multiple boilers for best combined efficiency.

  • Generate compliance reports automatically.

Result: Up to 10% reduction in total plant fuel use through better load management and continuous tuning.


5. Case Study: Automated Gas-Fired Boiler System

A food processing plant replaced manual control with a PLC-based automation system featuring O₂ trim and variable-speed drives.

ParameterBeforeAfter AutomationImprovement
Efficiency (%)8794+7
Gas Use (Nm³/year)1,200,0001,110,000–90,000
Payback Period14 months

The system achieved consistent combustion quality, fewer shutdowns, and reduced fuel and maintenance costs.


6. Economic and Environmental Benefits

AspectAutomation Impact
Fuel Savings3–10% annually
Emission ReductionUp to 8% CO₂, 15% NOₓ
Maintenance Reduction10–20% less downtime
Payback Period1–2 years

The improved stability in combustion directly leads to fewer incomplete burns, lower CO and NOₓ formation, and a longer boiler life cycle.


7. Summary

Automation FunctionEfficiency ContributionKey Benefit
O₂ Trim Control1–3%Reduces excess air losses
Burner Modulation2–5%Matches fuel rate to demand
Smart Monitoring1–2%Early detection of inefficiencies
Predictive Maintenance1–3%Reduces unplanned downtime
Total Combined Gain5–10%Sustained high efficiency

Automation ensures that efficiency isn’t a one-time tuning outcome—it’s maintained every hour of operation, automatically and reliably.

🔍 Conclusion

The most efficient industrial boilers utilize advanced heat recovery and combustion control technologies, such as condensing systems for gas applications or supercritical designs for power generation. Choosing the right boiler ensures lower fuel consumption, reduced emissions, and long-term cost savings.


📞 Contact Us

💡 Looking to upgrade to a high-efficiency industrial boiler? We provide customized gas-fired, biomass, and supercritical boiler systems engineered for maximum performance and energy savings.

🔹 Contact us today to discover the most efficient boiler solution for your industry. ⚡🔥🏭✅

FAQ

What is the most efficient type of industrial boiler?

The most efficient industrial boilers today are typically condensing gas-fired boilers, which can achieve efficiencies up to 98% (LHV). These systems capture and reuse latent heat from exhaust gases that would otherwise be lost. In large-scale industrial applications, supercritical and ultra-supercritical boilers and waste heat recovery boilers (WHRBs) are also considered top performers for efficiency.


How do condensing boilers achieve such high efficiency?

Condensing boilers utilize a secondary heat exchanger to recover heat from flue gas condensate. This process captures latent heat from water vapor, dramatically improving thermal efficiency. When operated with natural gas or LPG and under low return water temperatures, they reach peak performance levels of up to 98%.


What are other highly efficient boiler types besides condensing models?

Other efficient industrial boiler types include:

  • Circulating Fluidized Bed (CFB) boilers – 85–90% efficiency, with fuel flexibility (coal, biomass, waste).

  • Waste Heat Recovery Boilers (WHRBs) – utilize exhaust heat from industrial processes or gas turbines.

  • Supercritical & Ultra-supercritical boilers – 42–47% efficiency in power generation applications.

  • Hybrid boilers – combine conventional combustion and waste heat recovery for optimized efficiency.


What factors influence industrial boiler efficiency?

Key factors include:

  • Fuel type and quality – gas yields higher efficiency than coal or biomass.

  • Steam pressure and temperature – higher conditions improve heat conversion.

  • Maintenance and operation – regular cleaning, tuning, and automation improve efficiency.

  • Heat recovery systems – economizers and air preheaters significantly boost performance.

  • Load management – running boilers at optimal load avoids efficiency loss.


Which boiler type offers the best long-term ROI?

Although condensing boilers provide the highest immediate efficiency, the best ROI depends on application:

  • Gas-fired condensing boilers – best for food, textile, and chemical industries with steady low-temperature demand.

  • CFB or biomass boilers – ideal for facilities with access to low-cost fuels.

  • Waste Heat Recovery Boilers – best where waste heat sources (kilns, turbines, engines) are available.
    A full lifecycle cost analysis should include installation, maintenance, fuel, and emission compliance costs.


References

  1. Energy.gov – Improving Steam System Efficiencyhttps://www.energy.gov

  2. IEA – High-Efficiency Industrial Boiler Technologieshttps://www.iea.org

  3. Babcock & Wilcox – Efficient Industrial Boilershttps://www.babcock.com

  4. Cleaver-Brooks – Condensing Boiler Technologyhttps://www.cleaverbrooks.com

  5. Thermax – Waste Heat Recovery Boilershttps://www.thermaxglobal.com

  6. Doosan Lentjes – Circulating Fluidized Bed Boilershttps://www.doosanlentjes.com

  7. GE Steam Power – Supercritical Boiler Efficiencyhttps://www.ge.com

  8. ASME – Boiler Efficiency Standardshttps://www.asme.org

  9. ScienceDirect – Industrial Boiler Performance Analysishttps://www.sciencedirect.com

  10. ResearchGate – Optimization of Boiler Thermal Efficiencyhttps://www.researchgate.net

Wade Zhang

CEO of Taishan Group Taian Boao International Trade Co., Ltd. 30 years experience in Global industrial boiler market,  Over 300 boiler projects experience, including 21+ EPC projects. Projects span 30+ countries & regions, involving industries such as nuclear power, energy & electricity, municipal heating, mining, textiles, tires etc.

What Is the Most Efficient Type of Industrial Boiler? Read More »

Taishan Group Showcases Advanced Industrial Boilers at 138th Canton Fair 2025

Taishan Group Showcases Advanced Industrial Boilers at 138th Canton Fair 2025

1️⃣ Exhibition Overview: Taishan Group at the 138th Canton Fair

Taishan Group, a globally recognized industrial steam boiler and power plant boiler manufacturer, is excited to announce its participation in the 138th Canton Fair, to be held in Guangzhou, China, from October 15 to 19, 2025.
We sincerely invite all domestic and international partners to visit us at Booth 18.1A09 to explore our latest energy-efficient and environmentally friendly boiler technologies.

As a leading enterprise in the boiler manufacturing industry, Taishan Group has been providing complete boiler systems and solutions for power generation, industrial processing, and renewable energy applications across more than 100 countries.

2️⃣ Innovative Boiler Products on Display

At this year’s Canton Fair, Taishan Group will present a full range of high-performance industrial boilers, including:

  • Coal-Fired Boilers – designed for high efficiency and stable operation in industrial and utility applications.

  • Biomass Boilers – an eco-friendly alternative utilizing renewable fuel sources.

  • Oil and Gas-Fired Boilers – offering flexible dual-fuel operation with low emissions and quick startup.

  • Waste-to-Energy Boilers – suitable for waste incineration and power generation projects.

  • Thermal Oil Furnace Boilers – ideal for precise and stable heat transfer in industrial processes.

Each boiler type represents Taishan Group’s commitment to innovation, energy efficiency, and environmental sustainability, ensuring that clients receive reliable, customized solutions to meet diverse industrial needs.

3️⃣ Commitment to Global Energy Efficiency and Quality

With decades of engineering expertise and international certifications, Taishan Group stands out as a trusted industrial boiler supplier and exporter. Our products comply with international standards such as ASME, CE, and ISO, and have been widely applied in power plants, chemical industries, food processing, textile manufacturing, and paper production.

At the 138th Canton Fair, we will highlight our latest advancements in low-emission combustion systems, smart control technology, and modular boiler design, helping clients reduce operating costs and achieve carbon reduction goals.


4️⃣ Visit Us at Booth 18.1A09 — Let’s Build the Future Together

Taishan Group warmly welcomes global partners, project developers, and industry professionals to visit our booth and learn more about our industrial boiler and power plant solutions. Our technical and sales teams will be available to provide on-site consultation, discuss customized projects, and share insights into the latest energy trends.

📍 Exhibition Details:

  • Event: 138th Canton Fair (China Import and Export Fair)

  • Date: October 15–19, 2025

  • Venue: Guangzhou, China

  • Booth: 18.1A09

We look forward to meeting you at the Canton Fair 2025 and exploring new opportunities for cooperation in the global energy and industrial boiler sectors.

🔍 Conclusion

Taishan Group’s participation in the 138th Canton Fair 2025 reaffirms its commitment to technological innovation and global sustainability. With advanced boiler systems engineered for performance, efficiency, and environmental compliance, Taishan Group stands ready to support industrial and power clients worldwide in achieving energy transformation and green development goals.


📞 Visit or Contact Us

📍 Event: The 138th Canton Fair 2025
📅 Date: April 15–19, 2025
🏢 Location: China Import and Export Fair Complex, Guangzhou, China
📦 Booth: 𝟏𝟖.𝟏𝐀𝟎𝟗

💡 Schedule a meeting or technical consultation with our experts today!

🔹 Join Taishan Group at the Canton Fair and discover the future of industrial boiler innovation. ⚙️🔥🌍✅

Wade Zhang

CEO of Taishan Group Taian Boao International Trade Co., Ltd. 30 years experience in Global industrial boiler market,  Over 300 boiler projects experience, including 21+ EPC projects. Projects span 30+ countries & regions, involving industries such as nuclear power, energy & electricity, municipal heating, mining, textiles, tires etc.

Taishan Group Showcases Advanced Industrial Boilers at 138th Canton Fair 2025 Read More »

How Much Does an Industrial Gas-Fired Boiler Cost?

How Much Does an Industrial Gas-Fired Boiler Cost?

When planning for a new boiler project, one of the most important considerations is the total cost of a gas-fired boiler. Without a clear understanding, businesses may underestimate budgets, face delays during installation, or select a boiler that is not aligned with their operational needs.

The cost of an industrial gas-fired boiler typically ranges from $30,000 to over $300,000 depending on capacity (measured in tons/hr or BHP), steam pressure, efficiency level, and whether it is a standard packaged unit or a custom-engineered system. Additional expenses such as installation, auxiliary equipment (burner, economizer, feedwater system, control panels), and piping can bring the total installed cost to 1.5–3 times the base price. Long-term operating costs, mainly fuel and maintenance, should also be factored into the investment decision.

By evaluating both capital and operational costs, companies can ensure better ROI and reliable steam supply.

What Factors Determine the Price of an Industrial Gas-Fired Boiler?

When businesses plan a boiler investment, they often focus on the unit price alone. However, the real cost of an industrial gas-fired boiler depends on multiple technical and project-specific factors. Gas-fired boilers are widely used for their high efficiency, cleaner emissions, and lower operating cost compared to coal and oil. Yet, their purchase price can vary by over 100% depending on capacity, design, and auxiliary systems.

The price of an industrial gas-fired boiler is primarily determined by its steam capacity, pressure rating, design type (fire-tube, water-tube, condensing, CFB), efficiency features (economizer, condenser, advanced controls), auxiliary systems (burner, feedwater system, stack), installation and commissioning costs, and compliance with local emission standards. Together, these factors can double or triple the base unit price.

This makes a holistic evaluation essential for accurate budgeting and lifecycle planning.

The base boiler price is the only major cost when buying a gas-fired boiler.False

Auxiliary systems, installation, and compliance costs can equal or exceed the boiler’s purchase price.


Efficiency features such as economizers and condensing designs increase upfront price but reduce lifecycle cost through fuel savings.True

They typically deliver 5–10% efficiency gains with 2–4 year payback periods.

1. Boiler Capacity & Pressure Rating

  • Larger capacity = higher material and fabrication costs.

  • High-pressure (>40 bar) systems need thicker steel, certified welding, and stricter safety standards.

  • Cost can rise 20–50% when moving from low to high pressure.

2. Boiler Type & Design

  • Fire-tube: Lower cost, suitable for ≤20 TPH, <25 bar.

  • Water-tube: More expensive, for larger capacities and higher pressures.

  • Condensing boilers: Add 10–20% to upfront cost but save fuel.

  • CFB gas boilers: Specialized, higher cost, for very large utility projects.

3. Efficiency Features

  • Economizers: Add 5–10% cost, improve efficiency 3–6%.

  • Condensing heat exchangers: Recover latent heat, boost efficiency to >95%.

  • O₂ Trim & Controls: Cost more initially, cut fuel use 2–5%.

4. Auxiliary Systems

  • Burner: 15–20% of project cost.

  • Feedwater treatment: 10–15%.

  • Chimney/stack: 5–8%.

  • Control panel/automation: 8–12%.

5. Installation & Commissioning

  • Adds 15–30% depending on site conditions.

  • Includes piping, electrical, civil works, and testing.

6. Emission Compliance

  • Local NOx, CO₂, and particulate standards impact design.

  • Low-NOx burners or SCR (selective catalytic reduction) can add 10–20% to boiler cost.

7. Cost Comparison Example

Boiler TypeCapacityPressureBase Price (USD)Total Installed (USD)
Fire-Tube5 TPH, 16 bar$120,000$220,000–$250,000 
Water-Tube20 TPH, 40 bar$380,000$650,000–$750,000 
Condensing10 TPH, 25 bar$260,000$450,000–$520,000 

Conclusion

The cost of a gas-fired boiler is shaped by capacity, pressure, design, efficiency features, auxiliaries, installation, and compliance needs. Buyers should budget not only for the base unit but also for integration and lifecycle efficiency.

How Does Boiler Size and Steam Capacity Affect Cost?

When planning for an industrial boiler investment, boiler size and steam capacity are among the most important cost drivers. Larger boilers not only require more materials and advanced design but also need stronger infrastructure, higher-rated auxiliaries, and stricter safety compliance. This makes cost scaling non-linear—doubling the steam output does not simply double the price; it can increase by 2.5–3 times because of pressure vessel complexity and auxiliary system upgrades.

Boiler size and steam capacity directly affect cost because larger boilers require more steel, thicker pressure parts, stronger foundations, bigger burners, and higher-capacity auxiliaries. While small packaged boilers (≤5 TPH) may cost $100,000–$200,000, medium units (10–20 TPH) can range $300,000–$700,000, and large utility-scale boilers (>50 TPH) exceed several million dollars. Higher pressures (above 40 bar) further raise costs by 20–40% due to material and fabrication requirements.

This means steam demand forecasting is crucial, as oversizing increases capital and operating cost, while undersizing risks production shortfalls.

Boiler cost scales linearly with size and steam output.False

Cost increases disproportionately with larger sizes due to thicker steel, advanced welding, and auxiliary system upgrades.


Higher-capacity boilers require bigger auxiliaries such as burners, pumps, and economizers, which significantly add to total cost.True

Auxiliary system cost grows with boiler size, often making up 30–50% of installed price.

1. Why Size Affects Price

  • Material Use: Larger pressure vessels need exponentially more steel.

  • Safety Standards: Higher pressures demand certified welding and testing.

  • Auxiliaries: Larger units require more powerful burners, pumps, fans, and controls.

  • Installation Costs: Foundations, piping, and lifting requirements are more complex.

2. Typical Cost Ranges by Capacity

Boiler SizeSteam CapacityPressure RangeBase Price (USD)Total Installed (USD)
Small Packaged1–5 TPH10–16 bar$100k – $200k$180k – $300k
Medium Industrial10–20 TPH20–40 bar$300k – $700k$550k – $1M
Large Utility30–50 TPH40–80 bar$800k – $1.5M$1.5M – $3M+
Utility-Scale>50 TPH>80 bar$2M+$5M+

3. Example: 10 TPH vs 20 TPH Boiler

  • 10 TPH, 25 bar: ~$380,000 base, ~$650,000 installed.

  • 20 TPH, 25 bar: ~$650,000 base, ~$1.2M installed.

  • Cost nearly doubles, but per-ton steam cost decreases with larger unit (economy of scale).

4. Pressure Factor

  • Low-Pressure (<16 bar): Lower steel thickness, cheaper fabrication.

  • Medium-Pressure (20–40 bar): Adds 15–25% cost.

  • High-Pressure (40–100 bar): Adds 30–40% cost due to alloy steel, certifications.

Conclusion

Boiler size and steam capacity are the primary cost determinants, with larger and higher-pressure units demanding significantly higher investment. Choosing the right capacity requires balancing CAPEX, OPEX, and scalability for future demand.

What Role Do Efficiency Ratings and Emissions Standards Play in Pricing?

When evaluating a gas-fired boiler purchase, buyers often compare only the base unit price, but efficiency ratings and emissions standards can have just as much impact on total investment. Modern energy policies, rising fuel costs, and strict air-quality regulations mean that low-cost, standard-efficiency units are often no longer viable. Instead, buyers must weigh higher upfront CAPEX against lower lifecycle fuel costs and compliance-driven penalties.

Higher efficiency ratings increase boiler price by 10–25% due to advanced heat recovery technologies, while stricter emissions standards can add 15–30% for low-NOx burners, flue gas recirculation, or SCR systems. However, these features typically reduce fuel consumption by 5–12% and avoid regulatory fines, making them cost-effective over the boiler’s lifetime.

This makes efficiency and emissions compliance not just technical requirements, but strategic cost factors that directly influence ROI.

Higher-efficiency boilers always cost more but have no impact on lifecycle cost.False

Fuel savings from a 5–10% efficiency gain often pay back the premium within 2–4 years.


Stricter emission standards can add 15–30% to boiler price due to the need for low-NOx burners and after-treatment systems.True

Meeting modern environmental regulations requires advanced combustion and flue gas treatment technologies.

1. Impact of Efficiency Ratings

  • Standard Efficiency (80–85%): Lower cost, but higher fuel bills.

  • High Efficiency (88–92%): Requires economizers, adds 10–15% cost.

  • Condensing Efficiency (>95%): Needs corrosion-resistant heat exchangers, adds 20–25%.

Efficiency LevelCost PremiumFuel SavingsPayback Period
Standard (82%)Base priceNoneN/A
High (90%)+10–15%5–8%2–4 years
Condensing (95%)+20–25%8–12%2–5 years

2. Role of Emission Standards

  • NOx Compliance: Ultra-low NOx burners add 10–20% to boiler cost.

  • SO₂ / PM: Less relevant for gas but critical in dual-fuel designs.

  • CO₂ Reduction Goals: May require efficiency upgrades or hybridization.

  • After-Treatment Systems: SCR (Selective Catalytic Reduction) or FGR (Flue Gas Recirculation) add 10–15% cost.

3. Example: 10 TPH Boiler Case

  • Standard 82% efficiency, no emissions controls: ~$280,000 base.

  • 90% efficiency + low-NOx burner: ~$340,000 (+21%).

  • 95% condensing + SCR system: ~$420,000 (+50%).

  • Fuel savings: $30,000–50,000 per year, paying back in ~3–4 years.

4. Regulatory Pressure

  • Many regions (EU, US EPA, China, India) mandate <30 mg/Nm³ NOx for new boilers.

  • Non-compliance can result in fines, retrofits, or operating restrictions.

  • Forward-looking buyers prefer to invest in future-proof systems.

Conclusion

Efficiency ratings and emissions standards directly raise upfront boiler cost, but they reduce lifecycle expenses and secure compliance. Buyers must treat these as investments in operational sustainability and risk avoidance, not optional add-ons.

How Do Auxiliary Systems and Controls Influence the Total Investment?

When companies evaluate a gas-fired boiler purchase, the boiler unit price is often the first number considered. However, this represents only part of the true cost. The auxiliary systems and control package—burners, economizers, feedwater treatment, pumps, chimneys, instrumentation, and automation—can equal or exceed the price of the boiler itself. These systems are not optional; they are essential for safe, efficient, and compliant operation.

Auxiliary systems and controls typically account for 30–50% of the total installed cost of a gas-fired boiler. Burners alone can represent 15–20% of cost, economizers 5–10%, feedwater systems 10–15%, and automation 8–12%. While they increase upfront investment, they improve combustion stability, recover waste heat, ensure water quality, reduce emissions, and optimize performance—ultimately lowering lifecycle fuel and maintenance costs.

This makes auxiliaries and controls central to both budgeting and long-term ROI.

Auxiliary systems are optional extras that can be excluded to reduce boiler cost.False

Burners, feedwater systems, and controls are essential for safe operation, efficiency, and compliance.


Automation and digital controls can add 8–12% to cost but reduce fuel use and maintenance expenses by 5–10% annually.True

Smart controls optimize combustion and enable predictive maintenance, improving lifecycle economics.

1. Major Auxiliary Systems and Their Cost Role

  • Burner System (15–20%)

    • Ensures efficient combustion and low NOx.

    • Advanced modulating burners cost more but cut fuel waste.

  • Economizer (5–10%)

    • Recovers flue gas heat to preheat feedwater.

    • Improves efficiency by 3–6% with 2–3 year payback.

  • Feedwater System (10–15%)

    • Includes deaerators, pumps, water treatment.

    • Prevents scaling and corrosion, extending boiler life.

  • Stack/Chimney (5–8%)

    • Sized for flue gas volume and emissions control needs.

  • Control & Automation (8–12%)

    • PLC/SCADA with combustion controls and safety interlocks.

    • Enables monitoring, alarms, and remote operation.

2. Comparative Example – 10 TPH Gas-Fired Boiler

Cost ComponentApprox. ShareEstimated Cost (USD)
Boiler Base Unit55–65%$240,000
Burner System15–20%$70,000
Economizer5–10%$35,000
Feedwater System10–15%$50,000
Automation & Controls8–12%$40,000
Stack & Misc.5–8%$25,000
Total Installed Cost100%~$460,000

3. Impact of Controls on Lifecycle Costs

  • Fuel Savings: O₂ trim and load modulation reduce gas use by 3–5%.

  • Maintenance Reduction: Predictive alerts lower repair frequency.

  • Downtime Avoidance: Early fault detection prevents costly shutdowns.

  • Compliance Assurance: Automated reporting simplifies regulatory checks.

4. Case Study

A 20 TPH gas-fired boiler with advanced automation cost 12% more upfront, but reduced annual gas consumption by 7%. Over 10 years, this saved $1.2M in fuel costs, more than offsetting the initial premium.

Conclusion

Auxiliary systems and controls are not secondary costs—they are the foundation of boiler efficiency, reliability, and compliance. Although they increase CAPEX, they deliver payback through fuel savings, reduced maintenance, and longer boiler lifespan.

What Is the Difference in Cost Between Packaged and Custom Gas-Fired Boilers?

When deciding on a gas-fired boiler investment, one of the first questions is whether to select a packaged unit or a custom-designed system. The choice impacts not only capital cost but also installation schedule, operating flexibility, and lifecycle economics. Many end-users assume that a larger or more advanced boiler must always be custom, but advances in modular packaged solutions have blurred this line.

Packaged gas-fired boilers are typically 20–35% less expensive upfront than custom-engineered units, since they are mass-produced, skid-mounted, and require minimal site engineering. Custom-designed boilers, while 30–50% more costly, allow higher steam capacities, special fuel blends, higher pressures, and integration with complex plant systems.

The decision depends on plant size, process needs, and site constraints.

Packaged boilers are always cheaper over their lifecycle than custom boilers.False

While packaged units cost less upfront, custom systems may deliver lower fuel costs and longer lifespans in large-scale applications.


Custom-engineered gas-fired boilers can cost 30–50% more than packaged units due to site-specific engineering and auxiliary integration.True

Design customization, higher capacities, and unique compliance requirements increase cost.

1. Packaged Gas-Fired Boilers – Cost and Benefits

  • Cost Range: $50,000 – $500,000 (up to 30 TPH steam).

  • Advantages:

    • Lower CAPEX due to standardized design.

    • Factory-assembled skid (burner, controls, feedwater) minimizes installation cost.

    • Faster delivery (2–4 months).

    • Ideal for small to mid-sized plants, hospitals, food processing.

  • Limitations:

    • Typically capped at ~30 TPH and 25–40 bar pressure.

    • Limited customization of fuel flexibility or control systems.

2. Custom Gas-Fired Boilers – Cost and Benefits

  • Cost Range: $400,000 – $3,000,000+ (30–300 TPH steam).

  • Advantages:

    • Tailored to exact steam load, pressure, and redundancy requirements.

    • Can integrate dual-fuel capability, advanced emissions controls.

    • Suitable for utility-scale power and petrochemical industries.

    • Long service life with higher efficiency optimization.

  • Limitations:

    • Longer delivery (8–12 months).

    • Engineering, commissioning, and auxiliaries increase cost.

3. Cost Comparison Example – 20 TPH Steam Boiler

ParameterPackaged BoilerCustom Boiler
Base Cost$420,000$650,000
Auxiliaries & ControlsIncluded (standard)+$150,000 (custom)
Installation$80,000$200,000
Delivery Lead Time4 months10 months
Total Installed Cost$500,000$1,000,000

4. ROI Considerations

  • Packaged Units: Faster ROI (1–3 years) in small plants with stable loads.

  • Custom Units: Longer payback (3–6 years) but better lifecycle efficiency and scalability.

  • Fuel Savings Impact: A 2–3% efficiency gain in a large custom boiler can save $100,000+ annually in fuel.

Conclusion

Packaged boilers minimize upfront investment and commissioning time, making them the best choice for small to medium industrial users. Custom boilers demand higher CAPEX but deliver flexibility, higher efficiency, and long-term reliability for large-scale operations. The correct choice depends on whether your priority is fast, low-cost deployment or optimized lifecycle performance.

What Long-Term Operating Costs Should Be Considered in Budgeting for Gas-Fired Boilers?

When planning for a new gas-fired boiler, most buyers focus on CAPEX (purchase + installation). However, the OPEX (operating expenses) often far exceed the initial investment over a boiler’s 20–30 year service life. Failure to account for these hidden costs leads to budget overruns, unexpected downtime, and poor ROI.

The main long-term operating costs include fuel (60–80% of lifecycle cost), maintenance and spare parts (5–10%), water and treatment chemicals (3–5%), emission compliance costs (2–5%), and labor/monitoring (5–10%). Budgeting must therefore prioritize lifecycle efficiency and reliability, not just upfront purchase price.

This perspective allows buyers to make smarter decisions about efficiency upgrades, automation, and preventive maintenance strategies.

Fuel costs account for the majority of a gas-fired boiler’s lifecycle expenses.True

Fuel typically represents 60–80% of total cost of ownership, making efficiency gains crucial.


Maintenance and spare parts can be ignored in lifecycle budgeting because they are minimal.False

Annual inspections, burner servicing, gasket replacements, and water-side cleaning contribute 5–10% of OPEX.

1. Major Long-Term Operating Cost Components

Cost ComponentTypical Share of OPEXDescription
Fuel Consumption60–80%Natural gas, LNG, or biogas costs dominate. Even a 1% efficiency gain can save $10,000–50,000 annually in mid-size plants.
Maintenance & Spare Parts5–10%Burner servicing, refractory repairs, valve/gasket replacements, annual inspection fees.
Water & Chemicals3–5%Feedwater pre-treatment, demineralization, softeners, oxygen scavengers. Poor water treatment increases scaling costs.
Emission Compliance2–5%NOx monitoring systems, low-NOx burner servicing, permits, and possible carbon credit purchases.
Labor & Monitoring5–10%Operator salaries, digital monitoring systems, training, safety compliance.

2. Example – 10 TPH Gas-Fired Boiler (20-Year Lifecycle)

Cost ElementAnnual Cost (USD)20-Year Cost (USD)Share of Total
Fuel (natural gas @ $0.35/m³)$280,000$5,600,00075%
Maintenance & Parts$30,000$600,0008%
Water & Chemicals$15,000$300,0004%
Emission Compliance$10,000$200,0003%
Labor & Monitoring$35,000$700,00010%
Total Lifecycle OPEX$370,000$7,400,000100%

3. Strategies to Manage OPEX

  • Invest in High Efficiency: Even a 3–5% higher efficiency rating pays back quickly through fuel savings.

  • Use Economizers/Condensing Tech: Reduces gas use by 5–10%.

  • Water Treatment Programs: Prevents scaling, reduces fuel penalties, and extends boiler life.

  • Automation & Remote Monitoring: Cuts labor costs and avoids costly downtime.

  • Planned Maintenance: Reduces emergency repair costs and keeps efficiency stable.

4. Key Insight

CAPEX for a gas-fired boiler may range from $300,000–$3M, but OPEX can exceed 10–15 times CAPEX over its service life. This makes lifecycle costing, not initial price, the critical budgeting factor.

Conclusion

When budgeting for a gas-fired boiler, long-term costs—especially fuel and maintenance—must guide investment decisions. Paying more upfront for efficiency and automation usually delivers much larger savings over the lifecycle.

🔍 Conclusion

The cost of an industrial gas-fired boiler depends on capacity, efficiency, system design, and installation scope. While the upfront investment may seem significant, choosing the right configuration can result in fuel savings, lower emissions, and reliable long-term operation.


📞 Contact Us

💡 Looking for a detailed quotation for a gas-fired boiler project? We provide cost evaluations, system customization, and turnkey installation services to match your production needs and budget.

🔹 Contact us today for a tailored gas-fired boiler solution with competitive pricing. 🏭🔥💰✅

FAQ

How much does an industrial gas-fired boiler cost?

The price depends on capacity, pressure, and design:

  • Small packaged gas boilers (1–5 t/h): $25,000 – $70,000

  • Medium capacity (6–20 t/h): $80,000 – $250,000

  • Large gas-fired units (20–75+ t/h): $400,000 – $1,200,000+
    This excludes installation, shipping, and auxiliary systems.


What factors affect the cost of a gas-fired boiler?

Key cost drivers include:

  • Capacity and pressure ratings

  • Boiler type – fire-tube vs water-tube

  • Fuel efficiency level (standard vs condensing)

  • Auxiliary equipment – economizers, burners, feedwater systems

  • Automation level – basic controls vs advanced PLC/SCADA

  • Regulatory certifications (ASME, CE, ISO, etc.)


What are the operating costs of a gas-fired boiler?

Gas-fired boilers generally have lower operating costs than oil or coal systems due to cleaner combustion.

  • Natural gas consumption – 60–75% of total OPEX

  • Routine maintenance – burner checks, water treatment, safety valves

  • Labor and utilities – operators, electrical systems

  • Emission compliance – typically lower costs compared to oil/coal


How does efficiency impact the total cost of ownership?

Efficiency plays a critical role:

  • Condensing gas boilers (95%+) provide significant savings.

  • A 10 t/h boiler running 8,000 hrs/year at 90% efficiency can save $40,000–$90,000 annually in fuel compared to an 80% unit.

  • Over a 15–20 year lifecycle, efficiency reduces overall costs more than purchase price differences.


What is the total installed cost of an industrial gas-fired boiler system?

Beyond the boiler unit itself, total installed costs include:

  • Civil works (foundation, supports)

  • Auxiliary systems – pumps, economizers, water treatment

  • Piping, ducting, and electricals

  • Commissioning and testing
    Typically, the installed cost = 1.5–2 times the boiler price.


References

  1. U.S. Department of Energy – Industrial Boiler Basicshttps://www.energy.gov

  2. ASME – Boiler and Pressure Vessel Standardshttps://www.asme.org

  3. Forbes Marshall – Gas Boiler Cost Factorshttps://www.forbesmarshall.com

  4. Cleaver-Brooks – Industrial Boiler Costshttps://www.cleaverbrooks.com

  5. Thermax – Gas-Fired Boiler Solutionshttps://www.thermaxglobal.com

  6. Babcock & Wilcox – Boiler Technologieshttps://www.babcock.com

  7. Spirax Sarco – Steam Boiler Cost Considerationshttps://www.spiraxsarco.com

  8. ResearchGate – Gas-Fired Boiler Economicshttps://www.researchgate.net

  9. ScienceDirect – Lifecycle Cost Analysis of Boilershttps://www.sciencedirect.com

  10. Engineering Toolbox – Boiler Fuel Data and Calculationshttps://www.engineeringtoolbox.com

Wade Zhang

CEO of Taishan Group Taian Boao International Trade Co., Ltd. 30 years experience in Global industrial boiler market,  Over 300 boiler projects experience, including 21+ EPC projects. Projects span 30+ countries & regions, involving industries such as nuclear power, energy & electricity, municipal heating, mining, textiles, tires etc.

How Much Does an Industrial Gas-Fired Boiler Cost? Read More »

Latest Innovations in Industrial Steam Boiler Design

Latest Innovations in Industrial Steam Boiler Design

Industrial steam boilers have long been the backbone of power generation, manufacturing, food processing, and chemical industries, but traditional designs often suffer from low efficiency, high emissions, and frequent maintenance challenges. With rising energy costs and stricter environmental regulations, companies are seeking advanced boiler technologies to stay competitive.

The latest innovations in industrial steam boiler design include high-efficiency heat recovery systems (economizers, condensing technology), low-NOx and ultra-low-emission combustion technologies, modular and compact boiler designs, smart control and automation systems with IoT integration, and compatibility with renewable fuels such as biomass and hydrogen blends. These advancements not only improve energy efficiency but also reduce carbon footprint, enhance operational safety, and extend equipment life.

By embracing these innovations, industries can lower operating costs, improve reliability, and ensure compliance with future energy and environmental standards.

How have advanced combustion technologies reduced emissions in modern steam boilers?

Industrial steam boilers have historically been significant contributors to NOx, SOx, CO, and particulate emissions. With tightening environmental regulations and rising fuel costs, traditional combustion systems often fail to meet compliance or efficiency demands. Left unchecked, these emissions not only increase operating costs but also expose plants to penalties and reputational risks. The solution has been the development and adoption of advanced combustion technologies that optimize flame stability, fuel-air mixing, and temperature control to minimize pollutant formation at the source.

Advanced combustion technologies—including low-NOx burners, staged combustion, flue gas recirculation (FGR), oxy-fuel systems, and digital combustion controls—have reduced boiler emissions by 40–80%. These innovations limit NOx formation, enhance fuel efficiency, and support compliance with global emission standards such as EPA, EU, and CPCB norms.

By implementing these technologies, modern steam boilers achieve both regulatory compliance and lower lifecycle costs, positioning industries for sustainable operation.

Conventional burners are sufficient to meet modern low-emission regulations.False

Conventional burners produce higher NOx and CO emissions and often cannot comply with today’s stricter regulations.


Low-NOx burners and staged combustion reduce NOx formation at the flame level.True

These technologies optimize flame temperature and oxygen distribution to suppress thermal NOx generation.

Key Combustion Technologies and Their Impact

1. Low-NOx Burners (LNB)

  • Improve fuel-air mixing to avoid hot spots.

  • Reduce thermal NOx by lowering flame temperature.

  • Widely used in both fire-tube and water-tube boilers.

2. Staged Combustion

  • Splits combustion into primary and secondary stages.

  • Limits oxygen availability in the first stage to suppress NOx formation.

  • Completes oxidation in the second stage to minimize CO.

3. Flue Gas Recirculation (FGR)

  • Recirculates a portion of exhaust gases into the burner.

  • Dilutes oxygen and lowers flame temperature, reducing NOx by up to 60%.

  • Common in gas-fired boilers.

4. Oxy-Fuel Combustion

  • Uses pure oxygen instead of air, eliminating nitrogen from the reaction.

  • Produces near-zero NOx and allows easier CO₂ capture.

  • Mostly applied in large, high-efficiency units.

5. Digital Combustion Controls

  • Advanced sensors and PLC/SCADA systems optimize excess air, flame shape, and fuel flow.

  • Improve efficiency while reducing both CO and NOx emissions.

Emission Reduction Comparison

TechnologyNOx Reduction (%)CO Reduction (%)Notes
Low-NOx Burner30–5010–20Standard upgrade
Staged Combustion40–6020–30Often combined with LNB
Flue Gas Recirculation50–7020–25Widely adopted in gas-fired units
Oxy-Fuel Combustion70–9040–50High cost, niche applications
Digital Controls10–2010–15Continuous optimization

Case Example: 50 TPH Water-Tube Boiler Upgrade

  • Original NOx emissions: ~350 mg/Nm³

  • With LNB + FGR: ~140 mg/Nm³ (60% reduction)

  • With additional staged combustion + controls: ~90 mg/Nm³ (75% reduction)

  • Result: Compliance with EU Industrial Emissions Directive (IED) limits (<100 mg/Nm³).

Conclusion

Advanced combustion technologies have transformed modern steam boilers from high-emission units into clean, efficient energy systems. By integrating low-NOx burners, staged combustion, FGR, oxy-fuel options, and smart controls, industries achieve both compliance and efficiency. These technologies not only cut emissions by up to 80% but also reduce fuel costs and enable future-ready carbon capture strategies.

What role do economizers, air preheaters, and condensing systems play in boosting efficiency?

One of the biggest sources of energy loss in steam boilers is wasted heat in flue gases. Traditional designs often let exhaust gases leave at high temperatures, carrying away valuable energy and forcing operators to burn more fuel to maintain steam output. This increases operational costs and emissions. The solution lies in heat recovery systems—specifically economizers, air preheaters, and condensing units—that reclaim this waste heat and feed it back into the process.

Economizers, air preheaters, and condensing systems improve boiler efficiency by 5–15% by recovering waste heat from flue gases. Economizers preheat feedwater, air preheaters raise combustion air temperature, and condensing systems extract latent heat from water vapor in exhaust, collectively reducing fuel consumption and emissions.

By integrating these systems, modern boilers achieve higher thermal efficiency, lower operating costs, and better compliance with energy-efficiency standards.

Flue gas heat recovery systems have little effect on boiler efficiency.False

Heat recovery through economizers, air preheaters, and condensing units significantly reduces fuel use and raises efficiency.


Condensing systems recover latent heat from exhaust gases, improving boiler efficiency.True

Condensing heat exchangers extract additional energy by cooling flue gases below dew point.

How Each System Boosts Efficiency

1. Economizers

  • Located in the flue gas path before the chimney.

  • Transfer waste heat to incoming feedwater.

  • Typical fuel savings: 4–7%.

  • Reduce thermal shock to boiler by preheating water.

2. Air Preheaters

  • Use flue gas to warm combustion air.

  • Hotter combustion air improves flame stability and efficiency.

  • Typical fuel savings: 2–4%.

  • Common in large water-tube boilers.

3. Condensing Heat Exchangers

  • Cool flue gases below the dew point (~55°C).

  • Recover latent heat from water vapor in exhaust.

  • Efficiency gain: up to 8–10% (especially with natural gas).

  • Require corrosion-resistant materials due to acidic condensate.

Efficiency Gains Overview

SystemEfficiency ImprovementNotes
Economizer4–7%Feedwater preheating
Air Preheater2–4%Hotter combustion air
Condensing Unit5–10%Latent heat recovery
Combined Use10–15%Common in modern designs

Case Example: 50 TPH Gas-Fired Boiler

  • Base efficiency: ~82%

  • With economizer: ~87%

  • With air preheater: ~90%

  • With condensing heat exchanger: ~94–95%

  • Net fuel savings: ~10–15% (~$250,000/year in a mid-sized plant).

Conclusion

Economizers, air preheaters, and condensing systems are essential components of modern high-efficiency boilers. By recovering both sensible and latent heat from flue gases, they significantly cut fuel consumption and emissions. Plants that integrate these systems typically achieve 10–15% higher efficiency, making them vital tools for reducing lifecycle costs and meeting stringent energy regulations.

How do modular and compact boiler designs improve installation and scalability?

For decades, industrial boiler projects were defined by long installation times, heavy civil foundations, and rigid, single-unit capacity. This meant high upfront investment and limited flexibility if demand changed. Delayed commissioning often created costly downtime for plants waiting on steam supply. Modular and compact boiler designs were developed as a solution to these challenges, offering faster setup, smaller footprints, and scalable capacity expansion.

Modular and compact boiler designs reduce installation time by up to 50% by using factory-assembled, skid-mounted units that require minimal on-site work. They also improve scalability by allowing plants to add modules in parallel as steam demand grows, ensuring flexible, staged investment and improved operational efficiency.

This approach provides industries with faster project delivery, lower installation risk, and adaptable capacity planning.

Modular boilers take as long to install as conventional monolithic designs.False

Factory-assembled modular boilers require far less site fabrication, cutting installation time by months.


Compact boiler systems allow plants to scale up capacity by adding units instead of replacing existing equipment.True

Parallel modular arrangements enable cost-effective expansion and load balancing.

Key Benefits of Modular and Compact Boiler Designs

1. Accelerated Installation

  • Pre-engineered, skid-mounted units reduce civil works.

  • On-site installation typically cut from 6–9 months (conventional) to 2–4 months.

  • Containerized compact units can be operational in 4–8 weeks.

2. Scalable Capacity Growth

  • Modules (e.g., 5–30 TPH each) can be installed incrementally.

  • Load-sharing across modules enhances part-load efficiency.

  • Expansion is as simple as adding more units, avoiding major shutdowns.

3. Smaller Footprint & Mobility

  • Compact designs fit in tight industrial spaces or urban plants.

  • Easier transport using standard trucks or containers.

  • Suitable for relocatable or temporary installations.

4. Operational Flexibility & Reliability

  • Multiple modules provide redundancy—if one fails, others maintain supply.

  • Maintenance can be performed on individual units without halting the entire system.

Installation & Scalability Comparison

FeatureConventional BoilerModular/Compact Boiler
Installation Time6–9 months2–4 months (or less)
FootprintLargeCompact
ExpansionReplace or oversizeAdd parallel modules
ReliabilitySingle point of failureRedundant operation
Investment ModelHigh upfrontStaged investment

Case Example: 120 TPH Steam Demand

  • Conventional option: One 120 TPH water-tube boiler → ~12 months delivery + ~8 months installation.

  • Modular option: Six 20 TPH modules → ~8 months delivery + ~3 months installation.

  • Expansion scenario: Demand increases to 160 TPH → simply add two more 20 TPH modules, avoiding new boiler procurement.

Conclusion

Modular and compact boiler designs streamline installation and make steam generation systems more adaptable to evolving plant needs. By shortening commissioning, reducing space requirements, and enabling staged capacity growth, these designs help industries cut costs and improve reliability while future-proofing steam infrastructure.

What smart automation and IoT solutions are being applied in boiler control systems?

In traditional boiler systems, operators relied on manual checks and analog gauges to maintain safe and efficient performance. This approach was prone to delays in fault detection, inefficiencies in fuel usage, and higher maintenance costs. As industries push for greater efficiency, safety, and reliability, manual monitoring has become a limiting factor. The solution has been the integration of smart automation and IoT technologies, which allow boilers to self-optimize, predict failures, and provide real-time data for decision-making.

Smart automation and IoT solutions in boiler control systems include advanced PLC/SCADA integration, IoT-enabled sensors for temperature, pressure, and water chemistry, cloud-based monitoring platforms, predictive maintenance algorithms, and AI-driven combustion optimization. These technologies improve efficiency by 5–15%, enhance safety, and minimize downtime by enabling remote supervision and proactive interventions.

By adopting these solutions, modern steam boilers evolve into intelligent, connected assets within Industry 4.0 frameworks.

IoT solutions in boiler systems are mainly cosmetic and do not affect performance.False

IoT sensors and automation provide actionable data that improves efficiency, reliability, and safety.


Smart automation allows predictive maintenance and remote boiler monitoring.True

AI-enabled analytics detect early faults, reducing downtime and unplanned costs.

Key Smart Automation & IoT Applications

1. IoT-Enabled Sensors

  • Real-time monitoring of temperature, pressure, vibration, water chemistry (pH, TDS), and fuel flow.

  • Data transmitted to central dashboards for trend analysis.

2. PLC & SCADA Systems

  • Programmable Logic Controllers (PLC) automate burner management, feedwater control, and blowdown scheduling.

  • Supervisory Control and Data Acquisition (SCADA) systems provide centralized visualization and alarms.

3. Cloud & Remote Monitoring

  • Data uploaded to secure cloud platforms.

  • Remote access allows operators and OEMs to supervise performance globally.

  • Enables 24/7 diagnostics and service support.

4. Predictive Maintenance with AI

  • Machine learning analyzes sensor data to predict tube leaks, scaling, or burner faults before failure.

  • Reduces unscheduled downtime by up to 30–40%.

5. Advanced Combustion Control

  • AI-driven algorithms adjust air-fuel ratio, excess oxygen, and flame stability dynamically.

  • Improves fuel efficiency and lowers NOx and CO emissions.

Benefits of Smart Boiler Controls

BenefitTraditional SystemsSmart Automation & IoT
Efficiency75–85%85–95%
MonitoringManual, localReal-time, remote
MaintenanceReactivePredictive & proactive
SafetyOperator-dependentAutomated fail-safes
Data AnalyticsMinimalAdvanced AI-driven insights

Example: Smart Boiler Upgrade

A 50 TPH gas-fired boiler upgraded with IoT sensors, predictive analytics, and AI combustion control achieved:

  • Fuel savings: ~8% annually.

  • NOx reduction: 25%.

  • Unplanned downtime: cut by 35%.

  • Payback period: ~2 years due to reduced fuel and maintenance costs.

Conclusion

Smart automation and IoT are revolutionizing boiler control systems. By combining real-time monitoring, predictive analytics, cloud platforms, and AI-based combustion control, boilers are becoming intelligent, self-optimizing assets. These solutions not only boost efficiency and safety but also align industrial plants with digital transformation and sustainability goals.

How are renewable fuels (biomass, hydrogen, waste-to-energy) integrated into boiler design?

Conventional industrial boilers were historically optimized for coal, oil, or natural gas, which are reliable but carbon-intensive fuels. As sustainability regulations tighten and industries pursue decarbonization, companies face the challenge of adopting renewable alternatives. However, burning biomass, hydrogen, or waste-derived fuels introduces unique design challenges—such as variable calorific values, higher moisture content, and combustion stability issues. To address these, boiler manufacturers are re-engineering systems with specialized designs that enable efficient, safe, and flexible use of renewable fuels.

Renewable fuels are integrated into boiler design by customizing combustion chambers, fuel feeding systems, burners, and heat recovery components to handle the unique properties of biomass, hydrogen, and waste-derived fuels. Biomass boilers require larger furnaces and advanced ash handling, hydrogen boilers need specially designed burners to manage flame speed and NOx formation, while waste-to-energy boilers integrate robust grates, advanced filtration, and corrosion-resistant alloys. These adaptations ensure efficiency, safety, and compliance with emission standards.

By adopting these design solutions, industries can transition from fossil fuels to sustainable steam generation without compromising reliability.

Hydrogen can be burned in conventional gas burners without modification.False

Hydrogen requires specially designed burners due to its high flame speed, low ignition energy, and risk of flashback.


Biomass fuels can replace coal in boilers when combustion chamber design and feeding systems are adapted.True

Biomass needs larger furnace volumes, moisture management, and ash handling systems to operate efficiently.

Fuel-Specific Boiler Design Adaptations

1. Biomass Integration

  • Fuel Feeding: Screw feeders, pneumatic conveyors, or chain grates for diverse biomass sizes.

  • Combustion Chamber: Larger furnace volumes to account for lower calorific value (~8–18 MJ/kg vs. coal’s ~24–30 MJ/kg).

  • Ash Handling: Automatic removal systems due to higher ash and slag formation.

  • Emission Control: Multi-cyclones, bag filters, or electrostatic precipitators to capture particulates.

2. Hydrogen Integration

  • Burner Technology: Special swirl-stabilized burners to manage hydrogen’s flame speed and prevent flashback.

  • NOx Control: Flue gas recirculation (FGR), staged combustion, or water injection.

  • Material Selection: Alloys resistant to hydrogen embrittlement.

  • Hybrid Flexibility: Many modern hydrogen-ready boilers can run on natural gas today and transition to 100% H₂ in the future.

3. Waste-to-Energy (WtE) Integration

  • Fuel Handling: Robust grates and feeding systems to handle municipal solid waste (MSW), RDF, or industrial residues.

  • Combustion Chamber: High turbulence zones for complete burnout of heterogeneous fuels.

  • Corrosion Resistance: Water walls clad with Inconel or stainless steel to withstand chlorine and alkali salts.

  • Emission Control: Advanced flue gas treatment including lime scrubbers, bag filters, and SCR units for dioxin, acid gas, and NOx control.

Boiler Design Comparison by Fuel

FeatureBiomass BoilerHydrogen BoilerWaste-to-Energy Boiler
Calorific Value (Fuel)8–18 MJ/kg120–142 MJ/kg6–12 MJ/kg (variable)
Furnace DesignLarger volume, low-NOx air stagingCompact, high-velocity burnersLarge grate systems, robust walls
Main ChallengeMoisture & ash handlingFlame stability, NOx emissionsFuel variability, corrosion
Key SolutionAdvanced feeding & ash removalHydrogen-specialized burnersHigh-alloy materials & emission scrubbing

Example of Hybrid Integration

A European paper mill replaced two coal boilers with biomass-waste co-firing units:

  • Fuel mix: 70% wood chips, 30% RDF.

  • Efficiency: ~84%.

  • CO₂ reduction: 220,000 tons/year.

  • Payback: ~5 years, due to avoided carbon taxes and lower fuel costs.

Conclusion

Renewable fuels can be successfully integrated into modern boiler design when fuel-specific adaptations are applied. Biomass boilers require robust fuel and ash handling, hydrogen boilers demand specialized burners and NOx control, while waste-to-energy units need durable materials and sophisticated emission treatment. Together, these innovations enable industries to meet decarbonization targets while maintaining reliable steam generation.

What safety and durability innovations enhance the long-term reliability of boilers?

Boilers operate under high temperature and pressure conditions, making them one of the most critical and risk-prone assets in industrial plants. Historically, boiler failures caused downtime, safety hazards, and costly repairs due to tube ruptures, scaling, or faulty controls. These risks limited operational efficiency and shortened equipment lifespan. To address these challenges, manufacturers have introduced safety and durability innovations that reduce accidents, extend service life, and ensure regulatory compliance.

Modern boiler reliability is enhanced through safety innovations such as redundant safety valves, automated burner management systems, flame detection, and IoT-enabled monitoring, combined with durability improvements like advanced alloys, membrane wall construction, anti-corrosion coatings, and predictive maintenance analytics. These solutions prevent catastrophic failures, extend operating cycles, and lower lifecycle costs.

Together, these innovations transform boilers into safer, more resilient, and longer-lasting assets.

Boiler safety is guaranteed solely by operator experience and manual checks.False

Modern boilers employ automated protection systems, sensors, and fail-safes that go beyond manual monitoring.


Using advanced alloys and coatings significantly extends boiler tube life under harsh conditions.True

Materials such as Inconel, stainless steel, and ceramic coatings resist corrosion, scaling, and high-temperature creep.

Key Safety Innovations in Modern Boilers

1. Automated Burner Management Systems (BMS)

  • Ensures proper sequencing of start-up, operation, and shutdown.

  • Monitors fuel-air ratio and prevents unsafe ignition.

  • Integrated flame scanners for early fault detection.

2. Redundant Safety Valves and Interlocks

  • Dual or triple valves ensure pressure relief redundancy.

  • Interlock systems shut down fuel supply instantly during abnormal conditions.

3. IoT-Based Safety Monitoring

  • Real-time sensors track pressure, temperature, vibration, water chemistry, and flame stability.

  • Predictive alarms prevent operator delay in responding to unsafe conditions.

4. Emergency Shutdown Systems (ESD)

  • Rapid depressurization and fuel cut-off.

  • Linked to plant-wide safety instrumented systems (SIS).

Durability Enhancements

1. Advanced Materials

  • Membrane water wall tubes reduce leakage points.

  • High-alloy steels and Inconel claddings withstand chlorine, sulfur, and hydrogen attack.

  • Ceramic coatings protect against slagging and scaling.

2. Water Chemistry Management

  • Automatic dosing systems maintain pH, hardness, and dissolved oxygen levels.

  • Online monitoring minimizes scaling and corrosion.

3. Thermal Stress Control

  • Drum and tube designs with optimized expansion joints.

  • Controlled ramp-up and cool-down sequences reduce fatigue.

4. Predictive and Preventive Maintenance

  • AI-driven analytics predict tube failure or corrosion hotspots.

  • Condition-based monitoring replaces fixed-interval overhauls.

Comparative Table: Traditional vs. Modern Reliability Features

FeatureTraditional BoilersModern Boilers with Innovations
Safety ControlManual checksAutomated BMS, IoT alarms
MaterialsCarbon steelInconel, stainless, ceramic-coated
Corrosion ResistanceBasic treatmentsAdvanced coatings & alloy cladding
MonitoringPeriodic manualContinuous digital monitoring
Lifespan15–20 years25–35 years with proper care

Case Example

A 200 TPH circulating fluidized bed (CFB) boiler upgraded with Inconel-coated water walls and IoT monitoring achieved:

  • Tube failure reduction: 70% over five years.

  • Extended inspection cycle: from 12 to 24 months.

  • Operational availability: >96%.

Conclusion

Modern safety and durability innovations—ranging from automated burner controls and IoT sensors to advanced alloys and anti-corrosion coatings—significantly extend boiler reliability and safety. These technologies protect operators, reduce maintenance costs, and ensure compliance with increasingly stringent industry standards, securing the long-term value of boiler investments.

🔍 Conclusion

The future of industrial steam boilers lies in efficiency, sustainability, and digitalization. By adopting these latest design innovations, companies can not only reduce fuel consumption and emissions but also achieve smarter, safer, and more flexible operations.


📞 Contact Us

💡 Interested in upgrading to the latest boiler technology? We provide advanced design solutions, fuel conversions, and turnkey project support to help industries transition to next-generation steam boiler systems.

🔹 Contact us today to explore innovative steam boiler solutions tailored to your industry needs. 🚀🔥🌱✅

FAQ

What are the latest innovations in industrial steam boiler design?

Modern steam boiler design integrates advanced technologies to enhance performance, safety, and sustainability. Key innovations include:

  • Low-NOx and ultra-low-NOx burners for reduced emissions.

  • Condensing heat recovery systems to boost efficiency by 5–10%.

  • Biomass and multi-fuel capabilities for renewable energy use.

  • Digital twin technology for predictive maintenance and performance modeling.

  • Smart automation systems with IoT integration for real-time monitoring.


How is automation changing industrial steam boiler design?

Automation has shifted boilers from manual operation to intelligent control systems. Features include:

  • PLC and SCADA-based controls for precise operation.

  • Remote monitoring via cloud platforms.

  • AI-powered optimization of combustion and load management.

  • Predictive maintenance alerts, reducing downtime and costs.


What materials and construction improvements are being used in modern boilers?

  • High-strength, corrosion-resistant alloys extend boiler lifespan.

  • Improved refractory materials enhance heat retention and durability.

  • Modular design allows faster assembly and flexible capacity scaling.

  • Compact footprint designs save plant space without sacrificing output.


How do sustainability trends affect steam boiler design?

To align with global decarbonization goals, boiler manufacturers are focusing on:

  • Biomass, biogas, and hydrogen-ready designs.

  • Carbon capture and storage (CCS) compatibility.

  • High-efficiency heat recovery units for reduced fuel use.

  • Hybrid systems combining renewable energy with conventional fuel boilers.


What benefits do companies gain from adopting innovative boiler designs?

Organizations that upgrade to modern designs benefit from:

  • Lower fuel costs due to higher efficiency.

  • Regulatory compliance with stricter emission standards.

  • Reduced downtime thanks to predictive maintenance.

  • Flexibility in fuel sources, ensuring long-term sustainability.

  • Enhanced safety with advanced monitoring and control systems.


References

  1. U.S. Department of Energy – Advanced Boiler Systemshttps://www.energy.gov

  2. IEA – Innovation in Industrial Energy Systemshttps://www.iea.org

  3. Babcock & Wilcox – Modern Boiler Technologieshttps://www.babcock.com

  4. Cleaver-Brooks – Boiler Design Advancementshttps://www.cleaverbrooks.com

  5. Forbes Marshall – Smart Steam Boiler Systemshttps://www.forbesmarshall.com

  6. Thermax – Sustainable Boiler Innovationshttps://www.thermaxglobal.com

  7. Spirax Sarco – Boiler Energy Efficiency Trendshttps://www.spiraxsarco.com

  8. ScienceDirect – Research on Boiler Innovationhttps://www.sciencedirect.com

  9. ResearchGate – Smart Boiler Technologieshttps://www.researchgate.net

  10. Engineering Toolbox – Boiler Performance Datahttps://www.engineeringtoolbox.com

Wade Zhang

CEO of Taishan Group Taian Boao International Trade Co., Ltd. 30 years experience in Global industrial boiler market,  Over 300 boiler projects experience, including 21+ EPC projects. Projects span 30+ countries & regions, involving industries such as nuclear power, energy & electricity, municipal heating, mining, textiles, tires etc.

Latest Innovations in Industrial Steam Boiler Design Read More »

WNS3 Oil & Gas-Fired Boiler Ready for International Shipment

WNS3 Oil & Gas-Fired Boiler Ready for International Shipment

1️⃣ Shipment Overview: Preparing for Safe Delivery

[Company Name] is pleased to announce the upcoming shipment of a WNS3 oil and gas-fired boiler along with its auxiliary equipment. The boiler is currently on the transport vehicle, undergoing final secure packaging to ensure safe delivery to the client’s country.

Our logistics and engineering teams are closely monitoring the packaging process to maintain the integrity and quality of the equipment during transportation. This shipment exemplifies our commitment to delivering high-efficiency, reliable industrial boilers to clients worldwide.

2️⃣ Boiler Specifications & Advanced Features

The WNS3 boiler is designed as a dual-fuel (oil and gas) steam boiler with internal and chamber combustion systems, offering high flexibility for industrial applications. Key technical parameters include:

  • Boiler Type: WNS3, oil and gas-fired

  • Design Pressure: 1.25 MPa

  • Fuel Type: Oil and gas

  • Application: Steam generation for industrial processes

The boiler is engineered for stable and efficient operation, providing consistent steam output while maintaining energy efficiency. Its advanced combustion technology ensures reliable performance, optimal fuel utilization, and compliance with modern industrial standards. This combination of quality, efficiency, and reliability makes it an ideal solution for diverse industrial applications.

3️⃣ Packaging, Handling & Transportation

To ensure the safe shipment of the WNS3 boiler, the unit and auxiliary equipment are being carefully packed with reinforced protective materials. Each component is securely fastened to prevent damage during transit, and the loading process is supervised by our experienced logistics team.

Our meticulous approach to industrial boiler export ensures that every shipment arrives in perfect condition, minimizing risk and supporting on-time project execution for our clients.


4️⃣ Customer Value & After-Sales Support

The WNS3 oil and gas-fired boiler offers clients a reliable, energy-efficient steam solution tailored to industrial needs. Customers benefit from:

  • Stable and high-quality steam generation

  • Advanced dual-fuel flexibility for operational convenience

  • Reliable construction and long service life

  • Professional packaging, logistics support, and technical guidance

  • Comprehensive after-sales service including installation and commissioning

This shipment highlights [Company Name]’s expertise as a trusted industrial boiler manufacturer and exporter, committed to providing high-performance steam boilers that enhance operational efficiency and ensure client satisfaction.

🔍 Conclusion

The shipment of the 6t/h coal-fired steam boiler to Kyrgyzstan demonstrates our strength in designing, manufacturing, and exporting customized industrial boilers. By ensuring high efficiency, stable operation, and strong service support, this project helps the juice factory achieve reliable production capacity and cost efficiency.


📞 Contact Us

💡 Looking for a reliable steam boiler solution for your food or beverage plant? We provide customized design, high-efficiency equipment, and global delivery services to meet your production needs.

🔹 Contact us today for a customized steam boiler solution that boosts your factory’s productivity. 🏭🍊🔥✅

FAQ

What is the WNS3 oil and gas-fired boiler?

The WNS3 is a 3-ton/hour horizontal internal combustion boiler designed for both oil and natural gas fuels. It features:

  • High thermal efficiency (90%+) with optimized combustion

  • Dual-fuel flexibility for secure and cost-effective operation

  • Low NOx burner design for compliance with environmental standards

  • Compact, packaged design for easy installation and maintenance


Why choose a WNS series boiler for industrial applications?

  • Proven reliability – widely adopted in food, textiles, chemicals, and pharmaceuticals

  • Lower fuel costs – especially when operating with natural gas

  • Ease of operation – automated controls and safe operation system

  • Durability – long service life with high-grade materials


How is the WNS3 boiler prepared for international shipment?

  • Factory testing before dispatch to ensure quality

  • Strong export packaging to prevent damage

  • Modular transportation for simplified logistics

  • Full documentation for customs clearance and compliance


What industries benefit from the WNS3 oil and gas boiler?

This boiler is suitable for:

  • Food and beverage factories – sterilization, cooking, bottling

  • Textile and garment industries – dyeing and finishing processes

  • Chemical and pharmaceutical plants – process heating

  • Manufacturing – general industrial steam applications


Do you provide installation and after-sales service globally?

Yes, we provide:

  • On-site installation and commissioning support

  • Operator training programs

  • Spare parts supply and quick replacement

  • Remote technical assistance for troubleshooting


References

  1. U.S. Department of Energy – Industrial Boilershttps://www.energy.gov

  2. ASME – Boiler Standardshttps://www.asme.org

  3. Cleaver-Brooks – Dual-Fuel Boiler Technologyhttps://www.cleaverbrooks.com

  4. Babcock & Wilcox – Oil & Gas-Fired Boilershttps://www.babcock.com

  5. Thermax – WNS Oil & Gas Steam Boilershttps://www.thermaxglobal.com

  6. Forbes Marshall – Steam Boiler Applicationshttps://www.forbesmarshall.com

  7. Spirax Sarco – Steam in Industrial Applicationshttps://www.spiraxsarco.com

  8. ResearchGate – Oil & Gas Boiler Performancehttps://www.researchgate.net

  9. ScienceDirect – Advances in Industrial Boilershttps://www.sciencedirect.com

  10. Engineering Toolbox – Boiler Data & Efficiencyhttps://www.engineeringtoolbox.com

Wade Zhang

CEO of Taishan Group Taian Boao International Trade Co., Ltd. 30 years experience in Global industrial boiler market,  Over 300 boiler projects experience, including 21+ EPC projects. Projects span 30+ countries & regions, involving industries such as nuclear power, energy & electricity, municipal heating, mining, textiles, tires etc.

WNS3 Oil & Gas-Fired Boiler Ready for International Shipment Read More »

How Much Does an Industrial Oil-Fired Boiler Cost?

How Much Does an Industrial Oil-Fired Boiler Cost?

Investing in an industrial oil-fired boiler is a major capital decision, and many businesses struggle with budgeting due to the wide variation in costs. Without a clear understanding, companies may face unexpected expenses, delayed projects, or choosing an undersized/oversized unit that affects long-term efficiency.

The cost of an industrial oil-fired boiler generally ranges from $25,000 to over $250,000 depending on boiler capacity (measured in tons/hr or BHP), pressure rating, efficiency level, and whether it is packaged or custom-engineered. Additional expenses include installation, auxiliary equipment (burner, economizer, feedwater system, control panels), and operational costs such as fuel and maintenance. For a complete installed system, total project costs may be 1.5–3 times the base boiler price.

Understanding these cost factors allows businesses to make accurate budget plans and optimize ROI.

What Factors Influence the Price of an Industrial Oil-Fired Boiler?

When investing in an oil-fired boiler, many plant operators focus only on the quoted purchase price. However, the true cost of an industrial oil-fired boiler is influenced by multiple technical and operational factors—capacity, steam pressure, fuel type, efficiency features, and auxiliary systems. Failing to consider these variables can lead to unexpected overruns in both investment and lifecycle costs.

The price of an industrial oil-fired boiler is influenced by its steam capacity, working pressure, boiler type (fire-tube or water-tube), efficiency-enhancing features (economizers, condensing design), fuel oil type, auxiliary equipment (burners, feedwater systems, controls), and installation requirements. Larger capacity and higher-pressure units cost significantly more, while advanced designs with higher efficiency add to upfront investment but reduce operating costs over time.

This means buyers should evaluate not only initial equipment costs but also long-term operational savings and compliance needs when selecting a boiler.

The purchase price of an oil-fired boiler is the only major cost to consider.False

Auxiliary systems, installation, efficiency features, and lifecycle fuel costs often exceed the base equipment price.


Higher efficiency boilers with economizers or condensing designs have higher upfront prices but lower lifetime fuel costs.True

Fuel savings over 15–20 years typically outweigh the additional investment.

1. Steam Capacity and Working Pressure

  • Small boilers (1–5 TPH, <20 bar) → $50,000–$150,000.

  • Medium boilers (5–20 TPH, 20–40 bar) → $200,000–$600,000.

  • Large utility-scale (>20 TPH, >40 bar) → $1 million+.
    Capacity and pressure requirements are usually the biggest cost drivers.

2. Boiler Type: Fire-Tube vs. Water-Tube

ParameterFire-Tube BoilerWater-Tube Boiler
CostLowerHigher
Capacity RangeUp to ~25 TPH>25 TPH
Pressure RangeUp to ~30 bar>100 bar possible
EfficiencyModerateHigh (with advanced designs)

3. Fuel Oil Type and Quality

  • Heavy fuel oil (HFO): Requires preheaters and filtering → adds to cost.

  • Light fuel oil (diesel): Easier combustion, lower CAPEX.

  • Dual-fuel boilers: Higher investment but offer flexibility.

4. Efficiency-Enhancing Features

  • Economizers → +5–7% efficiency, +$30,000–$100,000 investment.

  • Condensing design → 92–95% efficiency, higher CAPEX but strong fuel savings.

  • Advanced controls (O₂ trim, digital monitoring) → +$15,000–$50,000.

5. Auxiliary Systems and Installation

  • Burners, pumps, feedwater treatment, chimneys, and control panels must be included in total cost.

  • Installation (civil works, piping, electricals) often equals 30–50% of equipment price.

6. Case Example

A 10 TPH, 25 bar water-tube oil-fired boiler with economizer and full auxiliary systems:

  • Base boiler: $350,000.

  • Auxiliaries: $180,000.

  • Installation: $150,000.

  • Total installed cost: ~$680,000.
    Adding a condensing unit added $90,000, but fuel savings gave a 3.5-year payback.

Conclusion

The price of an industrial oil-fired boiler is shaped by more than just equipment cost. Capacity, pressure, fuel type, boiler design, efficiency features, and auxiliary systems all play a role. Evaluating total installed and lifecycle costs ensures a smarter investment decision.

How Does Boiler Capacity and Pressure Rating Affect Cost?

When selecting an oil-fired boiler, one of the first specifications to define is steam capacity (tons of steam per hour) and working pressure (bar/psi). These two parameters directly impact not only the design and materials required but also the manufacturing complexity, auxiliary equipment size, and ultimately the price. Ignoring their effect can lead to budget miscalculations or underperforming systems.

Boiler capacity and pressure rating strongly affect cost because larger capacity boilers require more heat transfer surface area, larger pressure vessels, and bigger auxiliary systems, while higher pressure ratings demand thicker steel, more advanced welding, stricter certifications, and higher-spec safety equipment. As a result, costs increase nonlinearly with capacity and pressure.

This makes it essential to balance your process needs with cost-optimized sizing.

Boiler cost increases linearly with capacity and pressure.False

Costs rise nonlinearly due to material thickness, certification, and auxiliary system scaling.


Higher capacity and pressure ratings require more advanced design and manufacturing, driving up price.True

Larger heat transfer areas, thicker steel, and high-pressure safety compliance add to CAPEX.

1. Effect of Capacity on Cost

  • Heat Transfer Surface Area: More tubes, larger shell, and extended furnace.

  • Auxiliaries: Bigger pumps, fans, and burners required.

  • Space & Installation: Civil works and piping costs scale with size.

Boiler CapacityTypical Cost RangeNotes
1–5 TPH$50,000 – $150,000Small industrial use
5–20 TPH$200,000 – $600,000Food, textile, chemical plants
20–50 TPH$700,000 – $1.5MLarge process & captive power
50+ TPH$2M+Utility-scale, custom engineered

2. Effect of Pressure Rating on Cost

  • Thicker Pressure Vessel Walls: ASME Section I or EN 12952 compliance.

  • More Expensive Materials: For >40 bar, alloy steels often replace carbon steel.

  • Stricter Safety Systems: High-pressure safety valves, drum internals, controls.

  • Testing & Certification: Hydrostatic testing at 1.5× design pressure increases QA/QC costs.

Pressure RatingTypical Impact on Cost
<20 barBaseline cost
20–40 bar+15–25% over baseline
40–60 bar+25–40% over baseline
>60 bar+50% or more, depending on alloys

3. Case Example

A customer requested a 10 TPH boiler at 18 bar vs. 40 bar:

  • 18 bar fire-tube design cost: $320,000.

  • 40 bar water-tube design with thicker drums: $430,000.

  • Difference: +34%, mainly due to vessel wall thickness and certification.

4. Engineering Insight

  • Capacity affects size and auxiliaries.

  • Pressure affects materials and vessel design.

  • The highest cost multipliers occur when both scale up together—a 50 TPH, 60 bar boiler costs 5–6× a 10 TPH, 20 bar boiler, not just 5×.

Conclusion

Boiler capacity and pressure rating are the primary technical drivers of cost in oil-fired boiler projects. Larger boilers demand more heat exchange surface and auxiliaries, while higher pressures require advanced metallurgy and certification. Buyers should carefully match process requirements to avoid over-specification and unnecessary CAPEX.

What Role Do Auxiliary Systems (Burner, Economizer, Feedwater System) Play in Total Cost?

When evaluating an oil-fired boiler investment, many buyers focus on the base boiler unit price. However, the reality is that the auxiliary systems—burner, economizer, feedwater treatment, pumps, chimneys, and controls—can contribute 30–50% of the total installed cost. These systems are not optional extras; they are essential to ensure efficient combustion, reliable steam generation, and long-term operational safety.

Auxiliary systems such as burners, economizers, and feedwater systems play a major role in total boiler cost because they ensure proper combustion, energy recovery, and water quality. The burner alone can represent 15–20% of cost, the economizer adds 5–10% but improves efficiency, and the feedwater system can account for 10–15%. Together, auxiliaries often equal or exceed the boiler’s base price while reducing lifecycle fuel and maintenance costs.

This means a realistic budget must always account for these critical components.

Auxiliary systems are optional add-ons for oil-fired boilers.False

Burners, feedwater treatment, and controls are essential for safe and efficient operation.


Auxiliary systems often account for 30–50% of the total installed cost of an oil-fired boiler.True

Burners, economizers, and feedwater systems add significant cost but are indispensable for efficiency and reliability.

1. Burner System

  • Function: Atomizes fuel oil, mixes with air, ensures complete combustion.

  • Cost Impact: 15–20% of total system cost.

  • Efficiency Role: Poor-quality burners waste fuel and increase emissions.

  • Advanced Options: Low-NOx burners, digital combustion controls.

2. Economizer

  • Function: Recovers flue gas heat to preheat feedwater.

  • Cost Impact: 5–10% of total boiler project.

  • Efficiency Role: Improves efficiency by 3–6%, lowering fuel bills.

  • Payback: Often within 2–3 years.

Boiler SizeWith Economizer Efficiency (%)Without Economizer Efficiency (%)
5 TPH8479
10 TPH8580
20 TPH8681

3. Feedwater System

  • Function: Conditions and supplies water to boiler at required pressure/quality.

  • Components: Pumps, deaerator, water softener/RO, chemical dosing system.

  • Cost Impact: 10–15% of total project.

  • Efficiency Role: Prevents scaling, corrosion, and unplanned downtime.

4. Additional Auxiliaries

  • Chimney/stack (5–8%).

  • Instrumentation and control panels (5–12%).

  • Oil storage and handling system (varies).

5. Case Example

For a 10 TPH, 25 bar oil-fired boiler:

  • Base boiler: $320,000.

  • Burner system: $65,000.

  • Economizer: $35,000.

  • Feedwater system: $50,000.

  • Other auxiliaries (stack, controls, piping): $100,000.

  • Total Installed Cost: ~$570,000.

Here, auxiliaries represented ~44% of total investment—but also ensured efficiency and long-term reliability.

Conclusion

Auxiliary systems are not secondary—they are integral to boiler cost and performance. While they add significantly to CAPEX, they deliver payback through efficiency gains, fuel savings, and reduced downtime. Any cost evaluation that ignores them risks major underestimation.

What Is the Difference in Cost Between Packaged and Custom-Designed Oil-Fired Boilers?

When industrial users budget for an oil-fired boiler, one of the earliest decisions is whether to select a packaged unit or commission a custom-designed system. This choice significantly influences both upfront capital cost and long-term operating expenses. A packaged boiler typically arrives factory-assembled, ready to connect and run, while a custom system is engineered for site-specific requirements such as higher capacities, unique steam parameters, or integration with existing infrastructure.

Packaged oil-fired boilers generally cost 20–35% less than custom-designed units of the same capacity because they are standardized, factory-assembled, and require less on-site installation. Custom-designed boilers, however, provide greater flexibility, higher pressure/temperature capabilities, and better integration with complex plants, but involve longer delivery times and higher engineering, fabrication, and installation costs.

This cost difference is not just about initial CAPEX—it reflects differences in scalability, flexibility, and lifecycle value.

Packaged boilers are always cheaper in both upfront and lifecycle costs than custom systems.False

While packaged boilers have lower initial cost, custom systems may offer better efficiency, durability, and integration for complex plants, reducing lifecycle expenses.


Custom-designed boilers typically cost 20–50% more than packaged systems due to engineering, fabrication, and site integration requirements.True

Customization adds complexity and longer project timelines, increasing both material and labor costs.

1. Packaged Oil-Fired Boilers – Cost Characteristics

  • Capacity Range: Up to ~20 TPH, 20–25 bar.

  • Price Range: $50,000 – $600,000 depending on size.

  • Advantages:

    • Factory-tested, minimal site work.

    • Lower transportation and installation cost.

    • Shorter delivery (3–6 months).

  • Limitations:

    • Restricted capacity and design options.

    • Less flexible integration with advanced fuel or emission systems.

2. Custom-Designed Oil-Fired Boilers – Cost Characteristics

  • Capacity Range: >20 TPH, up to 150 bar+ for utility-grade.

  • Price Range: $400,000 – $5 million+.

  • Advantages:

    • Tailored to site fuel, steam demand, and environmental compliance.

    • Can integrate advanced economizers, multi-fuel burners, or cogeneration.

    • Higher durability and longer lifecycle ROI for large operations.

  • Limitations:

    • Longer lead time (8–14 months).

    • Requires detailed site engineering.

    • Higher installation and commissioning cost.

3. Comparative Cost Table

ParameterPackaged BoilerCustom-Designed Boiler
Capacity Limit≤20 TPH>20 TPH, utility scale
Delivery Time3–6 months8–14 months
Installation Cost10–15% of base price20–35% of base price
Efficiency82–87%85–92%
Price Range$50k – $600k$400k – $5M+

4. Example Case

A 10 TPH, 25 bar packaged boiler may cost around $280,000 including auxiliaries with installation adding another $40,000. A custom 10 TPH, 40 bar system with advanced economizer and emissions control may cost $420,000–$480,000, with installation and commissioning raising the total beyond $600,000.

Conclusion

The choice between packaged and custom oil-fired boilers depends on scale, flexibility needs, and long-term ROI. Packaged boilers are ideal for small to mid-sized industrial users seeking lower upfront cost and fast delivery, while custom designs are justified when higher pressures, unique integration, or strict environmental compliance is required.

How Do Installation and Commissioning Expenses Impact the Overall Budget?

When budgeting for an oil-fired boiler, many buyers initially focus on the boiler unit price. However, the installation and commissioning phase often represents a substantial share of total project cost. These expenses go beyond simply placing the boiler in position—they include civil works, piping, electrical connections, auxiliary system integration, safety checks, and operator training. Ignoring this portion of investment can lead to budget overruns of 15–30%.

Installation and commissioning expenses typically add 20–35% to the total oil-fired boiler project budget, depending on boiler size, site conditions, and system complexity. Smaller packaged boilers may only require 10–15% additional cost, while large custom-designed systems can double installation spending due to specialized foundations, extensive piping, and advanced automation integration.

This means that true project cost must account for more than just the equipment—it includes the effort required to make it fully operational.

Installation and commissioning costs are negligible compared to boiler purchase price.False

They can add 20–35% to the total project budget, making them a major cost factor.


Commissioning involves testing, calibration, and operator training, not just switching on the boiler.True

Proper commissioning ensures safe, efficient, and compliant operation.

1. Breakdown of Installation Costs

  • Civil & Structural Works (5–10%) – foundation, housing, chimney base.

  • Mechanical Erection (5–12%) – boiler placement, piping, ducting, insulation.

  • Electrical & Controls (3–8%) – cabling, switchgear, control panels.

  • Auxiliary Integration (5–10%) – burner, economizer, feedwater system, stack.

2. Commissioning Expenses

  • System Calibration: Burner tuning, pressure/temperature controls.

  • Performance Testing: Efficiency, emissions, safety interlocks.

  • Training Programs: Operators trained on daily operations and troubleshooting.

  • Documentation: Compliance reports for regulators.

3. Cost Comparison Example

Boiler TypeBase Boiler CostAuxiliariesInstallation & CommissioningTotal Installed Cost
5 TPH Packaged$180,000$70,000$40,000 (15%)$290,000
20 TPH Custom$420,000$180,000$200,000 (27%)$800,000
50 TPH Utility$900,000$450,000$500,000 (33%)$1,850,000

4. Case Example

A 20 TPH oil-fired boiler project in Southeast Asia initially budgeted $600,000 for boiler + auxiliaries only. Installation and commissioning were underestimated at $80,000, but actual costs reached $200,000 due to site-specific piping, high-pressure steam integration, and extended testing. The final budget overran by 20%—an avoidable mistake with proper upfront planning.

5. Cost Reduction Strategies

  • Pre-fabricated Skids: Reduce onsite welding and piping labor.

  • Standardized Controls: Faster commissioning vs. custom-built automation.

  • Vendor-Supported Installation: EPC contracts streamline cost control.

  • Early Site Surveys: Prevents underestimation of civil/utility expenses.

Conclusion

Installation and commissioning are not minor add-ons—they are integral to total project economics. By realistically budgeting 20–35% for this phase, operators can avoid overruns and ensure the boiler delivers safe, efficient, and compliant performance from day one.

What Are the Long-Term Operational and Maintenance Cost Considerations?

When planning an oil-fired boiler investment, many buyers focus on capital cost but underestimate the operational and maintenance (O&M) expenses that dominate the boiler’s lifecycle. Since fuel, water treatment, and servicing account for 70–80% of total ownership cost, understanding these factors is essential for accurate budgeting and long-term profitability.

The main long-term operational and maintenance cost considerations for oil-fired boilers include fuel consumption (60–70% of lifecycle cost), routine maintenance (5–10%), replacement of wear parts (burners, pumps, refractory), water treatment chemicals, downtime risk, and compliance testing. High-efficiency designs, predictive maintenance, and automation can reduce O&M costs by 10–20% over the boiler’s life.

This means selecting the right boiler design and service approach has a larger financial impact than negotiating equipment purchase price.

Capital expenditure is the largest cost component in oil-fired boiler ownership.False

Fuel consumption dominates lifecycle costs, often exceeding 60% of total expenditure.


Regular maintenance and water treatment reduce lifecycle costs by preventing efficiency loss and unplanned downtime.True

Scaling, fouling, and poor burner performance increase fuel waste and repair expenses.

1. Fuel Costs – The Dominant Factor

  • Represents 60–70% of lifetime cost.

  • Efficiency losses of just 1% can increase fuel bills by thousands of dollars annually.

  • Fuel oil quality (viscosity, sulfur content) impacts burner wear and efficiency.

2. Routine Maintenance

  • Annual servicing: Burner tuning, safety valve calibration, refractory inspection.

  • Consumables: Gaskets, filters, seals.

  • Labor: Skilled technicians are critical to prevent downtime.

  • Cost share: Typically 3–5% of annual O&M budget.

3. Component Replacement

  • Burners: 8–12 year lifespan.

  • Pumps and fans: 10–15 years.

  • Refractory: 5–8 years depending on duty cycle.

  • Unexpected failure leads to high downtime cost.

4. Water Treatment & Blowdown

  • Essential for preventing scaling and corrosion.

  • Cost depends on raw water hardness and treatment method (softener, RO, chemicals).

  • Poor treatment can reduce efficiency by 5–10% and shorten boiler life.

5. Compliance and Testing

  • Regular emissions checks for NOx, SO₂, and particulates.

  • Safety certification renewals every 1–3 years depending on jurisdiction.

  • Associated costs include inspection fees and temporary downtime.

6. Example Lifecycle Cost Breakdown

Cost ElementShare of Lifecycle CostNotes
Fuel60–70%Highly dependent on efficiency & oil prices
Water Treatment5–8%Chemicals, blowdown losses
Routine Maintenance5–10%Inspections, tuning, minor parts
Component Replacement8–12%Burners, fans, refractory, pumps
Compliance & Testing3–5%Emissions, safety certification

7. Strategies to Reduce O&M Costs

  • Economizers & Condensing Units: Reduce fuel use by 5–8%.

  • Advanced Automation: Optimizes combustion and detects inefficiencies.

  • Predictive Maintenance: Sensors forecast failures before breakdowns.

  • High-Quality Water Treatment: Extends boiler life and prevents scaling.

  • Training Operators: Reduces human error and improves efficiency.

Conclusion

Long-term operational and maintenance costs often outweigh the purchase price of an oil-fired boiler. A strategic focus on fuel efficiency, preventive maintenance, and water treatment is the best way to control total cost of ownership and extend boiler life.

🔍 Conclusion

The price of an industrial oil-fired boiler is shaped by capacity, pressure, efficiency, and system scope. While the upfront investment may seem high, choosing the right boiler with proper auxiliary systems and installation planning ensures long-term reliability and fuel savings.


📞 Contact Us

💡 Need a detailed quotation for an oil-fired boiler project? We provide cost analysis, system design, and turnkey installation support to help you select the most cost-effective solution.

🔹 Contact us today for a customized oil-fired boiler quotation that matches your capacity and budget needs. 🏭🔥💰✅

FAQ

How much does an industrial oil-fired boiler cost?

The cost depends on capacity, design, and customization:

  • Small packaged oil-fired boilers (1–5 t/h): $30,000 – $80,000

  • Medium capacity (6–20 t/h): $100,000 – $300,000

  • Large units (20–75+ t/h): $500,000 – $1,500,000+
    Prices exclude installation, shipping, and auxiliary equipment.


What factors influence the price of an oil-fired boiler?

Key cost drivers include:

  • Boiler capacity and pressure rating

  • Fuel efficiency (standard vs condensing designs)

  • Auxiliary equipment – burners, economizers, feedwater systems

  • Material selection – high-grade steel, corrosion resistance

  • Automation level – manual vs PLC-based intelligent controls

  • Compliance requirements – ASME, CE, or local certifications


What are the operating costs of an oil-fired boiler?

Operating costs are dominated by fuel expenses:

  • Fuel oil consumption – The largest OPEX (60–80%).

  • Maintenance – Burner servicing, tube cleaning, water treatment.

  • Labor and utilities – Skilled operators and electricity for auxiliaries.

  • Emissions control – Filters or scrubbers may be required for compliance.


How does efficiency affect the cost of ownership?

A boiler with higher efficiency (90% vs 80%) reduces annual fuel consumption significantly.

  • Example: A 10 t/h oil-fired boiler running 8,000 hours/year can save $50,000–$100,000+ annually in fuel when efficiency is optimized.

  • Over 20 years, efficiency improvements have more impact than the initial purchase price.


What is the typical total installed cost of an oil-fired boiler system?

Beyond the boiler itself, installation includes:

  • Civil works and foundations

  • Piping and electrical connections

  • Auxiliary systems (pumps, water treatment, controls)

  • Commissioning and testing
    The installed cost is usually 1.3–2 times the boiler purchase price.


References

  1. U.S. Department of Energy – Industrial Boilershttps://www.energy.gov

  2. ASME – Boiler and Pressure Vessel Standardshttps://www.asme.org

  3. Forbes Marshall – Oil-Fired Boiler Cost Factorshttps://www.forbesmarshall.com

  4. Babcock & Wilcox – Industrial Boiler Systemshttps://www.babcock.com

  5. Cleaver-Brooks – Boiler Efficiency and Cost of Ownershiphttps://www.cleaverbrooks.com

  6. Thermax – Oil-Fired Boiler Solutionshttps://www.thermaxglobal.com

  7. Spirax Sarco – Cost Considerations in Steam Boilershttps://www.spiraxsarco.com

  8. ResearchGate – Economic Analysis of Oil Boilershttps://www.researchgate.net

  9. ScienceDirect – Lifecycle Costs of Industrial Boilershttps://www.sciencedirect.com

  10. Engineering Toolbox – Boiler Fuel Consumption Datahttps://www.engineeringtoolbox.com

Wade Zhang

CEO of Taishan Group Taian Boao International Trade Co., Ltd. 30 years experience in Global industrial boiler market,  Over 300 boiler projects experience, including 21+ EPC projects. Projects span 30+ countries & regions, involving industries such as nuclear power, energy & electricity, municipal heating, mining, textiles, tires etc.

How Much Does an Industrial Oil-Fired Boiler Cost? Read More »

Typical Lead Time for Industrial Steam Boiler Manufacturing and Delivery

Typical Lead Time for Industrial Steam Boiler Manufacturing and Delivery

When planning a new project or boiler replacement, one of the biggest concerns for buyers is how long it will take to manufacture and deliver the industrial steam boiler. Delays can lead to production downtime, extended project schedules, and additional costs if not planned properly.

The typical lead time for manufacturing and delivering an industrial steam boiler ranges from 8 to 20 weeks, depending on the boiler type (fire-tube, water-tube, biomass, or waste heat), capacity, customization requirements, and availability of auxiliary equipment. Standard packaged boilers with common specifications may be available faster, while custom-designed, high-capacity, or special-fuel boilers can take 6–12 months including engineering, fabrication, testing, and shipment. Delivery time also depends on logistics arrangements, packaging, and port of dispatch.

Understanding these timelines helps businesses schedule projects efficiently and avoid costly delays.

What factors influence the manufacturing lead time of industrial steam boilers?

One of the most frustrating pain points for project managers and plant owners is the delay between ordering and receiving an industrial steam boiler. Extended lead times can disrupt project schedules, delay production capacity, and even cause contractual penalties. This problem often arises when the complexity of boiler manufacturing and supply chains is underestimated. The solution is to understand the critical factors influencing lead time so that procurement schedules can be planned more realistically and contingencies established.

The manufacturing lead time of industrial steam boilers is influenced by factors such as boiler size and design complexity, material availability, fabrication processes, customization requirements, quality inspections, regulatory certifications, and shipping logistics. Larger, custom-designed boilers typically take 6–12 months, while standard package boilers may be delivered in 3–6 months.

By recognizing these variables early, companies can engage suppliers strategically, optimize design choices, and prevent schedule overruns.

All industrial steam boilers can be manufactured and delivered within 2 months.False

Only small, standardized units may be ready quickly; large custom boilers often require 6–12 months.


Material availability and design complexity significantly affect boiler lead time.True

Special alloys, thicker plates, and custom designs require longer sourcing and fabrication times.

Key Factors Influencing Manufacturing Lead Time

1. Boiler Size and Design Complexity

  • Small package boilers: Faster production due to standardized designs.

  • Large water-tube boilers: Require extensive engineering, tube bending, welding, and stress testing.

  • Complex combustion systems (multi-fuel, low-NOx burners) extend design and testing phases.

2. Material Availability

  • Pressure vessel steel, alloy tubes, and refractory materials may have long procurement cycles.

  • Special metallurgy (stainless, Inconel) often requires longer sourcing lead times.

Material TypeTypical Lead TimeNotes
Standard carbon steel plates2–4 weeksReadily available
Alloy tubes (superheater, reheater)8–12 weeksSpecialized mills
Stainless steels12–16 weeksLonger procurement
Refractory bricks/insulation3–6 weeksOften outsourced

3. Fabrication and Assembly

  • Tube bending, welding, and NDT (non-destructive testing) are time-intensive.

  • Large boilers often require modular assembly at site, adding to total schedule.

4. Customization Requirements

  • Standard “off-the-shelf” designs ship faster.

  • Custom configurations (dual-fuel systems, hybrid firing, special controls) increase engineering and manufacturing cycles.

5. Quality Assurance and Testing

  • Hydrostatic testing, X-ray welding inspections, and performance trials extend production timelines.

  • Third-party inspections (ABS, ASME, Lloyd’s Register) add additional scheduling layers.

6. Regulatory Certifications

  • Boilers must comply with codes such as ASME, CE, or IBR (India).

  • Certification requires document preparation, inspector scheduling, and approvals.

7. Shipping and Logistics

  • Large boilers may require special transport permits, oversized cargo handling, or even on-site assembly.

  • Overseas shipments can add 4–8 weeks depending on distance and customs.

Example Timeline for a 50 TPH Water-Tube Boiler

StageTypical DurationNotes
Design & Engineering6–8 weeksDrawings, calculations, approvals
Material Procurement8–12 weeksAlloy tubes often critical path
Fabrication & Welding10–14 weeksPressure parts and auxiliaries
Testing & Certification4–6 weeksHydro test, NDT, inspector approval
Shipping & Installation6–10 weeksDepends on geography
Total34–50 weeks (8–12 months)Custom projects longer

Conclusion

The manufacturing lead time of industrial steam boilers is a function of engineering complexity, material availability, fabrication intensity, and certification requirements. While smaller package boilers can be delivered in a few months, large custom-built units often require nearly a year from order to commissioning. Early planning, realistic scheduling, and supplier coordination are essential to avoid costly project delays.

How does boiler type (fire-tube vs. water-tube) affect delivery time?

One common pain point in boiler procurement is underestimating how the type of boiler—fire-tube or water-tube—impacts manufacturing and delivery schedules. Project managers may expect fast delivery regardless of boiler choice, only to face delays that disrupt commissioning and production start-up. The core solution is to understand how differences in design, size, and complexity affect lead times so that procurement strategies can be aligned with project schedules.

Fire-tube boilers generally have shorter delivery times, typically 3–6 months, due to standardized designs and simpler fabrication. Water-tube boilers, especially large custom-built units, require 6–12 months or more because of their engineering complexity, extensive welding, and certification requirements.

By considering boiler type early in project planning, companies can balance schedule requirements with capacity needs and avoid bottlenecks caused by unrealistic delivery expectations.

Fire-tube and water-tube boilers require the same delivery time.False

Fire-tube units are standardized and faster to produce, while water-tube units involve longer design and fabrication cycles.


Water-tube boilers typically take longer to manufacture and deliver than fire-tube boilers.True

The larger size, modular construction, and custom designs of water-tube boilers extend lead times.

Key Differences Affecting Delivery Time

Fire-Tube Boilers

  • Compact design with tubes running through a shell filled with water.

  • Often manufactured as package units, pre-engineered and stocked.

  • Fabrication involves fewer critical welds and simpler assembly.

  • Shorter certification and testing cycles.

  • Typical delivery: 12–24 weeks (3–6 months).

Water-Tube Boilers

  • Complex design with water flowing through tubes heated externally by combustion gases.

  • Usually large-capacity, custom-engineered to meet site-specific requirements.

  • Extensive tube bending, welding, stress relieving, and NDT inspections required.

  • Requires modular assembly and, in many cases, site fabrication.

  • Regulatory approvals (e.g., ASME, IBR, CE) take longer.

  • Typical delivery: 28–52 weeks (6–12 months).

Delivery Time Comparison

Boiler TypeTypical Capacity RangeDelivery Time (Months)Notes
Fire-TubeUp to ~30 TPH3–6Standardized, faster shipping
Water-Tube (Package)30–50 TPH6–9More engineering complexity
Water-Tube (Utility/Custom)50–500+ TPH9–12+Large custom builds, longer certification

Example Timeline Illustration

For a 50 TPH plant requirement:

  • Fire-tube option: Delivery in ~16 weeks, but may not meet steam demand efficiently.

  • Water-tube option: Delivery in ~40 weeks, but suitable for higher loads and continuous duty.

Conclusion

Boiler type directly influences delivery time. Fire-tube boilers offer quicker availability due to simpler, standardized designs, making them ideal for smaller plants or urgent projects. Water-tube boilers, while slower to deliver, provide the capacity, efficiency, and durability required for large-scale continuous operations. Choosing the right type requires balancing delivery schedules with long-term performance requirements.

What impact do customizations and auxiliary systems have on production schedules?

One of the most common frustrations in boiler projects is that delivery timelines stretch far longer than expected. A major reason is the inclusion of customizations and auxiliary systems. While such add-ons improve performance, efficiency, or compliance, they introduce new engineering steps, procurement delays, and extended testing phases. If project managers fail to anticipate this impact, they may commit to unrealistic schedules and face penalties or downtime. The solution is to clearly understand how auxiliary systems and custom designs affect production schedules.

Customizations and auxiliary systems significantly extend boiler production schedules because they require additional engineering, specialized materials, supplier coordination, and integrated testing. Features like dual-fuel burners, economizers, advanced controls, and water treatment systems can add 2–6 months to delivery, especially for large water-tube boilers.

Factoring in these extensions at the procurement stage ensures project timelines remain realistic and avoids costly overruns.

Adding customizations to a boiler has little or no effect on production schedule.False

Custom features extend engineering, procurement, and testing phases, often adding months to delivery.


Auxiliary systems like feedwater treatment and economizers can lengthen boiler delivery times.True

These components require additional design, sourcing, and integration, impacting the schedule.

How Customizations Extend Lead Time

  1. Engineering & Design Modifications

    • Custom drawings, 3D modeling, and code compliance reviews.

    • Involves coordination with multiple suppliers (e.g., burner, controls, pumps).

  2. Procurement of Specialized Components

    • Non-standard burners, exotic alloy tubes, or advanced control panels may have long lead times.

    • International sourcing adds customs and shipping delays.

  3. Fabrication & Assembly Complexity

    • Integrating auxiliary equipment into the boiler house requires modular assembly.

    • Additional piping, cabling, and mounting extend shop work and on-site commissioning.

  4. Testing & Certification

    • Each customization (low-NOx burner, economizer, feedwater system) must undergo performance and safety tests.

    • Third-party inspections and compliance checks add further time.

Typical Schedule Impacts

Customization / Auxiliary SystemAdditional Time AddedNotes
Dual-Fuel Burner System4–8 weeksMore complex fuel piping & testing
Economizer / Air Preheater3–6 weeksRequires integration with flue gas path
Advanced Controls (PLC/SCADA)6–10 weeksHardware + programming + FAT/SAT
Deaerator & Feedwater System4–6 weeksFabrication + piping integration
Water Treatment Unit3–5 weeksChemical dosing or demineralizer system
Emission Control (SCR/Baghouse)8–12 weeksOften critical path item

Example: 50 TPH Water-Tube Boiler with Custom Additions

  • Base unit (standard water-tube): 32–40 weeks

  • With economizer + SCADA + dual-fuel burner: +12–16 weeks

  • Total delivery time: ~44–56 weeks (10–13 months)

Conclusion

Customizations and auxiliary systems can transform a boiler into a more efficient, flexible, and compliant asset—but they also extend manufacturing and delivery schedules. Each added system introduces engineering, procurement, and testing stages that accumulate into months of extra time. For realistic project planning, procurement teams must account for these schedule impacts at the bidding stage and build sufficient buffer into delivery timelines.

How long does testing, quality assurance, and certification add to the timeline?

A common pain point in boiler procurement is underestimating the time required for testing, quality assurance (QA), and certification. Many project managers assume once fabrication is complete, delivery is immediate. In reality, rigorous inspection and certification are mandatory for safety, performance, and regulatory compliance. If not planned properly, these steps can delay shipment by weeks or even months, especially when third-party inspectors or international standards are involved. The solution is to factor in these processes early when negotiating project schedules.

Testing, quality assurance, and certification typically add 4–10 weeks to the boiler manufacturing timeline. Hydrostatic and non-destructive tests, material traceability, control system validation, and compliance with standards like ASME, CE, or IBR must be completed before shipment. Larger custom boilers and stricter jurisdictions may extend this to 12 weeks or more.

These steps, though time-consuming, are essential to ensure reliability, safety, and regulatory acceptance.

Boiler testing and certification can be skipped to save time if fabrication is completed.False

Testing and certification are mandatory for safety and compliance; skipping them is not permissible.


Testing and certification can add up to 2–3 months to the delivery schedule of industrial boilers.True

Extensive inspections and third-party approvals often extend timelines significantly.

Breakdown of Time Additions

ActivityTypical Time AddedNotes
Hydrostatic Pressure Test1 weekConfirms vessel integrity
Non-Destructive Testing (X-ray, Ultrasonic, Magnetic)2–3 weeksInspects weld quality & material flaws
Material Traceability & QA Documentation1–2 weeksRequired for certifications (ASME, CE, IBR)
Control System & Burner Performance Tests1–2 weeksFactory Acceptance Test (FAT)
Third-Party Inspections2–4 weeksScheduling often delays
Regulatory Certification (ASME, CE, IBR)2–4 weeksDocumentation + inspector sign-off

Example Timeline Impact

For a 50 TPH water-tube boiler:

  • Fabrication complete: Week 30

  • Testing & QA (hydro, NDT, performance tests): +4 weeks

  • Certification (ASME stamp, CE, IBR): +4–6 weeks

  • Total added time: 8–10 weeks (can be longer if inspector availability or rework delays occur)

Factors That Influence Testing Duration

  1. Boiler Size & Complexity – Larger boilers require longer hydro and NDT cycles.

  2. Standards & Jurisdictions – Multiple certifications (e.g., ASME + CE) extend paperwork and inspections.

  3. Third-Party Inspector Availability – Scheduling conflicts often delay approvals.

  4. Rework Requirements – Failed tests may add several weeks if repairs are needed.

Conclusion

Testing, quality assurance, and certification are not optional add-ons but integral parts of the boiler manufacturing timeline. They typically extend schedules by 1–2.5 months, with longer durations for large, custom, or multi-standard projects. Properly accounting for these steps at the contract stage prevents unrealistic delivery promises and ensures boilers enter service safely and compliantly.

What shipping, packaging, and port handling considerations affect delivery?

Even after a boiler is fully manufactured and tested, delivery timelines can still be delayed by logistical challenges. Many project teams assume shipping is a straightforward task, but in reality, the sheer size and weight of industrial boilers make transportation, packaging, and port handling critical schedule risks. Without proper planning, boilers may be damaged in transit, stuck at customs, or delayed by lack of specialized handling equipment. The solution is to anticipate these logistics factors as part of the delivery schedule.

Shipping, packaging, and port handling can add 2–8 weeks to boiler delivery schedules depending on boiler size, distance, packaging complexity, and port capacity. Oversized boilers require custom crating, heavy-lift equipment, route surveys, and specialized handling at ports, all of which introduce potential delays.

By addressing logistics requirements early, manufacturers and buyers can avoid surprises that extend delivery timelines.

Boilers can be shipped like standard equipment without special handling.False

Industrial boilers are oversized, heavy, and require specialized packaging, permits, and handling at ports.


Shipping and port handling can add more than a month to boiler delivery timelines.True

Complex logistics steps, customs clearance, and heavy-lift handling can extend schedules by several weeks.

Key Shipping and Handling Considerations

  1. Boiler Size and Weight

    • Fire-tube units are smaller, often containerized or truck-mounted.

    • Water-tube units may exceed 100 tons and require modular shipment.

    • Oversized loads often need road surveys, escort vehicles, and special permits.

  2. Packaging and Protection

    • Boilers are crated with steel framing or shrink-wrapped to prevent corrosion.

    • Sensitive components (burners, controls) are packaged separately.

    • Export packaging may include fumigation or weatherproof coatings.

  3. Port Handling Requirements

    • Heavy-lift cranes (250–500 tons) may be required.

    • Some ports cannot accommodate oversized loads, requiring alternative routes.

    • Congestion and vessel scheduling can add days to weeks.

  4. Customs and Documentation

    • Certificates of origin, inspection reports, and shipping documents must align with regulations.

    • Incomplete paperwork can delay customs clearance.

    • Some countries require pre-shipment inspections (PSI), adding 1–2 weeks.

Timeline Impacts

StageTypical Time AddedNotes
Packaging & Crating1–2 weeksSteel frame, shrink-wrap, export prep
Inland Transport (factory to port)1–3 weeksRoute surveys, permits, escort vehicles
Port Handling & Vessel Loading1 weekHeavy-lift cranes, scheduling
Customs & Clearance1–2 weeksVaries by country
Ocean Freight (example: Asia → Europe)4–6 weeksDepends on route & vessel availability

Example Case

For a 100 TPH water-tube boiler shipped overseas:

  • Packaging & inland transport: 3 weeks

  • Port handling & loading: 1 week

  • Customs clearance: 2 weeks

  • Ocean shipping: 5 weeks

  • Total logistics time: ~11 weeks (nearly 3 months)

Conclusion

Shipping, packaging, and port handling are major factors in boiler delivery timelines. Unlike standard equipment, boilers require specialized crating, heavy-lift logistics, and careful customs preparation. These steps typically add 2–8 weeks, but for oversized water-tube units shipped internationally, the logistics phase alone can stretch to 3 months. Anticipating these requirements during project planning is essential to align delivery with commissioning schedules.

DZL coal-fired boilers(3)

How can project planning and early procurement reduce lead time risks?

One of the greatest challenges in industrial boiler projects is the risk of delivery delays. These delays often stem not from fabrication itself, but from poor planning, late procurement, and lack of coordination with suppliers and inspectors. A misaligned schedule can lead to idle installation teams, postponed commissioning, and financial penalties. The solution lies in integrating project planning with early procurement strategies that anticipate bottlenecks and secure critical-path items in advance.

Project planning and early procurement reduce lead time risks by aligning engineering, fabrication, logistics, and certification schedules. By finalizing specifications early, pre-ordering long-lead components, and engaging regulators and suppliers upfront, companies can cut 10–20% off delivery timelines and avoid last-minute delays.

This proactive approach not only ensures boilers arrive on time but also stabilizes budgets and improves coordination across contractors and stakeholders.

Boiler procurement can start after fabrication begins without affecting delivery.False

Delaying procurement risks shortages of critical parts and extends the fabrication schedule.


Early procurement of long-lead items helps reduce overall boiler delivery time.True

Securing burners, tubes, and control systems in advance prevents bottlenecks during production.

Key Ways Project Planning Reduces Lead Time

  1. Front-End Engineering & Early Finalization

    • Locking specifications early prevents redesign delays.

    • Standardizing on proven configurations reduces engineering cycles.

  2. Long-Lead Item Procurement

    • Burners, high-pressure tubes, economizers, and control panels often have 12–20 week lead times.

    • Pre-ordering ensures they arrive before fabrication milestones.

  3. Parallel Workflows

    • While boilers are fabricated, civil works and piping can progress simultaneously.

    • Reduces idle time during site installation.

  4. Regulatory Engagement

    • Early scheduling with ASME, CE, or IBR inspectors prevents last-minute certification delays.

    • Pre-shipment inspections (PSI) can be booked months in advance.

  5. Logistics Planning

    • Route surveys, port booking, and customs documentation prepared early prevent shipping hold-ups.

    • Alternative shipping options can be reserved in case of congestion.

Typical Impact on Delivery Timeline

Risk FactorDelay if ReactiveTime Saved if Proactive
Late spec finalization+4–6 weeksSave 4 weeks
Long-lead item shortage+8–12 weeksSave 6–10 weeks
Inspector availability+2–4 weeksSave 2–3 weeks
Port congestion+1–3 weeksSave 1–2 weeks
Overall+15–25 weeksSave 10–20% of schedule

Example: 80 TPH Water-Tube Boiler Project

  • Without early procurement: 48 weeks fabrication + 10 weeks shipping + 8 weeks testing delays = ~66 weeks total.

  • With proactive planning: 44 weeks fabrication (specs frozen early) + 8 weeks shipping (routes pre-booked) + 4 weeks testing = ~56 weeks total.

  • Net reduction: ~10 weeks saved.

Conclusion

Project planning and early procurement are among the most effective strategies to reduce lead time risks in boiler projects. By freezing designs early, securing long-lead components, and coordinating with inspectors and logistics providers in advance, companies can compress timelines by weeks or even months. This foresight is especially critical in large water-tube boiler projects where delays can ripple across an entire plant startup schedule.

🔍 Conclusion

The lead time for an industrial steam boiler depends on design complexity, production capacity, and shipping logistics, but with proper planning, companies can align delivery with their project schedules. Early consultation with suppliers ensures on-time installation and startup.


📞 Contact Us

💡 Need a clear delivery schedule for your steam boiler project? We provide detailed project timelines, production updates, and shipping coordination to keep your project on track.

🔹 Contact us today for reliable boiler manufacturing and delivery scheduling. 🚢🔥🏭✅

FAQ

What is the typical lead time for manufacturing an industrial steam boiler?

The lead time varies depending on capacity, design complexity, and customization:

  • Standard packaged boilers – 8 to 12 weeks.

  • Medium-capacity water tube boilers – 12 to 20 weeks.

  • Large or custom-designed utility boilers – 6 to 12 months.
    This includes material procurement, fabrication, assembly, and factory acceptance testing (FAT).


What factors affect the delivery time of industrial steam boilers?

Key factors include:

  • Boiler size and pressure rating – Larger, high-pressure units require longer fabrication.

  • Customization level – Special materials, fuel systems, or emission controls extend timelines.

  • Auxiliary equipment integration – Economizers, feedwater systems, and controls may add lead time.

  • Material availability – Delays in alloy steels or castings can affect schedules.

  • Regulatory compliance – ASME stamping, CE marking, or local certifications may extend delivery.


What is the typical shipping time after manufacturing?

  • Domestic delivery – 1 to 3 weeks.

  • International delivery – 4 to 8 weeks depending on shipping method and customs clearance.

  • Modularized transport – Large boilers may be shipped in sections, requiring longer logistics coordination.


How can buyers reduce boiler lead times?

Strategies include:

  • Early project planning – Engage manufacturers at the feasibility stage.

  • Standardized designs – Opt for proven models rather than custom configurations.

  • Pre-ordering critical components – Burners, controls, and pressure parts often have long procurement times.

  • Choosing local manufacturers – Reduces shipping and customs delays.


Why is understanding lead time important for industrial projects?

Knowing lead time helps in:

  • Project scheduling – Aligning boiler delivery with civil works and plant commissioning.

  • Cost planning – Avoiding penalties for project delays.

  • Resource allocation – Coordinating auxiliary systems, utilities, and manpower.
    Lead time is a critical factor in overall project success.


References

  1. U.S. DOE – Industrial Boiler Procurement Guidelineshttps://www.energy.gov

  2. ASME – Boiler Manufacturing and Certification Standardshttps://www.asme.org

  3. Babcock & Wilcox – Boiler Project Timelineshttps://www.babcock.com

  4. Cleaver-Brooks – Steam Boiler Manufacturing Processhttps://www.cleaverbrooks.com

  5. Forbes Marshall – Boiler Delivery and Installation Planninghttps://www.forbesmarshall.com

  6. Thermax – Industrial Boiler Project Scheduleshttps://www.thermaxglobal.com

  7. IEA – Industrial Energy Systems Reportshttps://www.iea.org

  8. Spirax Sarco – Steam Boiler Project Considerationshttps://www.spiraxsarco.com

  9. ResearchGate – Lead Time Analysis in Boiler Manufacturinghttps://www.researchgate.net

  10. ScienceDirect – Boiler Supply Chain and Delivery Studieshttps://www.sciencedirect.com

Wade Zhang

CEO of Taishan Group Taian Boao International Trade Co., Ltd. 30 years experience in Global industrial boiler market,  Over 300 boiler projects experience, including 21+ EPC projects. Projects span 30+ countries & regions, involving industries such as nuclear power, energy & electricity, municipal heating, mining, textiles, tires etc.

Typical Lead Time for Industrial Steam Boiler Manufacturing and Delivery Read More »

Scroll to Top

Get Quick Support

Taishan Group
Make an appointment with us to meet at exhibition
Quick Contact